

Abstract
Prolactin elevation is a side effect of all currently available D2 receptor antagonists used in the treatment of schizophrenia. Prolactin elevation is the result of a direct antagonistic D2 effect blocking the tonic inhibition of prolactin release by dopamine. The aims of this work were to assess the correlation between in vitro estimates of D2 receptor affinity and pharmacokinetic–pharmacodynamic model-based estimates obtained from analysis of clinical data using an agonist–antagonist interaction (AAI) model and to assess the value of such a correlation in early prediction of full prolactin time profiles. A population model describing longitudinal prolactin data was fitted to clinical data from 16 clinical phases 1 and 3 trials including five different compounds. Pharmacokinetic data were modeled for each compound and the prolactin model was both fitted in per-compound fits as well as simultaneously to all prolactin data. Estimates of prolactin elevating potency were compared to corresponding in vitro values and their predictability was evaluated through model-based simulations. The model successfully described the prolactin time course for all compounds. Estimates derived from experimental preclinical data and the model fit of the clinical data were strongly correlated (p < 0.001), and simulations adequately predicted the prolactin elevation in five out of six compounds. The AAI model has the potential to be used in drug development to predict prolactin response for a given exposure of D2 antagonists using routinely produced preclinical data.
Key words: in vitro–in vivo correlation, pharmacodynamic scaling, population modeling, prolactin
INTRODUCTION
The main treatment options for schizophrenia rely on dopamine 2 (D2) receptor antagonism as primary mechanism of action which has been the case for the last 40–50 years. New drug targets are being investigated but the clinical efficacy and safety of such compounds is still unclear and it is uncertain whether it will be possible to completely move away from blockade of the D2 receptor (1, 2). Antagonism of the D2 receptor causes some unwanted effects such as extrapyramidal symptoms (EPS) and elevated prolactin levels (3). Atypical antipsychotics (APs) such as olanzapine have less EPS and are also believed to have a prolactin-sparing effect compared to the older typical APs, e.g., haloperidol (4). There are many theories on what makes an atypical AP atypical compared to a typical AP and concepts typically include differences in affinity to receptors or receptor subtypes, blood/brain ratios, or other aspects of receptor–ligand interactions such as association and dissociation rate constants (5–7).
The prolactin elevating effects are caused by the antagonism of dopamine at the level of the anterior pituitary, which is situated outside the blood–brain barrier. Dopamine inhibits prolactin release and a negation of this inhibition stimulates prolactin release. Elevated prolactin levels cause downstream endocrine effects such as amenorrhea, galactorrhea, and sexual dysfunction. The prolactin elevation of APS is primarily related to dopamine antagonism. On a per-compound level, prolactin elevation has been found to correlate with antipsychotic effect (8), which in turn is correlated with in vitro findings of compound affinity to D2 receptors (9). If a compound under development has antagonistic properties at the D2 receptor, it should therefore be possible to use in vitro affinity values to predict the in vivo prolactin levels at a drug concentration. To add to the complexity of evaluating prolactin response to antipsychotic drugs, prolactin release has a diurnal rhythm and exhibits tolerance development following exposure to APs. Mechanistic pharmacokinetic–pharmacodynamic (PKPD) modeling that considers characterization of the full time course of prolactin is well suited to address many of these complexities and allows for incorporation of preclinical information in a mechanistically plausible way.
The time course of PKPD relationships of APs and prolactin have been described in two main ways: the depletable pool approach or the agonist–antagonist interaction (AAI) approach (10–12). The pool model, developed from data collected following the administration of two 30-min infusions of remoxipride, inadequately described the data from trials also where diurnal rhythm in prolactin was apparent even after a diurnal component was included (11). The AAI model has however been shown to adequately describe the risperidone and paliperidone data as well as the remoxipride data (11, 13) and appears to be the most adequate model to describe prolactin data typically generated from clinical trials. The AAI model was therefore applied in the current analysis. Previous efforts describing longitudinal prolactin data have modeled one compound or active moiety at a time and there has never been any formal model-based comparison of prolactin response between compounds, despite that parameter estimates describing the underlying system, the system-related parameters, should be similar across drugs. The system-related parameters in the AAI model are those related to prolactin and dopamine turnover and the diurnal prolactin release. Only one parameter (Ki) is drug specific and related to the drug potency to induce prolactin elevation.
The objectives of this work were (1) to simultaneously apply the AAI modeling to six compounds with varying potency as D2 receptor antagonists and estimate a potency parameter for prolactin increase Ki(m) for each drug,(2) to compare the model estimated Ki(m) to in vitro values of D2 receptor affinity Ki(i), and (3) to investigate the use of in vitro values (Ki(i)) and system-related parameter estimates to perform simulations of prolactin profiles in patients for predictive use.
METHODS AND SUBJECTS
AAI Model
The AAI model (11) consists of two turnover models (Eq. 1): one for prolactin (PRL) and one (hypothetical) for dopamine (DAs). Prolactin production is described by the zero-order rate kin and the first-order elimination of prolactin by the rate constant kout. Dopamine, as an unobserved part of the model, is scaled to be in excess and therefore dopamine baseline, DAs0, is fixed to a high value (Eq. 2). The turnover of dopamine is determined by the rate constant kDA. Dopamine interacts competitively with plasma drug concentrations of the unbound antipsychotic (Cp,u) scaled by the estimated potency parameter Ki(m), as described in Eq. 3. The interaction regulates the magnitude of the inhibition of prolactin production. From the prolactin compartment, there is a positive feedback function on the dopamine production to account for the tolerance development, which magnitude is determined by the estimated exponent γ. Diurnal rhythm (DIU) is described by two cosine functions (with a 24- and 12-h period, respectively) on the prolactin production rate and is characterized by the amplitudes (AMP) and peak times (PHS) (Eqs. 3 and 4).
 |
1 |
 |
2 |
 |
3 |
 |
4 |
As outlined in the introduction, the Ki(m) parameter is considered to be drug specific and all other parameters system specific. A graphical representation of the model is shown in Fig. 1.
Fig. 1.
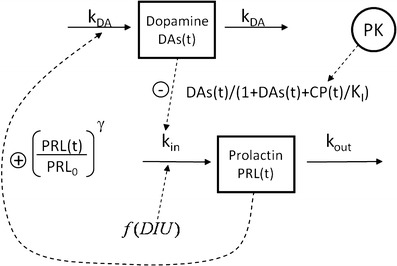
The applied agonist–antagonist interaction model consists of two turnover models, one for prolactin and one for a hypothetical dopamine compartment. The effect parameter on prolactin (K i) is estimated from the interaction between drug concentration and dopamine. A feedback from prolactin to dopamine as well as diurnal rhythm is also included
Clinical Data
The main focus here was to estimate the Ki(m) parameter for different compounds and therefore richer phase 1 data were chosen over sparse phase 3 data to save computation time, where both types of data were available. In addition to the phase 1 risperidone/paliperidone data used in the model development (11), phase 1 data from three other compounds currently or previously under development for antipsychotic use at Janssen Research and Development (Janssen R&D) were included. The compounds in current or past development were JNJ-37822681 (14), R167154 (15), and JNJ-39269646 and will in this work be called compounds A, B, and C, respectively. Placebo arms/periods from these phase 1 programs were also included in the analysis to inform the placebo model. To evaluate estimates of Ki(m) from sparse clinical data, olanzapine phase 3 comparator data were also included in the analysis. In total, data from 16 trials, comprising of 15,551 prolactin samples from 1,000 individuals on five compounds, were included in the analysis. An overview of the studies can be found in Table I. All studies were conducted according to the Helsinki declaration and informed consent was obtained from all subjects.
Table I.
Characteristics of Included Studies
| Study | Subjects | Healthy volunteers/patients | Compound | Type of study | Dose (mg) | Prolactin samples |
|---|---|---|---|---|---|---|
| 1 | 4 | HV | PALI OROS | Phase I single dose/PET | 6 | 84 |
| 28 | 9 | HV | RIS | Phase I single dose | 1/placebo | 311 |
| 101 | 105 | PAT | RIS/PALI OROS | Phase I multiple dose | 2/4/12/placebo | 3178 |
| 303 | 122 | PAT | OLA | Phase III multiple dose | 10 | 442 |
| 304 | 102 | PAT | OLA | Phase III multiple dose | 10 | 346 |
| 305 | 121 | PAT | OLA | Phase III multiple dose | 10 | 436 |
| 1001 | 27 | HV | A | Phase I single dose | 0.5/2/5/10/15/20/placebo | 745 |
| 1671 | 80 | HV | B | Phase I single dose | 8/16/20/24/28/placebo | 1231 |
| 1672 | 64 | HV | B | Phase I multiple dose | 8/16/24/32/placebo | 361 |
| 1673 | 140 | PAT | B | Phase I multiple dose | 2/4/8/16/32/36/40/48/56/64/72/88/placebo | 2567 |
| 2003 | 33 | PAT | A | Phase I multiple dose | 20/30/40/50/60/70/80 | 928 |
| 6461 | 56 | HV | C | Phase I single dose | 5/15/50/100/200/300/400/placebo | 1176 |
| 6462 | 48 | HV | C | Phase I multiple dose | 37.5/75/100/125/200/250/placebo | 1109 |
| 9005 | 12 | HV | RIS | Phase I single dose | 1/placebo | 609 |
| 10031 | 26 | HV | A | Phase I single dose | 0.5/2/5/10/placebo | 839 |
| 10032 | 46 | HV | A | Phase I multiple dose | 5/7/10/placebo | 1192 |
HV healthy volunteers, PAT patients, PALI OROS paliperidone extended release formulation, RIS risperidone, OLA olanzapine, A JNJ-37822681, B R167154, C JNJ-39269646
Preclinical Data
In vitro Ki(i) values were internal estimates from Janssen R&D obtained through displacement of ligand from cloned human D2 receptors with radiolabeled raclopride (16). All Ki(i) values, except for compound B (an older compound, analyzed earlier), were from the same experiment and the same batch of membrane/receptor. The in vitro values, and their uncertainty estimates (from triplicate experiments), can be found in Table II, where also molecular weights and model estimates of Ki are listed. As the model had previously been applied to remoxipride data (13), and an in vitro Ki value was available for this compound in the in-house preclinical dataset, these results were also included in the comparison of in vitro Ki values with Ki(m) values estimated from the AAI model. Protein binding and molecular weights were used to express previous estimates of risperidone and remoxipride Ki in terms of free concentrations and molar units.
Table II.
In Vitro Values of K i, Fraction Unbound (F u), and Molecular Weights (Mw). System-Related Parameter Estimates from Per-Compound Fit (Not Possible for Olanzapine Data, Only K i and Baselines Were Estimated) Compared to Published Values
| Risperidone/paliperidone (Friberg et al. (11)) | Remoxipride (Ma et al. (13)) | Olanzapine | A | B | C | |
|---|---|---|---|---|---|---|
| Preclinical data | ||||||
| F u | 0.16 | 0.19 | 0.07 | 0.15 | 0.13 | 0.30 |
| Molecular weight (g/mol) | 410.5 | 371.3 | 312.4 | 372.0 | 433.0 | 308.5 |
| K i(i) (nM) (%RSE) | 2.1 (6) | 166 (24) | 13.0 (7) | 22.0 (20) | 9.0 (13) | 93.7 (4) |
| Model estimates (%RSE) | ||||||
| k out (h−1) (all/HV) | 0.664 (12) | 1.19 (9.8) | – | 2.04 (18) | 0.82 (21) | 1.11 (14) |
| k out (h−1) PAT | – | 0.79 (7.4) | 0.54(11) | – | ||
| PRL0 HV (ng/ml) | 7.67 (9.4) | 8.80 (6.6) | 9.0 (4.7) | 9.0 (8.8) | 13.5 (4.1) | 11.7 (3.5) |
| PRL0 Fem (ng/ml or %a) | 35.2 (4.2) | – | 185a (13) | 236a (38) | –b | –b |
| k DA (h−1) | 0.156 (6.2) | 0.145 (8.4) | – | 0.076 (11) | 0.038 (26) | 0.077 (8.1) |
| γ | 1.44 (3.4) | 1.86 (9.8) | – | 1.35 (9.0) | 1.95 (11) | 1.73 (7.7) |
| AMP1 | 0.532 (7.9) | 0.192 (42) | – | 0.28 (5.4) | 0.51 (4.1) | 0.42 (9.1) |
| PHS1 (h) | 20.1 (1.2) | 20.8 (1.5) | – | 19.4 (1.8) | 17.8 (1.6) | 19.5 (1.7) |
| AMP2 | −0.314 (7.3) | −0.32 (22.9) | – | −0.186 (7.8) | −0.30 (4.6) | −0.14 (10) |
| PHS2 (h) | 13.7 (2.2) | 13.5 (1.3) | – | 14.9 (2.5) | 11.6 (1.4) | 12.9 (2.4) |
| ΔPHSPAT (h) | −1.61 (17) | – | – | −1.0 (67) | −0.51(30) | – |
| K i(m) (nM,(F u)) | 0.760 (9.0) | 56.8 (15.7) | 4.81(21) | 1.29 (16) | 3.24 (17) | 30.4 (8.5) |
| IIV k out (all/HV)(%CV) | 77 (14) | 25 (29) | – | 46 (11) | 26 (24) | 59 (21) |
| IIV k out PAT (% CV) | – | – | – | 360 (36) | 38 (20) | – |
| IIV PRL0 (all/HV)(%CV) | 67 (3.4) | 12 (26) | – | 61 (8.5) | 39 (8.0) | 24 (10) |
| IIV PRL0 PAT (%CV) | – | – | – | – | 73 (5.2) | – |
| IIV AMP1 (%CV) | 24 (26) | – | – | 28 (6.1) | 22 (7.6) | 20 (36) |
| IIV PHS2 (h) | 1.3 (15) | – | – | 2.2 (9.5) | 0.48 (14) | 1.3 (22) |
| IIV K i(m) (%CV) | 135 (5.4) | 54 (23) | – | 102 (2.5) | 139 (15) | 59 (19) |
HV healthy volunteers, PAT patients, A JNJ-37822681, B R167154, C JNJ-39269646, RSE relative standard errors, AMP amplitudes, PHS peak times, PRL prolactin
aFemale baseline was either estimated as a separate baseline or relative to males
bIn the fits of compound B, the baseline increase in women was fixed to previously found value due to few women in these datasets (three to six women), the study on compound C included no women
Pharmacokinetic Models
Individual pharmacokinetic parameters used to predict the time course of drug concentrations were either from population models that were: developed at Janssen R&D (risperidone), developed for this work (olanzapine, compounds A, B, and C), or previously published (remoxipride, paliperidone) (17, 18). The PK models were one (olanzapine) or two (A, B, C) compartment models with first-order or sequential zero–first-order absorption. Elimination was linear in all but one model (compound C) that had an additional nonlinear Michaelis–Menten elimination pathway.
Modeling Approach
The AAI model parameters were estimated for each compound’s data (and the placebo arms of corresponding trials) individually as well as simultaneously for all compounds. When parameters were estimated simultaneously for all compounds, there were difficulties obtaining the asymptotic standard errors. Therefore, parameter uncertainty was determined using a nonparametric bootstrap approach. Covariate relationships for fixed and random effects were based on a drop in objective function value of 10.83 points, corresponding to a p value of 0.001 for a one parameter difference. Model fit was evaluated through goodness-of-fit plots and visual predictive checks. The estimated Ki(m) values were compared to the in vitro values (Ki(i)) by linear regression (Eq. 5), an intercept was not estimated to produce scalability down to low Ki(i).
 |
5 |
To investigate the predictability of Ki(i) values on prolactin elevation and the impact of potential discrepancies in relation to parameter uncertainty, simulations of the time course of prolactin in patients were made. This was done by comparing simulations of prolactin increase over 24 h (Eq. 6), from three different sets of parameters for each compound: (1) Ki(i) in combination with previously published system-related parameters (11), (2) Ki(m)_predicted (which is Ki(i) · slope, determined in Eq. 5) with system-related parameters from combined fit, and (3) Ki(m) and system-related parameters obtained from the per-compound fit. Scenario 3 was considered to represent the best case scenario as the values are completely driven by the clinical observations and this flexibility naturally resulted in the best fit to each subdataset. The comparison was made through simulations of typical PK and prolactin profiles following either a clinically used dose or a suggested efficacious dose (based on trial outcomes or predicted occupancy levels) of each compound. Simulated elevations in prolactin AUC over 24 h, i.e., predicted increase caused by drug exposure compared to the placebo model, were calculated using Eq. 6. Parameter uncertainties (from covariance steps or bootstraps) in typical parameter estimates, in PK, PD, and in vitro, were taken into account.
 |
6 |
Software used was FOCE in NONMEM versions 7.12 for parameter estimation and simulations and PsN (19) for pre/post processing and run handling. For plotting, data management, and other statistics, R and the plotting functions in Xpose (20, 21) were used. All analyses were performed using the transform both sides approach, i.e., observations and predictions were on the log scale and residual error was additive on this scale.
RESULTS
All substances except olanzapine had rich prolactin concentration data and allowed for a separate estimation of all parameters. In this per substance model fit, the system parameters of the AAI model showed concordance across datasets and with previously published values for a majority of the parameters (Table II). The parameters that differed most were turnover rate of tolerance (kDA, 0.038–0.156 h−1) and prolactin kout (0.664–1.48 h−1). The Ki(m) values from the per-compound fits are also reported in Table II.
When combining all prolactin data in a simultaneous analysis, baseline prolactin values were found to differ significantly between some studies, and study dependence was added to the model as a separate fixed effect (Table III). Variability in baseline was found to differ between healthy and patient subjects, but no difference in typical prolactin baseline between the two populations was of significance when parameter differences were included for the turnover of prolactin (kout). The value of Ki(m) for risperidone decreased from 0.76 nM in the previous analysis to 0.18 nM in the combined analysis, but all other parameters were similar to the per-compound fits. Interoccasion variability (IOV) was not considered here due to adequate performance of the model without the extra computational burden of estimating IOV and the difficulty of defining what time interval constitutes an occasion in the diverse datasets. Due to long runtimes (2+ weeks for one single run), a limited bootstrap of 25 samples of the combined dataset were used to construct relative standard errors (RSE%) for fixed effects and variance estimates. Overall standard errors were low (<20%).
Table III.
Estimates and Standard Errors of Estimates from Combined Fit
| Parameter | Value | Unit | RSE (%) | IIV (%) | RSE IIV (%) |
|---|---|---|---|---|---|
| k out PAT | 0.60 | h−1 | 6.13 | 81 | 7.94 |
| k out HV | 1.62 | 5.9 | 67 | 8.97 | |
| PRL0 HV | 11.7 | ng/ml | 1.82 | 36 | 6.45 |
| PRL0 PAT | 61 | 1.91 | |||
| Relative PRL0 women | 180 | % | 12.1 | ||
| k DA | 0.098 | h−1 | 4.19 | ||
| γ | 1.6 | 3.37 | |||
| AMP1 | 0.45 | – | 3.23 | 35 | 7.38 |
| PHS1 | 19.6 | h | 0.59 | ||
| AMP2 | −0.22 | – | 2.6 | ||
| PHS2 | 13.3 | h | 0.99 | 1 (s.d.(h)) | 9.94 |
| Phase shift in PAT | −1.64 | 9.49 | |||
| K i(m) RIS/PALI | 0.18 | nM | 10.5 | 90 | 5.94 |
| K i(m) Olanzapine | 6.96 | 11.1 | |||
| K i(m) A | 1.85 | 6.4 | |||
| K i(m) B | 2.40 | 14.5 | |||
| K i(m) C | 34.8 | 6.13 | |||
| Residual error in men HV | 27 | % | 1.67 | ||
| Rel. RE in PAT | 139 | 2.39 | |||
| Rel. RE in Women | 123 | 6.01 | |||
| PRL0 STU 28 and 9005 | −66 | 3.08 | |||
| PRL0 STU 101 | −41 | 8.65 | |||
| PRL0 STU 303–305 | 22 | 18.2 | |||
| PRL0 STU 1673 | −30 | 13.5 |
RSE relative standard errors, PAT patients, HV healthy volunteers, PRL prolactin, AMP amplitudes, PHS peak times, RIS risperidone, PALI paliperidone, A JNJ-37822681, B R167154, C JNJ-39269646, Rel. RE relative change in residual error, STU study
Plots of model fit and evaluation through simulations showed a good fit to the prolactin data with satisfactory simulation properties (Figs. 2 and 3). The Ki values estimated from the model correlated strongly with corresponding in vitro values both when the datasets of the different drugs were fitted individually (R2 = 0.94, p < 0.001) and when all data were fitted simultaneously (R2 = 0.94, p < 0.001). The relationship was ~1:3 for model/in vitro, i.e., slope was estimated to 0.3 (Fig. 4).
Fig. 2.
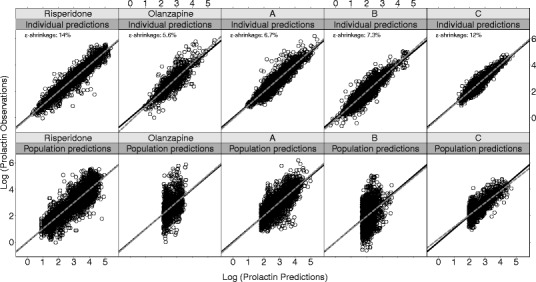
Goodness-of-fit shown as log-transformed observations vs. individual and population predictions for each compound from the combined model fit. Epsilon shrinkages are weighted averages for each compound
Fig. 3.
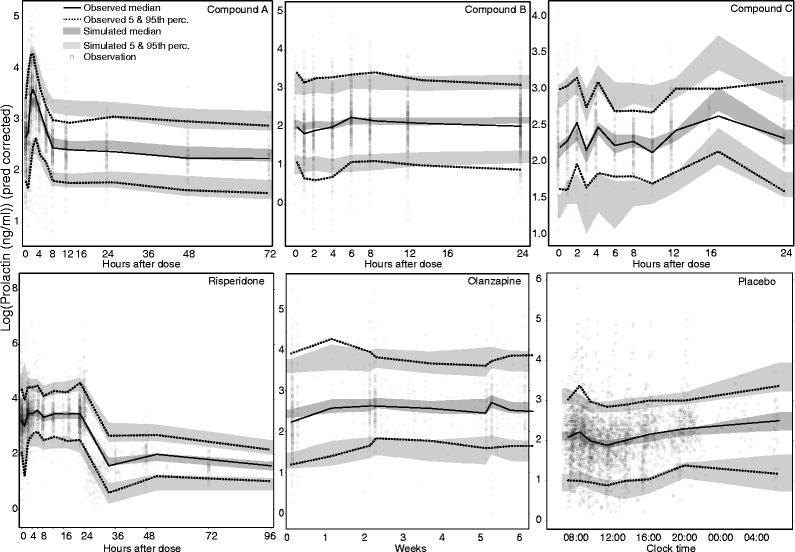
Visual predictive checks for the combined model fit. Observed and simulated values were prediction-corrected (33) to account for the large dose range and differences in covariate values. Five hundred simulations were performed to create 95% confidence bands around the 5th, 50th, and 95th percentiles
Fig. 4.
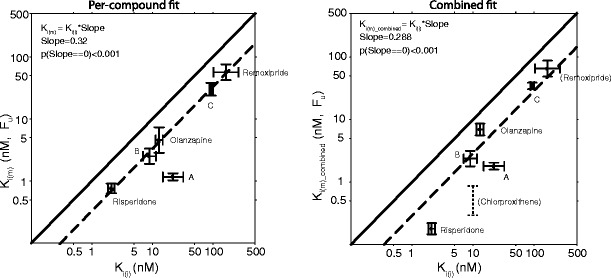
Estimates of K i(m) from per-compound fit (left) and combined fit (right) vs. in vitro estimates K i(i). Solid lines are lines of identity and dotted lines are regression lines. The remoxipride data were not included in the combined fit and the estimate is therefore the same in both plots. Chlorprothixene values in the right panel were obtained from the literature and were not included in the regression
Simulations of typical time courses of prolactin levels showed good performance for the Ki(m)_predicted predicted by weighted linear regression compared to the best case scenario (Ki(m)) for all compounds but compound A. Using in vitro values directly (Ki(i)) resulted in under prediction of the prolactin elevation (Fig. 5). The predictions appeared to not be sensitive to the difference in Ki(m) and Ki(m)_predicted for risperidone as both values resulted in similar AUC. PK parameters for the models developed for this analysis are found in Table IV.
Fig. 5.

Comparisons of model simulations of prolactin elevation (AUC0-24h) using three different set of parameters. The top scenario (iii) is considered to be based on the true, data-driven estimates for each compound. The middle scenario (ii) is based on predictions from K i(m)_predicted and system parameters from the combined fit. The bottom scenario (i) is obtained using previously published system-related parameters and K i(i) directly. Median and 95th percentiles of simulated AUCs are presented. Plots are based on 10,000 simulations of typical prolactin profiles
Table IV.
Parameters of Developed PK Models. Values Within Parentheses Are CVs of Log-Normal Distributions of Interindividual Random Effects (Estimated When Statistically Significant)
| Olanzapinea | A | B | C | |
|---|---|---|---|---|
| CL/F R (l/h) | 19.9 (22%) | 31.2 (23%) | 335 (20%) | 12.9 (62%) |
| V c/F R (l) | 761 | 381 (27%) | 3,290 | 676 (75%) |
| K a (h−1) | 0.60 | 1.36 (114%) | 0.65 (41%) | 1.41 (72%) |
| WT-V c covariateb | 0.55 | – | – | – |
| V p/F R (l) | – | 604 (44%) | 2,010 (19%) | 381 (30%) |
| Q/F R (l/h) | – | 45.6 | 530 | 91 (24%) |
| LAG (h) | – | 1.0 (80%) | – | 0.23 (4%) |
| F R c | – | 1 FIX (20%) | 1 FIX (53%) | 1 FIX |
| DUR (h)d | – | 0.67 (110%) | 1.5 (28%) | – |
| F R-dose covariatee | – | – | 0.014 | – |
| V MAX (mg/h) | – | – | – | 7.37 |
| K m (ng/ml) | – | – | – | 37.7 |
A JNJ-37822681, B R167154, C JNJ-39269646
aOlanzapine is a one-compartment model, A–C are two-compartment models
bParameterized as percent increase (percent per kilogram) in V/F R from the median weight, WT (73.9 kg)
c F R is relative bioavailability; typical value is 1
dAbsorption duration in a sequential zero–first-order absorption model
eIncrease in bioavailability from the median dose (48 mg)
DISCUSSION
The AAI model was successfully applied to all datasets, except for the sparse olanzapine data. The majority of the system-related parameters were similar across the different D2 receptor antagonists evaluated despite that the data originated from 16 different studies performed between 1989 and 2009, included somewhat different study populations, study aims, compounds of different classes, and the prolactin assay was changed during this time period. Considering this diversity, the AAI model was performing very well in characterizing the prolactin levels for these D2 receptor antagonists with a 100-fold difference in affinity and a wide range of dose levels. There was a strong correlation between the model parameter Ki (Ki(m)) and the Ki values obtained in vitro (Ki(i)). The Ki values predicted from the linear regression (Ki(m)_predicted) could well predict prolactin elevation in combination with the system-related parameters estimated in the combined analysis. For five of the six investigated compounds, the agreement was good, but for one substance (A) the agreement was poorer both in the per-compound and combined fit. These results indicate that also for a new compound the time course of prolactin and the prolactin elevation in patients may be predicted based on an in vitro Ki value for the new compound, the derived linear regression equation, the system-related parameters, and a predicted pharmacokinetic time course. These variables would generally be available early in drug development and would already then give a hint on the side effect profile of the drug. The approach in itself could of course also be applied to other disease areas where mechanistic models exist, and the models themselves could be developed on preclinical data in novel areas where human data are not available. Examples of where model-based pharmacodynamic scaling has been performed from animal to humans exist in myelosuppression (22), cortisol and hypothermia responses (23), opioid effects(24), and effects of ketoprofen (25); scaling from in vitro has however not previously been performed, to our knowledge.
The estimated model parameters of prolactin elevation potency showed a very strong linear correlation with in vitro values of compound D2 receptor affinity. Shown in Fig. 3, but not included in the regression, are the literature results for chlorprothixene (10). This value was reasonably well described by the regression line if using the lower end of the reported values of protein binding: 90% (26–28). For compound A, with not so good congruity, the model estimated the affinity to be ten times higher than expected from in vitro. For this compound, the Ki(i) was difficult to determine in vitro due to a high koff value and rapid dissociation from the D2 receptor. In accordance with the higher affinity determined by the model for compound A, the efficacy and dopamine-related side effects emerged at lower doses than anticipated in a phase 2 trial (29), suggesting that the true affinity is higher than that determined in vitro. The divergence is therefore not necessarily related to the model estimate or model misspecification. The prediction of prolactin elevation for remoxipride can be viewed as an external validation as this dataset was not included in the regression. Although not perfect, the confidence intervals overlapped and using Ki(m)_predicted performed better than using Ki(i) (Fig. 4).
The offset where Ki(m) was consistently higher than Ki(i) could be a model construct issue as prolactin elevation is scaled by the non-observed and non-identifiable dopamine baseline. The value to which DAs0 is fixed will affect the Ki(m) estimates. Because the same dopamine baseline was used for all compounds, the Ki(m) estimates can be compared, but the value of 10,000 might be too high. Trying to fix the Ki(m) and estimate DAs0 was not possible. Setting a lower value of this parameter could bring the estimates closer to the range of the in vitro values, but the value 10,000 was kept for comparison with published analyses. The offset could also be related to the experimentally determined Ki(i) values. The ratio between risperidone and olanzapine Ki(i) was 1:6, which is the same ratio as reported by Schotte et al.(30) but their absolute values were ~2.5 times higher than those applied here.
System-related parameter estimates showed high consistency between drugs and datasets and were associated with low standard errors (Tables II and III). kDA was the parameter showing the highest between dataset variability, probably due to the fact that in some studies no prolactin samples were taken during the time period where tolerance is expected to be observed. Compared to the earlier published version of the model (11), patient status was now found to be a significant covariate on the variability in both baseline and prolactin turnover (kout) in the combined analysis. The earlier publication included both healthy volunteer and patient data attributed changes in prolactin levels between patients and healthy volunteers to differences in the prolactin typical baseline parameter while in the current analysis the difference was consistently best characterized as a difference in turnover (kout). The estimated prolactin half-life for healthy volunteers (25 min) was more consistent which is more in line with published values of half-life in plasma (30 min) (31) than the previous estimate (60 min) (11). Diurnal rhythm parameters and the patient shift in diurnal rhythm were similar to previous estimates and consistent with literature (32, 33). The study dependence in prolactin baseline was expected given the span of the data. Trials 28 and 9005 used a different prolactin assay which has been shown to have the same variability but systematically shift the prolactin concentrations (internal data). Trial 101 was the only study in patients with stable schizophrenia, compared to acute schizophrenia in the other trials. Studies 303, 304, and 305 were the only phase 3 trials in patients. Given these circumstances, the differing baselines in these trials were not so surprising. The reason for the differing baseline in phase I study 1673 could however not be explained. Changes in system parameter between datasets could possibly be attributed to effects of other receptor systems, such an effect should however be largest in Ki(m) and a difference could then not be tested.
A drawback of this approach is that simulation of the time course of prolactin in patients requires prediction of the pharmacokinetics or a target concentration range for the compound of interest. This can be achieved using allometric scaling approaches or in silico methods like PBPK and are commonly applied in drug development to predict the PK before entering phase I studies.
CONCLUSION
The AAI model was successfully applied to six different compounds and potency parameters for these were obtained simultaneously. These estimates showed a strong correlation to in vitro values of receptor affinity. In conjunction with these preclinical Ki values, the model was shown to be a useful tool to predict typical longitudinal prolactin data for men and women, patients, and healthy volunteers. Prolactin elevation for one of the compounds were however not so successfully predicted, and as a follow-up, we are considering to use modeling developed using rat data following administration of the same compound to investigate the predictive performance as compared to the approaches applied in the current analysis.
Acknowledgments
Klas Petersson would like to acknowledge Janssen Pharmaceutica N.V. for sponsorship of his PhD work. Part of the computations were performed on resources provided by SNIC through Uppsala Multidisciplinary Center for Advanced Computational Science (UPPMAX) under Project p2011063
References
- 1.Kapur S, Remington G. Dopamine D(2) receptors and their role in atypical antipsychotic action: still necessary and may even be sufficient. Biol Psychiatry. 2001;50(11):873–883. doi: 10.1016/S0006-3223(01)01251-3. [DOI] [PubMed] [Google Scholar]
- 2.Biedermann F, Fleischhacker WW. Emerging drugs for schizophrenia. Expert Opin Emerg Drugs. 2011;16(2):271–282. doi: 10.1517/14728214.2011.556112. [DOI] [PubMed] [Google Scholar]
- 3.Petty RG. Prolactin and antipsychotic medications: mechanism of action. Schizophr Res. 1999;35(Suppl):S67–S73. doi: 10.1016/S0920-9964(98)00158-3. [DOI] [PubMed] [Google Scholar]
- 4.Turrone P, Kapur S, Seeman MV, Flint AJ. Elevation of prolactin levels by atypical antipsychotics. Am J Psychiatry. 2002;159(1):133–135. doi: 10.1176/appi.ajp.159.1.133. [DOI] [PubMed] [Google Scholar]
- 5.Meltzer HY, Matsubara S, Lee JC. Classification of typical and atypical antipsychotic drugs on the basis of dopamine D-1, D-2 and serotonin2 pKi values. J Pharmacol Exp Ther. 1989;251(1):238–246. [PubMed] [Google Scholar]
- 6.Kapur S, Langlois X, Vinken P, Megens AA, De Coster R, Andrews JS. The differential effects of atypical antipsychotics on prolactin elevation are explained by their differential blood–brain disposition: a pharmacological analysis in rats. J Pharmacol Exp Ther. 2002;302(3):1129–1134. doi: 10.1124/jpet.102.035303. [DOI] [PubMed] [Google Scholar]
- 7.Kapur S, Seeman P. Does fast dissociation from the dopamine d(2) receptor explain the action of atypical antipsychotics?: a new hypothesis. Am J Psychiatry. 2001;158(3):360–369. doi: 10.1176/appi.ajp.158.3.360. [DOI] [PubMed] [Google Scholar]
- 8.Langer G, Sachar EJ, Gruen PH, Halpern FS. Human prolactin responses to neuroleptic drugs correlate with antischizophrenic potency. Nature. 1977;266(5603):639–640. doi: 10.1038/266639a0. [DOI] [PubMed] [Google Scholar]
- 9.Seeman P, Lee T, Chau-Wong M, Wong K. Antipsychotic drug doses and neuroleptic/dopamine receptors. Nature. 1976;261(5562):717–719. doi: 10.1038/261717a0. [DOI] [PubMed] [Google Scholar]
- 10.Bagli M, Suverkrup R, Quadflieg R, Hoflich G, Kasper S, Moller HJ, et al. Pharmacokinetic–pharmacodynamic modeling of tolerance to the prolactin-secreting effect of chlorprothixene after different modes of drug administration. J Pharmacol Exp Ther. 1999;291(2):547–554. [PubMed] [Google Scholar]
- 11.Friberg LE, Vermeulen AM, Petersson KJ, Karlsson MO. An agonist–antagonist interaction model for prolactin release following risperidone and paliperidone treatment. Clin Pharmacol Ther. 2009;85(4):409–417. doi: 10.1038/clpt.2008.234. [DOI] [PubMed] [Google Scholar]
- 12.Movin-Osswald G, Hammarlund-Udenaes M. Prolactin release after remoxipride by an integrated pharmacokinetic–pharmacodynamic model with intra- and interindividual aspects. J Pharmacol Exp Ther. 1995;274(2):921–927. [PubMed] [Google Scholar]
- 13.Ma G, Friberg LE, Movin-Osswald G, Karlsson MO. Comparison of the agonist–antagonist interaction model and the pool model for the effect of remoxipride on prolactin. Br J Clin Pharmacol. 2010;70(6):815–824. doi: 10.1111/j.1365-2125.2010.03758.x. [DOI] [PMC free article] [PubMed] [Google Scholar]
- 14.Te Beek ET, Moerland M, de Boer P, van Nueten L, de Kam ML, Burggraaf J, et al. Pharmacokinetics and central nervous system effects of the novel dopamine D2 receptor antagonist JNJ-37822681. J Psychopharmacol. 2011;26(8):1119–1127. doi: 10.1177/0269881111415733. [DOI] [PubMed] [Google Scholar]
- 15.Mesens N, Steemans M, Hansen E, Verheyen GR, Van Goethem F, Van Gompel J. Screening for phospholipidosis induced by central nervous drugs: comparing the predictivity of an in vitro assay to high throughput in silico assays. Toxicol In Vitro. 2010;24(5):1417–1425. doi: 10.1016/j.tiv.2010.04.007. [DOI] [PubMed] [Google Scholar]
- 16.Tresadern G, Bartolome JM, Macdonald GJ, Langlois X. Molecular properties affecting fast dissociation from the D2 receptor. Bioorg Med Chem. 2011;19(7):2231–2241. doi: 10.1016/j.bmc.2011.02.033. [DOI] [PubMed] [Google Scholar]
- 17.Movin-Osswald G, Hammarlund-Udenaes M. Remoxipride: pharmacokinetics and effect on plasma prolactin. Br J Clin Pharmacol. 1991;32(3):355–360. doi: 10.1111/j.1365-2125.1991.tb03911.x. [DOI] [PMC free article] [PubMed] [Google Scholar]
- 18.Vermeulen A, Piotrovsky V, Ludwig EA. Population pharmacokinetics of risperidone and 9-hydroxyrisperidone in patients with acute episodes associated with bipolar I disorder. J Pharmacokinet Pharmacodyn. 2007;34(2):183–206. doi: 10.1007/s10928-006-9040-2. [DOI] [PubMed] [Google Scholar]
- 19.Lindbom L, Ribbing J, Jonsson EN. Perl-speaks-NONMEM (PsN)—a Perl module for NONMEM related programming. Comput Methods Prog Biomed. 2004;75(2):85–94. doi: 10.1016/j.cmpb.2003.11.003. [DOI] [PubMed] [Google Scholar]
- 20.Jonsson EN, Karlsson MO. Xpose—an S-PLUS based population pharmacokinetic/pharmacodynamic model building aid for NONMEM. Comput Methods Prog Biomed. 1999;58(1):51–64. doi: 10.1016/S0169-2607(98)00067-4. [DOI] [PubMed] [Google Scholar]
- 21.R: A language and environment for statistical computing. Vienna, Austria: R Foundation for Statistical Computing; 2010.
- 22.Friberg LE, Sandstrom M, Karlsson MO. Scaling the time-course of myelosuppression from rats to patients with a semi-physiological model. Invest New Drugs. 2010;28(6):744–753. doi: 10.1007/s10637-009-9308-7. [DOI] [PubMed] [Google Scholar]
- 23.Zuideveld KP, Van der Graaf PH, Peletier LA, Danhof M. Allometric scaling of pharmacodynamic responses: application to 5-Ht1A receptor mediated responses from rat to man. Pharm Res. 2007;24(11):2031–2039. doi: 10.1007/s11095-007-9336-y. [DOI] [PubMed] [Google Scholar]
- 24.Yassen A, Olofsen E, Kan J, Dahan A, Danhof M. Animal-to-human extrapolation of the pharmacokinetic and pharmacodynamic properties of buprenorphine. Clin Pharmacokinet. 2007;46(5):433–447. doi: 10.2165/00003088-200746050-00005. [DOI] [PubMed] [Google Scholar]
- 25.Lepist EI, Jusko WJ. Modeling and allometric scaling of s(+)-ketoprofen pharmacokinetics and pharmacodynamics: a retrospective analysis. J Vet Pharmacol Ther. 2004;27(4):211–218. doi: 10.1111/j.1365-2885.2004.00579.x. [DOI] [PubMed] [Google Scholar]
- 26.Raaflaub J. On the pharmacokinetics of chlorprothixene in man. Experientia. 1975;31(5):557–558. doi: 10.1007/BF01932456. [DOI] [PubMed] [Google Scholar]
- 27.Quitkin FM, editors. Current psychotherapeutic drugs. 2nd ed. Washington: American Psychiatric; 1998.
- 28.Seyffart G. Drug dosage in renal insufficiency. New York: Springer; 1991. [Google Scholar]
- 29.Schmidt ME, Kent JM, Daly E, Janssens L, Van Osselaer N, Husken G, et al. A double-blind, randomized, placebo-controlled study with JNJ-37822681, a novel, highly selective, fast dissociating D(2) receptor antagonist in the treatment of acute exacerbation of schizophrenia. Eur Neuropsychopharmacol. 2012;22(10):721–733. doi: 10.1016/j.euroneuro.2012.02.007. [DOI] [PubMed] [Google Scholar]
- 30.Schotte A, Janssen PF, Gommeren W, Luyten WH, Van Gompel P, Lesage AS, et al. Risperidone compared with new and reference antipsychotic drugs: in vitro and in vivo receptor binding. Psychopharmacology (Berl) 1996;124(1–2):57–73. doi: 10.1007/BF02245606. [DOI] [PubMed] [Google Scholar]
- 31.Cooper DS, Ridgway EC, Kliman B, Kjellberg RN, Maloof F. Metabolic clearance and production rates of prolactin in man. J Clin Invest. 1979;64(6):1669–1680. doi: 10.1172/JCI109629. [DOI] [PMC free article] [PubMed] [Google Scholar]
- 32.Rao ML, Gross G, Strebel B, Halaris A, Huber G, Braunig P, et al. Circadian rhythm of tryptophan, serotonin, melatonin, and pituitary hormones in schizophrenia. Biol Psychiatry. 1994;35(3):151–163. doi: 10.1016/0006-3223(94)91147-9. [DOI] [PubMed] [Google Scholar]
- 33.Rao ML, Gross G, Halaris A, Huber G, Marler M, Strebel B, et al. Hyperdopaminergia in schizophreniform psychosis: a chronobiological study. Psychiatry Res. 1993;47(2):187–203. doi: 10.1016/0165-1781(93)90048-L. [DOI] [PubMed] [Google Scholar]