

Abstract
Gene expression is useful for identifying the molecular signature of a disease and for correlating a pharmacodynamic marker with the dose-dependent cellular responses to exposure of a drug. Gene expression offers utility to guide drug discovery by illustrating engagement of the desired cellular pathways/networks, as well as avoidance of acting on the toxicological pathways. Successful employment of gene-expression signatures in the later stages of drug development depends on their linkage to clinically meaningful phenotypic characteristics and requires a biologically meaningful mechanism combined with a stringent statistical rigor. Much of the success in clinical drug development is hinged on predefining the signature genes for their fitness for purposes of application. Specific examples are highlighted to illustrate the breadth and depth of the potential utility of gene-expression signatures in drug discovery and clinical development to targeted therapeutics at the bedside.
KEY WORDS: clinical molecular signatures, molecular signatures of disease, signature genes, target engagement, toxicological pathways
INTRODUCTION
With the increased availability and lowering costs of DNA technologies, gene expression has become a more readily used tool indispensable in drug discovery and development. Educational institutes and NIH have joined forces to produce several sizable publicly accessible gene expression databases, such as the Connectivity Map (1) and the Tox 21 project (2); these have been compiled to provide resources for mining, with the hopes to provide drug discovery opportunities and repurposing of drugs (3–5). In order to treat orphan diseases where it is difficult to pool enough data to provide an approvable drug, an enriched data source with multiple databases integrated properly is being pursued (6). Beyond discovery, examples of gene expression are being used in the clinic and demonstrate attempts to optimize personalized medicine (7,8). In light of the breadth and diverse application of gene expression in drug discovery and clinical application, this paper will briefly review examples of gene expression in various stages of drug development followed by a high-level strategic map of the fit-for-purpose application of gene expression with the recognition that this type of platform will continue to advance rapidly.
EARLY DISCOVERY
Depicting Drug Actions at the Molecular Level
One major advantage in drug development is the ability to leverage known biology by developing drug candidates that can either target or avoid specific pathways or networks. For example, the cellular pathways leading to cell death (apoptosis) can be a differentiator in oncology drug candidates; on the other hand, being able to avoid the same cell death pathways could lead to an improved drug safety profile in other therapeutic areas. Gene expression technologies, including microarray, quantitative real-time polymerase chain reaction, and next-generation sequencing, are useful for achieving that goal by illustrating engagement of the targeted receptor(s), pathway or network through the downregulated or upregulated pattern(s) of the intended drug target(s). As gene expression technologies advance, gene expression profiling of the whole genome has become affordable and thus more rapidly adopted. Whole genome expression profiling offers the advantage of providing a series of snapshots of the cellular transcriptional patterns to reveal the temporal cellular responses following exposure to a drug candidate and, thereby, depicts its extent of intracellular actions (9), as well as identifies the genes untowardly perturbed due to its suspected off-target actions (10). An adequate analysis of genome-wide expression data to comprehensively capture all the key actions at the molecular level is, however, challenging because of the complex multiple layers of genetic regulatory mechanisms and feedback loops which are mediated over time. To address this issue, one widely used tactic is gene clustering which groups genes into individual functional categories (11) in order to facilitate proper interpretation of gene expression results. Gene clustering can be used in conjunction with curated knowledge bases of pathways in aiding the interpretation of gene expression results (12). Though several pathway databases are publicly accessible (13,14), there exists known inconsistencies in the annotation/curation and vocabulary standards, as well as in pathway details (15). For example, inconsistency in the signaling pathways and networks can arise between primary and immortalized cells even though they are both derived from the human liver (16). Another challenge in the assessment and prediction of target engagement is when only one cell line is used, perhaps because of cost issues. That interpretation of one cell line could lead to an incorrect conclusion. Furthermore, the environmental milieu surrounding the cell may cause different cellular responses at both gene and protein levels (16). Most importantly, a few cell lines derived from some individuals will never adequately represent the broad genetic diversity and variability of the whole human population. The results of a gene expression study are often extrapolated beyond the scope of its study design. Thus, correct illustration of target engagement or off-target effect is hinged on our understanding of the context of a pathway in a specific cell line and on incorporation of both translational and biochemical phenotypic characteristics for the interpretation of transcriptional results.
Beyond the cell lines described above, comparisons between healthy and diseased tissues could potentially identify druggable targets (17). The pattern in the gene expression of a diseased tissue is expected to be the complete opposite after being treated with an effective drug. For example, if a signature gene set is upregulated in the diseased condition, then it is expected to be downregulated compared to pretreatment when treated effectively. Based on this differing pattern notion, gene expression profiles of individual FDA-approved drugs in Connectivity Map were compared to 100 diseases from the Gene Expression Omnibus database of NCBI; there was a statistical association between cimetidine with small-cell lung cancer (18) and topiramate (19) with inflammatory bowel disease (IBD). The current approved therapeutic diseases were gastric ulcer for cimetidine and epilepsy for topiramate. With the statistical associations, investigators demonstrated the preclinical efficacy of topiramate in treating IBD in a rat model and cimetidine in treating non-small cell lung carcinoma with a tumor xenograft mouse model. These preclinical findings await further replication prior to entering clinical development; however, these studies demonstrate the utility of integrating disease-associated and drug-caused perturbations at the transcriptional level for drug discovery and repurposing of already approved drugs.
Genetic mutations create diverse characteristics within an ethnic population and among all ethnic groups and form the basis for the variability in the sensitivity of patient responses to a drug treatment. Recent advance in the next-generation sequencing technology has made whole exome sequencing more accessible and affordable for detecting genetic mutations in a more comprehensive way. Genome-wide expression profiling with a limited number of cell lines when used in conjugation with genetic mutation data can better predict and understand the variability of patient response to a drug treatment. Such an approach integrating both genetic and transcriptomic levels of information is important to ensure the success of large phase 3 clinical trials and adequate post-approval efficacy of a drug. Since it is not practical to access the organ tissues from a very large number of human subjects for genome-wide expression profiling, a compendium of close to 1,000 human cell lines with diverse lineage and genetic mutation is shown to be a useful alternative to gather the needed information for computational assessment of the varying effect of a drug candidate (20). This large number of cell lines increased the confidence in the finding that neuroblastoma RAS viral (v-ras) oncogene homolog (NRAS) mutant cell lines were sensitive to MAPK/ERK kinase (MEK) inhibitors (20).
Taken together, next-generation DNA sequencing and genome-wide expression analysis allow detailed dissection and delineation of context-specific cellular responses at the molecular level (21) for discovering new drug targets and for repurposing of an FDA-approved drug to treat the diseases for which it has not been indicated and for focusing on developing those drug candidates that have a greater likelihood to show clinical efficacy at the population level.
Targeting Pathways Common to Multiple Diseases
Several studies have reported analysis of large gene expression data sets focusing either on specific disease areas, such as respiratory diseases (22,23), infectious diseases (24), and cancers (25), or on profiling a specific tissue type, such as peripheral blood mononuclear cells (PBMC) (26) or whole blood (27), across multiple diseases. These studies collectively provide a rich data set for identifying distinct common pathways/gene modules that are shared by pathophysiological processes of multiple diseases. Other approaches integrate both genetics and transcription profiles from crucial tissues to identify the causal genes that are associated with the phenotype of a disease (28,29). These disease phenotype-associated causal genes often reside in the same genetic network. One such network, the macrophage-enriched metabolic network, was found to be highly enriched in the genes that are causal for metabolic syndrome and was identified in both rodent (30) and human (31). These genes identified via disease or tissue specific pathways could be further studied to potentially identify new targets for drug discovery.
Recently, a gene signature composed of ∼2,500 genes was identified in 12 expression profiling data sets derived from 9 different tissues of rodent inflammatory disease models, including ovalbumin-challenged asthma model (lung), IL-1β transgenic emphysema model (lung), TGFβ Tg transgenic pulmonary fibrosis model (lung), high-fat diet-treated ApoE knockout atherosclerosis model (aorta), db/db diabetes model (adipose and islet), ob/ob obesity model (adipose) carrageenan-induced inflammation pain model (skin), Chung neuropathic pain model (dorsal root ganglia), middle cerebral artery occlusion (experimental stroke model, brain), LPS-treated acute injury model (liver), and age-related sarcopenia model (muscle) (32). These genes significantly overlapped with the known drug targets and contained co-expressed genes linked to metabolic disorders, infectious diseases, and cancers. A large proportion of the genes in this “inflammatome” are connected in several tissue-specific Bayesian networks built from multiple independent mouse and human cohorts. Both the “inflammatome” signature and the corresponding consensus Bayesian network were highly enriched in immune response-related genes which have been found causal for adiposity, adipokine, diabetes, aortic lesion, bone, muscle, and cholesterol traits, thereby supporting the causal nature of the “inflammatome” signature. A further integrated analysis with multiple Bayesian networks highlighted 151 key regulators potentially and biologically relevant to several disease phenotypes (32). Hematopoietic cell kinase (Hck), one of the key regulators identified, for example, has been shown to be associated with chronic obstructive pulmonary disease (33) and with a poor outcome of chronic myeloid leukemia (34). Tyrobp/Dap12 contains an immunoreceptor tyrosine-based activation motif which is a key regulator implicated in presenile dementia with bone cysts and in a cognitive disorder Nasu–Hakola disease (35,36). There are common molecular characteristics and pathways shared by these various diseases, indicating that there are potential targets for developing individual drugs possibly useful for treating more than one disease (37).
Avoiding Toxicological Pathways
Gene expression profiling, due to its capacity to detect comprehensive transcriptomic alterations in the target cells or tissues, has been used to de-risk therapeutic agents under development in all major drug categories including small molecules, biologics, and small interfering RNA (siRNA) as exemplified in the succeeding paragraphs.
An analysis of liver transcriptomes led to the identification of several key cellular pathways affected by ritonavir, an HIV protease inhibitor (PI) (38). The results were then compared to a gene expression compendium from 52 unrelated compounds and to other PIs, including atazanavir and 2 experimental HIV PIs. As a result, the key biological pathways associated with the ritonavir signature genes were cholesterol and fatty acid biosynthesis. Ritonavir reportedly upregulated the ubiquitin proteasome system (UPS) as well, which contains multiple proteasomal subunit transcripts and genes involved in ubiquitination (39). As a result, the established association between proteasomal induction and lipid elevations from the analysis was applied to screen for the novel PIs that do not induce the UPS (40), in hopes of avoiding the unwanted lipid elevations associated with those earlier approved PIs.
IL-13 shows direct actions on lung epithelial and smooth muscle cells (41) and is implicated in airway hyperreactivity; thus, the IL-13 pathways provide an attractive target for drug development for asthma treatments. Two types of signaling IL-4/IL-13 receptors have been characterized. IL-4Rα chain and the common γ (γC) chain constitute the type I receptor, which is utilized solely by IL-4 and is expressed primarily in the lymphoid cells, while IL-4Rα and IL-13Rα1 form the type II receptor, which is shared by both IL-4 and IL-13 and is ubiquitously expressed (42). The blocking of IL-13Rα1 provides an advantage in the initial differentiation of CD4 T cells into Th2 cells, and subsequently, the IL-4 signaling through the type I receptor will be not be impacted. Under this notion, three humanized anti-IL13Rα1 mAbs with affinity maturation were developed and gene expression profiling was conducted in a primary normal human dermal fibroblast (NHDF) cell line. IL-13 generated a robust and consistent signature in the NHDF line and all three humanized anti-IL13Rα1 mAbs significantly inhibited the signature. An IL-13 activity index ranked the relative potency of the overall inhibitory effect of each mAb. By establishing a specific cutoff in the number of signature genes generated by each antibody alone in the absence of IL-13 (i.e., off-target effect), the same rank order as the activity index was observed, thus suggesting that the top ranked mAb would provide a most favorable safety profile since it induced the least number of potentially off-target genes.
RNA interference (RNAi) is a gene regulatory pathway which can be employed to effectively knock down any target gene and is currently being developed into potential novel therapies (43). One of the most common issues with RNAi therapeutics is the off-target effects which could lead to adverse events (AEs) in the clinic (44). Many strategies have been adopted to improve RNAi specificity in order to reduce off-target gene expression and to reduce immune stimulation. For example, 2′-O-methyl ribosyl substitution at position 2 in the guide siRNA strand and structurally asymmetric siRNA design could be adopted to achieve improved siRNA specificity; in addition, Fucini et al. showed that 2′-fluoro modification of adenosine significantly reduced cytokine induction by siRNA in human PBMC (45–47). Gene expression technologies have been the most widely used technology to monitor RNAi-induced off-target effects. Jackson et al. was the first group to apply genome-wide expression profiling to assess the specificity of siRNA knockdown in cultured human cells and discovered that off-target silencing could occur in genes containing as few as 11 identical contiguous nucleotides to the siRNA (48,49).
TRANSITION TO EARLY CLINICAL DEVELOPMENT
Gene expression profiling can provide a scientific bridge between cellular transcriptomic characteristics and clinical phenotypes following treatment with a drug. For example, increased expression of a suspected immunosuppressive gene signature, regulated by the nuclear factor of activated T cells in transplant patients receiving cyclosporine, associated with recurrent infection and development of skin cancer (50,51). Surrogate tissues, such as blood, skin, or hair follicles, are used to understand the on-target and off-target effects in more inaccessible organs (52–54), such as the kidney or liver. In advanced renal cancer treated patients, a set of gene transcripts observed in PBMC was associated with the cumulative exposure to a drug (55). The changes in the expression of Ki-67 (proliferation-related Ki-67 antigen), phospho-S6 (phosphorylated S6 ribosomal protein), cyclin D1, and progesterone receptor signatures in breast cancer tissues were shown to be useful pharmacodynamic biomarkers that associated with fewer events in estrogen receptor-positive patients by combining everolimus with letrozole as compared to everolimus alone (56). These results suggested that the PI3K/Akt/mTOR pathway plays a key role in patients’ response to anti-endocrine therapy (56–58). These examples demonstrate potential applications of using gene transcript signatures to support our molecular level understanding and prediction of clinical responses. At the present time, gene expression profiles, however, cannot quantitatively link, in a precise predictive manner, the cellular response to in vivo patients’ responses for an appropriate choice of dose without translational functional/response studies in animals.
Disease Molecular Signatures
One common practice is to use animal models to predict human responses in the clinic; gene expression profiling is one tool that can be leveraged to associate the changes in animals with the human clinical outcome. The gene expression changes can be tested in either direction. Either the disease biomarker of transcriptomic nature is first modeled in animal models and then tested for consistency in humans or findings in humans can be extrapolated back into the animal models since the preclinical setting typically requires a shorter time frame, costs less, and can help differentiate backup compounds. Transcriptomic analysis can also be used in a longitudinal manner for understanding the progression of a disease or changes in treatment. Gene expression can be useful for understanding diseases; for example, exploratory studies include mRNA expression profiling for diabetic nephropathy using urinary pellets (59), hepatic tissues from subjects with normal liver and with alcoholic hepatitis (60), and cartilage/synovium from osteoarthritic patients and animal models as detailed in the succeeding paragraphs.
Osteoarthritis (OA), a disease associated with reduced synovial joint function and increased pain, afflicts greater than 30 million individuals (61). No consistently effective method exists for preventing OA or halting its progression despite the available clinical treatments. There are several potential biomarkers associated with the clinical progression of OA, including the detection of proteolytic products of cartilage matrix components (62) and gross changes in the structure and content of articular cartilage, subchondral bone, synovial membrane, joint ligaments, and tendons (63). Due to the slow and intermittent progression of this disease, there is a critical need to identify biomarkers that determine the OA disease course and predict its rate of progression. Since human samples are relatively inaccessible, an integrated analysis was performed on the OA-related samples derived from four species (64), including human OA knee cartilage, cartilage from the mouse STR/Ort model, cartilage from the rat anterior cruciate ligament (ACL) transection model, and synovium from the dog ACL model. Approximately 3,000 cartilage signature genes were identified in human OA samples which were in common with at least one preclinical species. Annotation of the upregulated common signature genes pointed to the pathways related to skeletal development, extracellular matrix–receptor interaction, focal adhesion, phosphate transport, and blood vessel development. Additional analyses were performed between human OA cartilage and six mouse inflammatory disease models. By focusing on the human OA-specific genes, a set of potential OA biomarkers, including asporin (ASPN), gremlin 1 (GREM1), and matrilin 3 (MATN3), were identified. The literature confirms the biological relevance of the previously identified human OA-specific gene signature. ASPN has been shown to be highly expressed in tenocyte, synoviocyte, and chondrocyte. An aspartic acid repeat polymorphism in the promoter of the ASPN gene inhibited chondrogenesis induced by TGFβ and increased susceptibility to OA (65). Skeletal overexpression of GREM1 impaired bone formation and caused osteopenia (66). MATN3 is also highly expressed in chondrocytes, and a sequence variant of MATN3 is a risk factor for OA (67). In addition, MATN3 knockout mice caused chondrocyte prematuration to hypertrophy and increased bone mineral density and OA (68). This gene expression signature could be a potential OA biomarker for identifying future drug candidates to treat OA but needs additional research to demonstrate its clinical utility.
Safety
There have been several studies employing gene expression technologies to understand drug-induced adverse reactions (10,69,70). Multiple types of data are often needed to pinpoint the mechanism of action involved in a clinical drug-induced adverse reaction. Both gene expression patterns of myeloma plasma cells and single-nucleotide polymorphisms from each patient were used to compare and contrast the early onset and late-onset neuropathy after the administration of bortezomib or vincristine (69). The genes associated with late-onset differed from early onset peripheral neuropathies after the administration of bortezomib; genes associated with late-stage neuropathy also differed between bortezomib and vincristine treatments. The genes responsible for the absorption, distribution, and metabolism of vincristine seemed to be associated with its treatment-related neuropathy. Despite the compelling results, these gene-expression signatures and genetics cannot explain the drug-induced adverse reactions completely. Carfilzomib is the second in the class of proteasome inhibitors developed; when compared to bortezomib, carfilzomib treatment did not cause neuropathy as frequently or as severely (70). Though HtrA2/Omi was upregulated by both drugs, it was only inhibited by bortezomib. HtrA2/Omi is a member of mitochondrial serine protease involved in mitochondria homeostasis (71). This example illustrates the complexity of gene expression, and perturbation of a gene (upregulated or downregulated) by a drug does not necessarily reflect any direct interaction (positive or negative) between the drug and the gene. The observed differential inhibition by bortezomib indicates that integrating the genomic, transcriptomic, and biochemical information with the safety phenotypic data for comparisons between treatments is important to clearly delineate and precisely pinpoint the true mechanism underlying severe adverse reactions associated with treatment administration.
Vaccination is one of the most effective methods for controlling infectious diseases. Typically, laborious antibody titer measurements and T cell response assays are used to evaluate the efficacy of vaccines. As for vaccine safety, conventional animal toxicity tests which assess development-, reproduction-, and immunogenicity-associated safety issues are evaluated by repeated dosing and animal weight change monitoring; the animal toxicity tests are costly and time-consuming as the vaccine safety tests. Intuitively, a more rapid and precise assessment of vaccine efficacy and safety can provide a market advantage in developing vaccines. Several reports have been published in the past few years using gene expression profiling technology to evaluate vaccine safety. In general, the gene expression results were consistent with the degree of toxic effects observed in more traditional assays, such as the abnormal toxicity test and the leukopenic toxicity test (72–74). More recently, the systems vaccinology approach describes using the genome-wide gene expression underlying the host responses to vaccination (75–78). In these studies, blood signature genes associated with B cell or T cell response were flagged as potential biomarkers to help differentiate vaccine efficacy or immunogenicity.
For assessing vaccine safety or reactogenicity, additional analysis methodologies, such as gene module approach (26) and metagene model (79), were employed to characterize the vaccine-modulated blood signature genes. Signature genes obtained were then annotated by pathway analysis tools (80). The gene module approach (26) was developed to generate gene expression fingerprints which provide a stable framework for the visualization and functional annotation of blood gene expression results. Essentially, that framework was derived from gene expression profiles generated using the Affymetrix GeneChips (>44,000 probe sets) in 241 PBMC patient samples with 8 diseases (systemic juvenile idiopathic arthritis, systemic lupus erythematosus, type I diabetes, metastatic melanoma, Escherichia coli infection, Staphylococcus aureus infection, influenza A infection, and liver transplant recipients). The co-expressed transcripts were segregated into 28 modules by k-means clustering, and each module contained between 22 and 322 transcripts. The genes within the majority of modules were associated with a particular cell type, biological pathway, or process (26). A module scoring algorithm was developed to obtain module fingerprints with easily distinguishable module scores which allowed association with clinical measurements, such as antibody titer (immunogenicity) or adverse reaction (reactogenicity). When the association analysis for a pilot study was performed between the reactogenicity scores derived from 7 marketed or experimental vaccines (Adacel, Menactra, Havrix, Prevnar, RabAvert, and Merck’s V512/influenza and MRKAd5gag/HIV vaccines) and the 28 blood gene modules (26), the modules identified to be significantly associated with the severity of AEs included one module containing multiple interferon-inducible genes and immune-related transcription factors. The interferon regulatory factor-1 (IRF1) results describing a key transcription factor regulating cellular interferon response are consistent with a literature report by Reif et al. (81), in which smallpox vaccine-associated adverse effects in healthy, vaccinia virus-naive adult volunteers were shown to be associated with two single-nucleotide polymorphisms in the IRF1 gene. Such evidence from both levels of gene expression and genetic mutations are mutually supportive for understanding the role of the IRF1 gene in AEs associated with vaccines.
LATE-STAGE DRUG DEVELOPMENT AND BEDSIDE APPLICATION
As described in the many examples described previously, genome-wide expression analysis is useful to depict the biological networks that could be acted upon by a drug candidate; this technology can disclose information beyond the traditional quantitative structure–activity relationship methods. A recent gene array study indicated that anthracyclines and etoposide are both known DNA topoisomerase II inhibitors, but anthracyclines, not etoposide, could also act as global transcription repressors (82). Coadministration of transcriptional repressors was shown to counteract the pharmacological actions of the drugs that increased the expression of the proapoptotic protein. As a result, the investigators proposed that bortezomib should not be coadministered with anthracyclines or other transcriptional repressors. Given that these drugs are being used clinically together, leveraging the biological knowledge gained from the genome-wide association at the bedside would help avoid cancelling efficacy as a result of drug–drug interaction and exposing patients to toxicity.
At the patient level, gene expression results are influenced by each individual’s diverse genetic and disease backgrounds and epigenetic factors; therefore, results are much more difficult to interpret than in vitro or animal results. A real-time “integrative personal omics profile analysis” (iPOP) in an individual over 14 months illustrates the impact of environmental factors on the development of disease over time (83). Close monitoring with multidimensional phenotypic data (proteomic, metabolomic, transcriptomic, and genomic) provided the linkage between the immunological responses to a viral infection with the development of type II diabetes in this individual. This connection allowed steps to be taken to rectify and eliminate the disease. Gene expression data provide snapshots at specific time points; this is a limitation that prevents delineating a complex human disease in the population or depicting the etiology of a disease. However, gene expression profiling does allow one to focus on the differentially expressed genes caused by a disease condition, which are likely the most relevant genes (for example, tumor genetics) to associate with clinical responses (Fig. 1). Statistical associations with relevant clinical endpoints are expected to become stronger as testing in the clinical trial populations increases (84). Gene-expression signature and genetic mutations have been used for evaluating the prognostic outcome of cancer (85–89). Clearly, the utility of gene-expression signatures has been demonstrated for dissecting the complexity and heterogeneity of a cancer, but their utility in chronic diseases is not as well understood and needs more research in clinical studies. The framework of clinical application would entirely depend on the disease of concern, its clinical endpoints, and the context of a clinical application. During the late-stage drug development, understanding of the variability in patient responses (no or partial or complete) to a treatment could be achieved if a combined and integrated analysis of genomics, transcriptomics, and phenomics at the individual and population levels can be conducted.
Fig. 1.
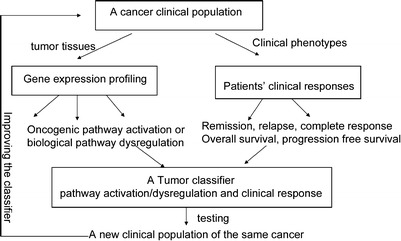
Gene expression profiling does allow one to focus on the differentially expressed genes caused by a disease condition, which are likely the most relevant genes to associate with clinical responses
This comprehensive iPOP combining genomic, transcriptomics, proteomic, metabolomic, and autoantibody profiles as described previously (83) could possibly be more routine in the future with the advancement in next-generation sequencing technology. However, due to the cost and the large amount of data to analyze, the iPOP approach will remain a research tool for quite some time.
FIT-FOR-PURPOSE FRAMEWORK
One of the major pitfalls in the application of gene expression technologies is the difficulty in translating the results from animal models to humans successfully. The first hurdle is the biological curation of the signature genes from the preclinical models. Adequate interpretations of the gene expression results in the context of biology and pharmacology are intimately linked to the accuracy of our prior knowledge of metabolic or apoptotic pathways. How should the genes be reduced into a meaningful set or related to a pharmacological network is the key issue that will ultimately determine the usefulness of the signature genes to facilitate drug development. Even research performed in human cell lines could possibly fail to translate in the early human studies, since the conditions of the cell culture experiment are tightly controlled and the epigenetic impact on the clinical outcome is usually not observed in the cell line models. A limited number of human cell lines will not be able to represent the population-level outcome, and so there is a need to utilize a large number of cell lines in order to extrapolate the in vitro gene-expression signatures and predict clinical efficacy when the drug is taken by patients with diverse demographic characteristics. Another problem often faced by drug discovery scientists is the difficulty in mapping the observed change in cell line or animal gene expression profiles to an equivalent change within an expected degree of variability in the signature genes in human subjects. The inability to observe a statistically meaningful change in the gene-expression signature in the early clinical studies may be a result of incorrectly estimating the appropriate sample size for a future study or the genes proposed from the animal model are not the same genes that are highly statistically significant in the human. This can easily occur since gene expression data are prone to multiplicity issues given that the high number of genes observed far outstrips the number of subjects (∼40,000 genes versus 10 or 12 animal subjects or a similar number of patients in the smaller clinical trials). Therefore, understanding of the molecular characteristics of a disease at the molecular and cellular levels as well as its phenotypic characteristics at the organ level is the prerequisite before embarking on a resource-consuming drug development program. Figure 2 shows a strategic flowchart illustrating the application of gene expression in drug discovery and development. The statistical rigor in qualifying a specific gene-expression signature as a biomarker depends on its fit-for-purpose use (90,91) and will become more stringent the further along a drug development program moves. In fact, when the gene-expression signature is used as an efficacy or safety marker in late-stage drug development, the quantitative rigor needs to meet appropriate assay characterization for any other clinical parameter measured. When the genetic networks associate with the clinical manifestation of a human disease or phenotypes, specific gene-expression signatures can be leveraged as a translational tool for drug development, especially when the biological pathways of a particular target align as well. Take ectonucleotide pyrophosphatase/phosphodiesterase as a target example, its gene-expression signature translates the in vitro results into the proof of concept studies for treating type II diabetes (92).
Fig. 2.
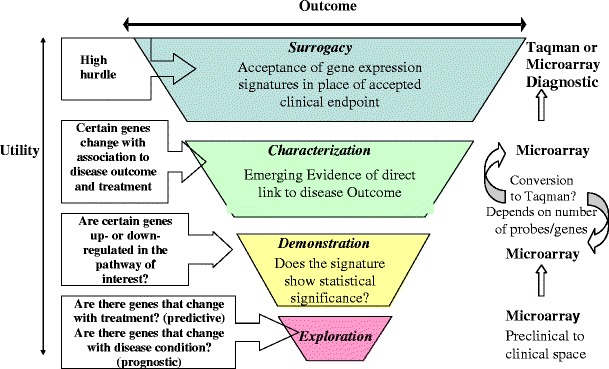
Strategic flowchart illustrating the application of gene expression in drug discovery and development
The pertinence of a gene-expression signature qualified for advancing a drug candidate or for predicting the safety profile of a drug relies on an array of scientific supportive evidence (90,93) and depends on its statistical association with the functional, structural, and phenotypic changes following exposure to a drug, as illustrated in Fig. 3. The gene-expression signature should be integrated with relevant clinical information so that patients can either receive the intended clinical benefit or avoid the adverse effects. There are several public genomic or pathway knowledge bases of high quality that one can reference for designing clinical trials where a gene-expression signature can add value to dose selection and assessment of clinical outcomes (13,94). During the efficacy-defining trials of first-in-man and other early small clinical studies, only limited signals of drug-induced adverse reactions are observed. The link of a gene-expression signature to the treatment-associated adverse reactions tends to be more difficult in the early phases for several reasons: (1) there usually are not enough cases of adverse reactions, (2) study population demographics can vary from study to study (for example, untreated, healthy in the first-in-man study and then disease population with treatment in different studies), (3) the study is not usually conducted long enough to get the link to the adverse reactions of concern, and (4) different doses or formulations of the drug may be utilized in different clinical trials during various phases of its development. To overcome these problems, the drugs that have been withdrawn from the market due to various serious adverse reactions or dropped from the development program, when studied, could be used to depict the toxicological pathways, forming the basis for predicting, for a new chemical entity, its possible extended pharmacological effects and off-target effects (95,96). The large amounts of data generate pose a real challenge to statistically reduce and find the key signal among the data. As the technology advances and drops in cost combined with increasing genetic information rolls in for each human or preclinical subject, the analyses of this data will be a significant hurdle to finding true signal.
Fig. 3.
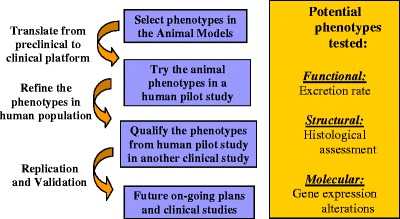
Statistical association of gene-expression signatures with the functional, structural, and phenotypic changes following exposure to a drug
DATA ANALYSIS CHALLENGES
Drug Discovery and Development
Gene array technologies demand the integration of a substantial amount of dynamic data across time with very limited and valuable samples; the ability to perform a robust statistical analysis to answer the study question and to translate a gene-expression signature to a relevant clinical endpoint continues to remain very challenging.
Applications of the gene-expression signatures change as the signature moves from discovery to use in the clinic per the fit-for-purpose framework. In the discovery stage, there is much more flexibility in the statistical analyses and study design. Though clustering is a common method used, it is important to point out that other methods of statistical analyses are also being used and that many of these analyses methods used in this space can lead to overfitting. Understanding the limitations of how vastly different data sets are combined can help drive the statistical methodology chosen. As described previously in many of the examples, separation of conditions (disease versus no disease or treated versus no treatment) aid in the discovery of relevant adverse experiences or subgroup with increased efficacy; the cleaner that divide, the easier it is to pick up “true” signal. In addition, the multiplicity adjustment can be relaxed to allow more false positives in for consideration when merged together with the biological interpretation on the back-end. Though the lack of or limited biological knowledge needs to also be considered in assessing the molecular phenotypes.
As the gene expression signatures are significantly qualified in scope for clinical use, for example, stratification onto treatment, the statistical analyses become much more straightforward and clinical trial statistics can be applied with more rigorous multiplicity adjustments. One real challenge is the development of a companion diagnostic in a timely fashion that would enable bedside use given the fine balance among discovery, replication, and determination of the threshold levels that accompany the assay development.
In summary, there exists no one solution, statistical methodology, or paradigm to move from discovery to clinical use in this space given the high dimensional nature of the data which quickly overwhelms the much smaller sample size. Biological knowledge is also changing and evolving as rapidly as technology. So, as exemplified by many of the examples described above, the ideal path is to (1) focus the study question, (2) cast a wider net at first by integrating many of the technologies with phenotypes and then (3) tighten that net in terms of the set giving the most signal with biological relevance, and (4) replicate findings.
Identifying Clinical Molecular Signatures for Complex Diseases
Building clinically relevant molecular signatures that can be used for the diagnosis, prognosis, and management of complex diseases is the key of personalized medicine. Data analysis is very critical to the development of clinically robust molecular signatures (97). Less stringency is often applied when analyzing molecular profiling technologies for exploratory purposes as compared to use in the clinic for say treatment assignment. Whereas suboptimal data analysis protocols (e.g., biased, underpowered, leading to redundant biomarkers, etc.) exist for exploratory research and hypothesis generation, they are not acceptable for clinical use. Clinical-grade molecular signatures are typically subject to very stringent requirements and even have a separate regulatory path, depending on its use in the trial. Closing the gap between the standards for exploratory versus clinically successful molecular signatures entails a thorough understanding of possible biases in the data analysis phase and the development of strategies to avoid them. Some pitfalls of data analyses for identifying gene expression-based predictive signatures include (1) using unsupervised methods (e.g., clustering) (98); (2) biasing signature accuracy estimation by conducting supervised gene selection both on training and testing data (98); (3) failing to identify predictive signal because of the lack of power in the study or by conducting gene selection for a different phenotype (99); (4) selecting an arbitrary molecular signature without accounting for other equally predictive coexisting molecular signatures (i.e., the phenomenon of “molecular signature multiplicity”) or without testing for statistical redundancy of molecular signatures; and (5) not accounting for the effect of normalization and/or other data preprocessing on selecting molecular signatures, on building of predictive models, and on estimating their accuracy (100). Concerted efforts on establishing agreed-upon guidelines for development as well as validation of molecular signatures (101) and development of more standardization of software are needed to avoid the above biases. The most important gap is the replication of significant associations per description in the fit-for-purpose model.
CONCLUSION
Gene expression profiling and many of the emerging molecular profiling technologies have become an integral part of drug discovery/development and even personalized patient care. As of now, gene expression profiling is being used especially in oncology to attempt to tailor a better treatment regimen based on tumor subtypes. The challenge is in developing a companion diagnostic in a timely fashion to enable use at the bedside given the fine balance among discovery, replication, and determination of the threshold levels that accompany assay development. Opportune applications of gene-expression signatures change as the signature moves from discovery to use in the clinic per the fit-for-purpose framework. Gene array technologies enable the integration of a substantial amount of dynamic data across time; the ability to perform a robust statistical analysis to answer the study question and to translate a gene-expression signature to a relevant clinical endpoint continues to remain very challenging.
Acknowledgment
Alexander Statnikov was supported in part by NIH/NLM grant 1 R01 LM011179-01.
Footnotes
Jane P.F. Bai, I-Ming Wang, and Peggy H. Wong equally contributed to this work.
The views expressed in this article by the FDA employee do not necessarily represent the views of the US Food and Drug Administration.
The views expressed in this article by the Merck employees do not necessarily represent the views of Merck & Co., Inc.
REFERENCES
- 1.Lamb J, Crawford ED, Peck D, Modell JW, Blat IC, Wrobel MJ, et al. The Connectivity Map: using gene-expression signatures to connect small molecules, genes, and disease. Science. 2006;313(5795):1929–35. doi: 10.1126/science.1132939. [DOI] [PubMed] [Google Scholar]
- 2.Mahadevan B, Snyder RD, Waters MD, Benz RD, Kemper RA, Tice RR, et al. Genetic toxicology in the 21st century: reflections and future directions. Environ Mol Mutagen. 2011;52(5):339–54. doi: 10.1002/em.20653. [DOI] [PMC free article] [PubMed] [Google Scholar]
- 3.Liu H, D’Andrade P, Fulmer-Smentek S, Lorenzi P, Kohn KW, Weinstein JN, et al. mRNA and microRNA expression profiles of the NCI-60 integrated with drug activities. Mol Cancer Ther. 2010;9(5):1080–91. doi: 10.1158/1535-7163.MCT-09-0965. [DOI] [PMC free article] [PubMed] [Google Scholar]
- 4.Wagner BK, Kitami T, Gilbert TJ, Peck D, Ramanathan A, Schreiber SL, et al. Large-scale chemical dissection of mitochondrial function. Nat Biotechnol. 2008;26(3):343–51. doi: 10.1038/nbt1387. [DOI] [PMC free article] [PubMed] [Google Scholar]
- 5.Connectivity Map. http://wwwbroadinstituteorg/cmap/. Accessed July 2012.
- 6.Developing Orphan Products: FDA and Rare Disease Day. http://wwwfdagov/ForIndustry/DevelopingProductsforRareDiseasesConditions/ucm239698htm. Accessed July 2012.
- 7.Kao KJ, Chang KM, Hsu HC, Huang AT. Correlation of microarray-based breast cancer molecular subtypes and clinical outcomes: implications for treatment optimization. BMC Cancer. 2011;11:143. doi: 10.1186/1471-2407-11-143. [DOI] [PMC free article] [PubMed] [Google Scholar]
- 8.Mehta R, Jain RK, Badve S. Personalized medicine: the road ahead. Clin Breast Cancer. 2011;11(1):20–6. doi: 10.3816/CBC.2011.n.004. [DOI] [PubMed] [Google Scholar]
- 9.Mizuarai S, Yamanaka K, Itadani H, Arai T, Nishibata T, Hirai H, et al. Discovery of gene expression-based pharmacodynamic biomarker for a p53 context-specific anti-tumor drug Wee1 inhibitor. Mol Cancer. 2009;8:34. doi: 10.1186/1476-4598-8-34. [DOI] [PMC free article] [PubMed] [Google Scholar]
- 10.Liebler DC, Guengerich FP. Elucidating mechanisms of drug-induced toxicity. Nat Rev Drug Discov. 2005;4(5):410–20. doi: 10.1038/nrd1720. [DOI] [PubMed] [Google Scholar]
- 11.D’Haeseleer P. How does gene expression clustering work? Nat Biotechnol. 2005;23(12):1499–501. doi: 10.1038/nbt1205-1499. [DOI] [PubMed] [Google Scholar]
- 12.Yang X, Regan K, Huang Y, Zhang Q, Li J, Seiwert TY, et al. Single sample expression-anchored mechanisms predict survival in head and neck cancer. PLoS Comput Biol. 2012;8(1):e1002350. doi: 10.1371/journal.pcbi.1002350. [DOI] [PMC free article] [PubMed] [Google Scholar]
- 13.KEGG (Kyoto Encyclopedia of Genes and Genomes). http://wwwgenomejp/kegg. Accessed July 2011.
- 14.Reactome. http://wwwreactomeorg/ReactomeGWT/entrypointhtml. Accessed January 2012.
- 15.Kirouac DC, Saez-Rodriguez J, Swantek J, Burke JM, Lauffenburger DA, Sorger PK. Creating and analyzing pathway and protein interaction compendia for modelling signal transduction networks. BMC Syst Biol. 2012;6(1):29. doi: 10.1186/1752-0509-6-29. [DOI] [PMC free article] [PubMed] [Google Scholar]
- 16.Alexopoulos LG, Saez-Rodriguez J, Cosgrove BD, Lauffenburger DA, Sorger PK. Networks inferred from biochemical data reveal profound differences in toll-like receptor and inflammatory signaling between normal and transformed hepatocytes. Mol Cell Proteomics. 2010;9(9):1849–65. doi: 10.1074/mcp.M110.000406. [DOI] [PMC free article] [PubMed] [Google Scholar]
- 17.Madhamshettiwar PB, Maetschke SR, Davis MJ, Reverter A, Ragan MA. Gene regulatory network inference: evaluation and application to ovarian cancer allows the prioritization of drug targets. Genome Med. 2012;4(5):41. doi: 10.1186/gm340. [DOI] [PMC free article] [PubMed] [Google Scholar]
- 18.Sirota M, Dudley JT, Kim J, Chiang AP, Morgan AA, Sweet-Cordero A, et al. Discovery and preclinical validation of drug indications using compendia of public gene expression data. Sci Transl Med. 2011;3(96):96ra77. doi: 10.1126/scitranslmed.3001318. [DOI] [PMC free article] [PubMed] [Google Scholar]
- 19.Dudley JT, Sirota M, Shenoy M, Pai RK, Roedder S, Chiang AP, et al. Computational repositioning of the anticonvulsant topiramate for inflammatory bowel disease. Sci Transl Med. 2011;3(96):96ra76. doi: 10.1126/scitranslmed.3002648. [DOI] [PMC free article] [PubMed] [Google Scholar]
- 20.Barretina J, Caponigro G, Stransky N, Venkatesan K, Margolin AA, Kim S, et al. The Cancer Cell Line Encyclopedia enables predictive modelling of anticancer drug sensitivity. Nature. 2012;483(7391):603–7. doi: 10.1038/nature11003. [DOI] [PMC free article] [PubMed] [Google Scholar]
- 21.Novershtern N, Subramanian A, Lawton LN, Mak RH, Haining WN, McConkey ME, et al. Densely interconnected transcriptional circuits control cell states in human hematopoiesis. Cell. 2011;144(2):296–309. doi: 10.1016/j.cell.2011.01.004. [DOI] [PMC free article] [PubMed] [Google Scholar]
- 22.Campbell JD, Spira A, Lenburg ME. Applying gene expression microarrays to pulmonary disease. Respirology. 2011;16(3):407–18. doi: 10.1111/j.1440-1843.2011.01942.x. [DOI] [PubMed] [Google Scholar]
- 23.Zeskind JE, Lenburg ME, Spira A. Translating the COPD transcriptome: insights into pathogenesis and tools for clinical management. Proc Am Thorac Soc. 2008;5(8):834–41. doi: 10.1513/pats.200807-074TH. [DOI] [PMC free article] [PubMed] [Google Scholar]
- 24.Jenner RG, Young RA. Insights into host responses against pathogens from transcriptional profiling. Nat Rev Microbiol. 2005;3(4):281–94. doi: 10.1038/nrmicro1126. [DOI] [PubMed] [Google Scholar]
- 25.van’t Veer LJ, Bernards R. Enabling personalized cancer medicine through analysis of gene-expression patterns. Nature. 2008;452(7187):564–70. doi: 10.1038/nature06915. [DOI] [PubMed] [Google Scholar]
- 26.Chaussabel D, Quinn C, Shen J, Patel P, Glaser C, Baldwin N, et al. A modular analysis framework for blood genomics studies: application to systemic lupus erythematosus. Immunity. 2008;29(1):150–64. doi: 10.1016/j.immuni.2008.05.012. [DOI] [PMC free article] [PubMed] [Google Scholar]
- 27.Banchereau R, Jordan-Villegas A, Ardura M, Mejias A, Baldwin N, Xu H, et al. Host immune transcriptional profiles reflect the variability in clinical disease manifestations in patients with Staphylococcus aureus infections. PLoS One. 2012;7(4):e34390. doi: 10.1371/journal.pone.0034390. [DOI] [PMC free article] [PubMed] [Google Scholar]
- 28.Puig O, Wang IM, Cheng P, Zhou P, Roy S, Cully D, et al. Transcriptome profiling and network analysis of genetically hypertensive mice identifies potential pharmacological targets of hypertension. Physiol Genomics. 2010;42A(1):24–32. doi: 10.1152/physiolgenomics.00010.2010. [DOI] [PubMed] [Google Scholar]
- 29.Yang Y, Adelstein SJ, Kassis AI. Integrated bioinformatics analysis for cancer target identification. Methods Mol Biol. 2011;719:527–45. doi: 10.1007/978-1-61779-027-0_25. [DOI] [PubMed] [Google Scholar]
- 30.Chen Y, Zhu J, Lum PY, Yang X, Pinto S, MacNeil DJ, et al. Variations in DNA elucidate molecular networks that cause disease. Nature. 2008;452(7186):429–35. doi: 10.1038/nature06757. [DOI] [PMC free article] [PubMed] [Google Scholar]
- 31.Emilsson V, Thorleifsson G, Zhang B, Leonardson AS, Zink F, Zhu J, et al. Genetics of gene expression and its effect on disease. Nature. 2008;452(7186):423–8. doi: 10.1038/nature06758. [DOI] [PubMed] [Google Scholar]
- 32.Wang IM, Zhang B, Yang X, Zhu J, Stepaniants S, Zhang C, et al. Systems analysis of eleven rodent disease models reveals an inflammatome signature and key drivers. Mol Syst Biol. 2012;8:594. doi: 10.1038/msb.2012.24. [DOI] [PMC free article] [PubMed] [Google Scholar]
- 33.Yanagisawa S, Sugiura H, Yokoyama T, Yamagata T, Ichikawa T, Akamatsu K, et al. The possible role of hematopoietic cell kinase in the pathophysiology of COPD. Chest. 2009;135(1):94–101. doi: 10.1378/chest.07-3020. [DOI] [PubMed] [Google Scholar]
- 34.Lee F, Fandi A, Voi M. Overcoming kinase resistance in chronic myeloid leukemia. Int J Biochem Cell Biol. 2008;40(3):334–43. doi: 10.1016/j.biocel.2007.10.001. [DOI] [PubMed] [Google Scholar]
- 35.Paloneva J, Kestila M, Wu J, Salminen A, Bohling T, Ruotsalainen V, et al. Loss-of-function mutations in TYROBP (DAP12) result in a presenile dementia with bone cysts. Nat Genet. 2000;25(3):357–61. doi: 10.1038/77153. [DOI] [PubMed] [Google Scholar]
- 36.Thrash JC, Torbett BE, Carson MJ. Developmental regulation of TREM2 and DAP12 expression in the murine CNS: implications for Nasu–Hakola disease. Neurochem Res. 2009;34(1):38–45. doi: 10.1007/s11064-008-9657-1. [DOI] [PMC free article] [PubMed] [Google Scholar]
- 37.O’Neill LA. Targeting signal transduction as a strategy to treat inflammatory diseases. Nat Rev Drug Discov. 2006;5(7):549–63. doi: 10.1038/nrd2070. [DOI] [PubMed] [Google Scholar]
- 38.Lum PY, He YD, Slatter JG, Waring JF, Zelinsky N, Cavet G, et al. Gene expression profiling of rat liver reveals a mechanistic basis for ritonavir-induced hyperlipidemia. Genomics. 2007;90(4):464–73. doi: 10.1016/j.ygeno.2007.06.004. [DOI] [PubMed] [Google Scholar]
- 39.Bhat KP, Greer SF. Proteolytic and non-proteolytic roles of ubiquitin and the ubiquitin proteasome system in transcriptional regulation. Biochim Biophys Acta. 2011;1809(2):150–5. doi: 10.1016/j.bbagrm.2010.11.006. [DOI] [PubMed] [Google Scholar]
- 40.Waring JF, Ciurlionis R, Marsh K, Klein LL, Degoey DA, Randolph JT, et al. Identification of proteasome gene regulation in a rat model for HIV protease inhibitor-induced hyperlipidemia. Arch Toxicol. 2010;84(4):263–70. doi: 10.1007/s00204-010-0527-7. [DOI] [PubMed] [Google Scholar]
- 41.Kuperman DA, Huang X, Koth LL, Chang GH, Dolganov GM, Zhu Z, et al. Direct effects of interleukin-13 on epithelial cells cause airway hyperreactivity and mucus overproduction in asthma. Nat Med. 2002;8(8):885–9. doi: 10.1038/nm734. [DOI] [PubMed] [Google Scholar]
- 42.Hershey GK. IL-13 receptors and signaling pathways: an evolving web. J Allergy Clin Immunol. 2003;111(4):677–90. doi: 10.1067/mai.2003.1333. [DOI] [PubMed] [Google Scholar]
- 43.Kole R, Krainer AR, Altman S. RNA therapeutics: beyond RNA interference and antisense oligonucleotides. Nat Rev Drug Discov. 2012;11(2):125–40. doi: 10.1038/nrd3625. [DOI] [PMC free article] [PubMed] [Google Scholar]
- 44.Fedorov Y, Anderson EM, Birmingham A, Reynolds A, Karpilow J, Robinson K, et al. Off-target effects by siRNA can induce toxic phenotype. RNA. 2006;12(7):1188–96. doi: 10.1261/rna.28106. [DOI] [PMC free article] [PubMed] [Google Scholar]
- 45.Fucini RV, Haringsma HJ, Deng P, Flanagan WM, Willingham AT. Adenosine modification may be preferred for reducing siRNA immune stimulation. Nucleic Acid Ther. 2012;22(3):205–10. doi: 10.1089/nat.2011.0334. [DOI] [PMC free article] [PubMed] [Google Scholar]
- 46.Yuan Z, Wu X, Liu C, Xu G, Wu Z. Asymmetric siRNA: new strategy to improve specificity and reduce off-target gene expression. Hum Gene Ther. 2012;23(5):521–32. doi: 10.1089/hum.2011.145. [DOI] [PMC free article] [PubMed] [Google Scholar]
- 47.Jackson AL, Burchard J, Leake D, Reynolds A, Schelter J, Guo J, et al. Position-specific chemical modification of siRNAs reduces “off-target” transcript silencing. RNA. 2006;12(7):1197–205. doi: 10.1261/rna.30706. [DOI] [PMC free article] [PubMed] [Google Scholar]
- 48.Jackson AL, Bartz SR, Schelter J, Kobayashi SV, Burchard J, Mao M, et al. Expression profiling reveals off-target gene regulation by RNAi. Nat Biotechnol. 2003;21(6):635–7. doi: 10.1038/nbt831. [DOI] [PubMed] [Google Scholar]
- 49.Anderson E, Boese Q, Khvorova A, Karpilow J. Identifying siRNA-induced off-targets by microarray analysis. Methods Mol Biol. 2008;442:45–63. doi: 10.1007/978-1-59745-191-8_4. [DOI] [PubMed] [Google Scholar]
- 50.Sommerer C, Hartschuh W, Enk A, Meuer S, Zeier M, Giese T. Pharmacodynamic immune monitoring of NFAT-regulated genes predicts skin cancer in elderly long-term renal transplant recipients. Clin Transplant. 2008;22(5):549–54. doi: 10.1111/j.1399-0012.2008.00819.x. [DOI] [PubMed] [Google Scholar]
- 51.Billing H, Breil T, Schmidt J, Tonshoff B, Schmitt C, Giese T, et al. Pharmacodynamic monitoring by residual NFAT-regulated gene expression in stable pediatric liver transplant recipients. Pediatr Transplant. 2012;16(2):187–94. doi: 10.1111/j.1399-3046.2012.01660.x. [DOI] [PubMed] [Google Scholar]
- 52.Locatelli G, Bosotti R, Ciomei M, Brasca MG, Calogero R, Mercurio C, et al. Transcriptional analysis of an E2F gene signature as a biomarker of activity of the cyclin-dependent kinase inhibitor PHA-793887 in tumor and skin biopsies from a phase I clinical study. Mol Cancer Ther. 2010;9(5):1265–73. doi: 10.1158/1535-7163.MCT-09-1163. [DOI] [PubMed] [Google Scholar]
- 53.Rockett JC, Burczynski ME, Fornace AJ, Herrmann PC, Krawetz SA, Dix DJ. Surrogate tissue analysis: monitoring toxicant exposure and health status of inaccessible tissues through the analysis of accessible tissues and cells. Toxicol Appl Pharmacol. 2004;194(2):189–99. doi: 10.1016/j.taap.2003.09.005. [DOI] [PubMed] [Google Scholar]
- 54.Berkofsky-Fessler W, Nguyen TQ, Delmar P, Molnos J, Kanwal C, DePinto W, et al. Preclinical biomarkers for a cyclin-dependent kinase inhibitor translate to candidate pharmacodynamic biomarkers in phase I patients. Mol Cancer Ther. 2009;8(9):2517–25. doi: 10.1158/1535-7163.MCT-09-0083. [DOI] [PubMed] [Google Scholar]
- 55.Boni JP, Leister C, Bender G, Fitzpatrick V, Twine N, Stover J, et al. Population pharmacokinetics of CCI-779: correlations to safety and pharmacogenomic responses in patients with advanced renal cancer. Clin Pharmacol Ther. 2005;77(1):76–89. doi: 10.1016/j.clpt.2004.08.025. [DOI] [PubMed] [Google Scholar]
- 56.Baselga J, Semiglazov V, van Dam P, Manikhas A, Bellet M, Mayordomo J, et al. Phase II randomized study of neoadjuvant everolimus plus letrozole compared with placebo plus letrozole in patients with estrogen receptor-positive breast cancer. J Clin Oncol. 2009;27(16):2630–7. doi: 10.1200/JCO.2008.18.8391. [DOI] [PubMed] [Google Scholar]
- 57.deGraffenried LA, Friedrichs WE, Russell DH, Donzis EJ, Middleton AK, Silva JM, et al. Inhibition of mTOR activity restores tamoxifen response in breast cancer cells with aberrant Akt activity. Clin Cancer Res. 2004;10(23):8059–67. doi: 10.1158/1078-0432.CCR-04-0035. [DOI] [PubMed] [Google Scholar]
- 58.Beeram M, Tan QT, Tekmal RR, Russell D, Middleton A, DeGraffenried LA. Akt-induced endocrine therapy resistance is reversed by inhibition of mTOR signaling. Ann Oncol. 2007;18(8):1323–8. doi: 10.1093/annonc/mdm170. [DOI] [PubMed] [Google Scholar]
- 59.Zheng M, Lv LL, Cao YH, Liu H, Ni J, Dai HY, et al. A pilot trial assessing urinary gene expression profiling with an mRNA array for diabetic nephropathy. PLoS One. 2012;7(5):e34824. doi: 10.1371/journal.pone.0034824. [DOI] [PMC free article] [PubMed] [Google Scholar]
- 60.Affo S, Dominguez M, Lozano JJ, Sancho-Bru P, Rodrigo-Torres D, Morales-Ibanez O, et al. Transcriptome analysis identifies TNF superfamily receptors as potential therapeutic targets in alcoholic hepatitis. Gut. 2012. doi:10.1136/gutjnl-2011-301146. [DOI] [PMC free article] [PubMed]
- 61.Bijlsma JW, Berenbaum F, Lafeber FP. Osteoarthritis: an update with relevance for clinical practice. Lancet. 2011;377(9783):2115–26. doi: 10.1016/S0140-6736(11)60243-2. [DOI] [PubMed] [Google Scholar]
- 62.Kraus VB. Osteoarthritis year 2010 in review: biochemical markers. Osteoarthr Cartil. 2011;19(4):346–53. doi: 10.1016/j.joca.2011.02.002. [DOI] [PMC free article] [PubMed] [Google Scholar]
- 63.Bobinac D, Spanjol J, Zoricic S, Maric I. Changes in articular cartilage and subchondral bone histomorphometry in osteoarthritic knee joints in humans. Bone. 2003;32(3):284–90. doi: 10.1016/S8756-3282(02)00982-1. [DOI] [PubMed] [Google Scholar]
- 64.Watters JW, Cheng C, Pickarski M, Wesolowski GA, Zhuo Y, Hayami T, et al. Inverse relationship between matrix remodeling and lipid metabolism during osteoarthritis progression in the STR/Ort mouse. Arthritis Rheum. 2007;56(9):2999–3009. doi: 10.1002/art.22836. [DOI] [PubMed] [Google Scholar]
- 65.Kizawa H, Kou I, Iida A, Sudo A, Miyamoto Y, Fukuda A, et al. An aspartic acid repeat polymorphism in asporin inhibits chondrogenesis and increases susceptibility to osteoarthritis. Nat Genet. 2005;37(2):138–44. doi: 10.1038/ng1496. [DOI] [PubMed] [Google Scholar]
- 66.Gazzerro E, Pereira RC, Jorgetti V, Olson S, Economides AN, Canalis E. Skeletal overexpression of gremlin impairs bone formation and causes osteopenia. Endocrinology. 2005;146(2):655–65. doi: 10.1210/en.2004-0766. [DOI] [PubMed] [Google Scholar]
- 67.Pullig O, Tagariello A, Schweizer A, Swoboda B, Schaller P, Winterpacht A. MATN3 (matrilin-3) sequence variation (pT303M) is a risk factor for osteoarthritis of the CMC1 joint of the hand, but not for knee osteoarthritis. Ann Rheum Dis. 2007;66(2):279–80. doi: 10.1136/ard.2006.058263. [DOI] [PMC free article] [PubMed] [Google Scholar]
- 68.van der Weyden L, Wei L, Luo J, Yang X, Birk DE, Adams DJ, et al. Functional knockout of the matrilin-3 gene causes premature chondrocyte maturation to hypertrophy and increases bone mineral density and osteoarthritis. Am J Pathol. 2006;169(2):515–27. doi: 10.2353/ajpath.2006.050981. [DOI] [PMC free article] [PubMed] [Google Scholar]
- 69.Broyl A, Corthals SL, Jongen JL, van der Holt B, Kuiper R, de Knegt Y, et al. Mechanisms of peripheral neuropathy associated with bortezomib and vincristine in patients with newly diagnosed multiple myeloma: a prospective analysis of data from the HOVON-65/GMMG-HD4 trial. Lancet Oncol. 2010;11(11):1057–65. doi: 10.1016/S1470-2045(10)70206-0. [DOI] [PubMed] [Google Scholar]
- 70.Arastu-Kapur S, Anderl JL, Kraus M, Parlati F, Shenk KD, Lee SJ, et al. Nonproteasomal targets of the proteasome inhibitors bortezomib and carfilzomib: a link to clinical adverse events. Clin Cancer Res. 2011;17(9):2734–43. doi: 10.1158/1078-0432.CCR-10-1950. [DOI] [PubMed] [Google Scholar]
- 71.Vande Walle L, Lamkanfi M, Vandenabeele P. The mitochondrial serine protease HtrA2/Omi: an overview. Cell Death Differ. 2008;15(3):453–60. doi: 10.1038/sj.cdd.4402291. [DOI] [PubMed] [Google Scholar]
- 72.Momose H, Mizukami T, Ochiai M, Hamaguchi I, Yamaguchi K. A new method for the evaluation of vaccine safety based on comprehensive gene expression analysis. J Biomed Biotechnol. 2010;2010:361841. doi: 10.1155/2010/361841. [DOI] [PMC free article] [PubMed] [Google Scholar]
- 73.Hamaguchi I, Imai J, Momose H, Kawamura M, Mizukami T, Naito S, et al. Application of quantitative gene expression analysis for pertussis vaccine safety control. Vaccine. 2008;26(36):4686–96. doi: 10.1016/j.vaccine.2008.06.086. [DOI] [PubMed] [Google Scholar]
- 74.Mizukami T, Imai J, Hamaguchi I, Kawamura M, Momose H, Naito S, et al. Application of DNA microarray technology to influenza A/Vietnam/1194/2004 (H5N1) vaccine safety evaluation. Vaccine. 2008;26(18):2270–83. doi: 10.1016/j.vaccine.2008.02.031. [DOI] [PubMed] [Google Scholar]
- 75.Gaucher D, Therrien R, Kettaf N, Angermann BR, Boucher G, Filali-Mouhim A, et al. Yellow fever vaccine induces integrated multilineage and polyfunctional immune responses. J Exp Med. 2008;205(13):3119–31. doi: 10.1084/jem.20082292. [DOI] [PMC free article] [PubMed] [Google Scholar]
- 76.Querec TD, Akondy RS, Lee EK, Cao W, Nakaya HI, Teuwen D, et al. Systems biology approach predicts immunogenicity of the yellow fever vaccine in humans. Nat Immunol. 2009;10(1):116–25. doi: 10.1038/ni.1688. [DOI] [PMC free article] [PubMed] [Google Scholar]
- 77.Palermo RE, Patterson LJ, Aicher LD, Korth MJ, Robert-Guroff M, Katze MG. Genomic analysis reveals pre- and postchallenge differences in a rhesus macaque AIDS vaccine trial: insights into mechanisms of vaccine efficacy. J Virol. 2011;85(2):1099–116. doi: 10.1128/JVI.01522-10. [DOI] [PMC free article] [PubMed] [Google Scholar]
- 78.Balas C, Kennel A, Deauvieau F, Sodoyer R, Arnaud-Barbe N, Lang J, et al. Different innate signatures induced in human monocyte-derived dendritic cells by wild-type dengue 3 virus, attenuated but reactogenic dengue 3 vaccine virus, or attenuated nonreactogenic dengue 1–4 vaccine virus strains. J Infect Dis. 2011;203(1):103–8. doi: 10.1093/infdis/jiq022. [DOI] [PMC free article] [PubMed] [Google Scholar]
- 79.Huang E, Ishida S, Pittman J, Dressman H, Bild A, Kloos M, et al. Gene expression phenotypic models that predict the activity of oncogenic pathways. Nat Genet. 2003;34(2):226–30. doi: 10.1038/ng1167. [DOI] [PubMed] [Google Scholar]
- 80.Ganter B, Giroux CN. Emerging applications of network and pathway analysis in drug discovery and development. Curr Opin Drug Discov Devel. 2008;11(1):86–94. [PubMed] [Google Scholar]
- 81.Reif DM, McKinney BA, Motsinger AA, Chanock SJ, Edwards KM, Rock MT, et al. Genetic basis for adverse events after smallpox vaccination. J Infect Dis. 2008;198(1):16–22. doi: 10.1086/588670. [DOI] [PMC free article] [PubMed] [Google Scholar]
- 82.Wei G, Margolin AA, Haery L, Brown E, Cucolo L, Julian B, et al. Chemical genomics identifies small-molecule MCL1 repressors and BCL-xL as a predictor of MCL1 dependency. Cancer Cell. 2012;21(4):547–62. doi: 10.1016/j.ccr.2012.02.028. [DOI] [PMC free article] [PubMed] [Google Scholar]
- 83.Chen R, Mias GI, Li-Pook-Than J, Jiang L, Lam HY, Miriami E, et al. Personal omics profiling reveals dynamic molecular and medical phenotypes. Cell. 2012;148(6):1293–307. doi: 10.1016/j.cell.2012.02.009. [DOI] [PMC free article] [PubMed] [Google Scholar]
- 84.Field LA, Love B, Deyarmin B, Hooke JA, Shriver CD, Ellsworth RE. Identification of differentially expressed genes in breast tumors from African American compared with Caucasian women. Cancer. 2012;118(5):1334–44. doi: 10.1002/cncr.26405. [DOI] [PubMed] [Google Scholar]
- 85.Becker H, Marcucci G, Maharry K, Radmacher MD, Mrozek K, Margeson D, et al. Favorable prognostic impact of NPM1 mutations in older patients with cytogenetically normal de novo acute myeloid leukemia and associated gene- and microRNA-expression signatures: a Cancer and Leukemia Group B study. J Clin Oncol. 2010;28(4):596–604. doi: 10.1200/JCO.2009.25.1496. [DOI] [PMC free article] [PubMed] [Google Scholar]
- 86.Iwamoto T, Bianchini G, Booser D, Qi Y, Coutant C, Shiang CY, et al. Gene pathways associated with prognosis and chemotherapy sensitivity in molecular subtypes of breast cancer. J Natl Cancer Inst. 2011;103(3):264–72. doi: 10.1093/jnci/djq524. [DOI] [PubMed] [Google Scholar]
- 87.Gatza ML, Lucas JE, Barry WT, Kim JW, Wang Q, Crawford MD, et al. A pathway-based classification of human breast cancer. Proc Natl Acad Sci U S A. 2010;107(15):6994–9. doi: 10.1073/pnas.0912708107. [DOI] [PMC free article] [PubMed] [Google Scholar]
- 88.Jonsson G, Staaf J, Vallon-Christersson J, Ringner M, Holm K, Hegardt C, et al. Genomic subtypes of breast cancer identified by array-comparative genomic hybridization display distinct molecular and clinical characteristics. Breast Cancer Res. 2010;12(3):R42. doi: 10.1186/bcr2596. [DOI] [PMC free article] [PubMed] [Google Scholar]
- 89.Miller LD, Smeds J, George J, Vega VB, Vergara L, Ploner A, et al. An expression signature for p53 status in human breast cancer predicts mutation status, transcriptional effects, and patient survival. Proc Natl Acad Sci U S A. 2005;102(38):13550–5. doi: 10.1073/pnas.0506230102. [DOI] [PMC free article] [PubMed] [Google Scholar]
- 90.Bai JP, Bell R, Buckman S, Burckart GJ, Eichler HG, Fang KC, et al. Translational biomarkers: from preclinical to clinical a report of 2009 AAPS/ACCP Biomarker Workshop. AAPS J. 2011;13(2):274–83. doi: 10.1208/s12248-011-9265-x. [DOI] [PMC free article] [PubMed] [Google Scholar]
- 91.Wagner JA, Williams SA, Webster CJ. Biomarkers and surrogate end points for fit-for-purpose development and regulatory evaluation of new drugs. Clin Pharmacol Ther. 2007;81(1):104–7. doi: 10.1038/sj.clpt.6100017. [DOI] [PubMed] [Google Scholar]
- 92.Zhou HH, Chin CN, Wu M, Ni W, Quan S, Liu F, et al. Suppression of PC-1/ENPP-1 expression improves insulin sensitivity in vitro and in vivo. Eur J Pharmacol. 2009;616(1–3):346–52. doi: 10.1016/j.ejphar.2009.06.057. [DOI] [PubMed] [Google Scholar]
- 93.Uehara T, Ono A, Maruyama T, Kato I, Yamada H, Ohno Y, et al. The Japanese toxicogenomics project: application of toxicogenomics. Mol Nutr Food Res. 2010;54(2):218–27. doi: 10.1002/mnfr.200900169. [DOI] [PubMed] [Google Scholar]
- 94.PharmGKB. The Pharmacogenomics Knowledgebase. http://www.pharmgkb.org. Accessed July 2011.
- 95.Campillos M, Kuhn M, Gavin AC, Jensen LJ, Bork P. Drug target identification using side-effect similarity. Science. 2008;321(5886):263–6. doi: 10.1126/science.1158140. [DOI] [PubMed] [Google Scholar]
- 96.Toyoshiba H, Sawada H, Naeshiro I, Horinouchi A. Similar compounds searching system by using the gene expression microarray database. Toxicol Lett. 2009;186(1):52–7. doi: 10.1016/j.toxlet.2008.08.009. [DOI] [PubMed] [Google Scholar]
- 97.Lytkin NI, McVoy L, Weitkamp JH, Aliferis CF, Statnikov A. Expanding the understanding of biases in development of clinical-grade molecular signatures: a case study in acute respiratory viral infections. PLoS One. 2011;6(6):e20662. doi: 10.1371/journal.pone.0020662. [DOI] [PMC free article] [PubMed] [Google Scholar]
- 98.Simon R, Radmacher MD, Dobbin K, McShane LM. Pitfalls in the use of DNA microarray data for diagnostic and prognostic classification. J Natl Cancer Inst. 2003;95(1):14–8. doi: 10.1093/jnci/95.1.14. [DOI] [PubMed] [Google Scholar]
- 99.Statnikov A, Aliferis CF. Analysis and computational dissection of molecular signature multiplicity. PLoS Comput Biol. 2010;6(5):e1000790. doi: 10.1371/journal.pcbi.1000790. [DOI] [PMC free article] [PubMed] [Google Scholar]
- 100.Qiu X, Brooks AI, Klebanov L, Yakovlev N. The effects of normalization on the correlation structure of microarray data. BMC Bioinforma. 2005;6:120. doi: 10.1186/1471-2105-6-120. [DOI] [PMC free article] [PubMed] [Google Scholar]
- 101.Dupuy A, Simon RM. Critical review of published microarray studies for cancer outcome and guidelines on statistical analysis and reporting. J Natl Cancer Inst. 2007;99(2):147–57. doi: 10.1093/jnci/djk018. [DOI] [PubMed] [Google Scholar]