

Abstract
Omalizumab, a recombinant humanized monoclonal antibody, is the first approved anti-immunoglobulin E (IgE) agent for the treatment of subjects with moderate to severe persistent allergic asthma that are inadequately controlled by the standard of care. The objective of this study was to quantitatively characterize relationships between serum free IgE and pulmonary function (as measured by forced expiratory volume in 1 s [FEV1]) as well as serum free IgE and airway inflammation (as measured by fractional exhaled nitric oxide [FeNO]) using population-based efficacy models. Data were collected from patients in the EXTRA trial who received omalizumab or placebo 150 to 375 mg subcutaneously every 2 or 4 weeks from week 0 to 48 with constant standard of care as background therapy. None of the covariates evaluated, including demographics, disease status, and baseline pharmacodynamic biomarkers, were significant in explaining the variability in the FEV1 or FeNO response to omalizumab. Results from the efficacy models further confirmed the current omalizumab dosing rationale based on the mean target free IgE level of 25 ng/ml and quantified the variability for the target. In addition, the resulting population models could be used to predict population FEV1 or FeNO response for omalizumab and/or other anti-IgE therapeutics for which PK-IgE models are constructed.
Electronic supplementary material
The online version of this article (doi:10.1208/s12248-013-9463-9) contains supplementary material, which is available to authorized users.
KEY WORDS: asthma, FEV1, IgE, omalizumab, population modeling
INTRODUCTION
Asthma is a chronic inflammatory disorder of the airways that results in considerable morbidity and mortality (1,2). According to the Global Initiative for Asthma program, over 300 million people are affected worldwide (3). Although multiple factors contribute to the development of allergic asthma, the immunoglobulin E (IgE)-mediated response to common aeroallergens, such as house dust mite, pollen, mold, and animal dander, is a well-established cause of airway inflammation (4–6). The allergic response is triggered by the binding and cross-linking of allergen to IgE bound to its high-affinity receptor (FcεRI) on the surface of basophils and mast cells. The subsequent degranulation of these cells causes the release of histamine, leukotrienes, and other inflammatory mediators that result in the recruitment of inflammatory cells leading to airway inflammation associated with asthma symptoms, such as wheezing, coughing, and breathlessness (7,8). Forced expiratory volume in 1 s (FEV1), a common spirometry measurement used to evaluate pulmonary function, is usually decreased in asthmatics (3).
Omalizumab (Xolair®), a recombinant humanized monoclonal antibody, is an anti-IgE antibody approved for the treatment of subjects with moderate to severe persistent allergic asthma inadequately controlled by their standard of care (high-dose inhaled corticosteroids (ICS) and long-acting beta2-agonists (LABAs)). Omalizumab selectively binds to human IgE at the epitope that is used to bind to FcεRI, thereby blocking the interaction of IgE with FcεRI on the surface of effector cells and preventing the subsequent release of inflammatory mediators (8). The success of omalizumab confirmed the central role of IgE in allergic inflammation (9). Since the 1980s, the role of IgE in the development of asthma has received considerable attention and several studies have demonstrated an inverse association between serum IgE levels and pulmonary function, including FEV1, in patients with asthma (10–15). However, no quantitative modeling analysis has been published thus far to describe the relationship between serum IgE and FEV1.
More recently, fractional exhaled nitric oxide (FeNO) was found to be correlated with airway eosinophilic inflammation measured as induced sputum, bronchoalveolar lavage, and endobronchial biopsy eosinophils and is now considered as a noninvasive biomarker of airway eosinophilic inflammation (16–19). A correlation between serum IgE level and FeNO has also been demonstrated (20). Similar to FEV1, no model has been published relating serum IgE to FeNO response.
This work presented the first population-based models to quantitatively describe the relationships between free IgE and pulmonary function (as measured by FEV1) as well as free IgE and airway inflammation (as measured by FeNO) in response to treatment with omalizumab. The modeling work was based on a prospective, multicenter, randomized, parallel-group, double-blind, controlled trial (EXTRA) of omalizumab for inadequately controlled severe allergic asthmatics who were receiving high-dose ICS and LABAs, with or without additional controller therapy (21). The results from this study were used to evaluate the mean target free IgE level (25 ng/ml) for omalizumab therapy (22).
MATERIALS AND METHODS
Study Design and Patient Population
The study design and patient population for EXTRA have been previously presented in detail (21). In summary, 850 patients (aged 12–75 years) who had inadequately controlled asthma despite treatment with high-dose ICS plus LABAs, with or without other asthma-controller medications, were randomly assigned to receive omalizumab (n = 427) or placebo (n = 423) subcutaneously for 48 weeks. In this study, the dose and dosing frequency (150 to 375 mg every 2 or 4 weeks) of omalizumab were based on both body weight and serum IgE level at screening according to the omalizumab dosing table specified in the US package insert, which was designed to achieve individualized dosing for optimal clinical efficacy (22). Patients’ ICS, LABAs, and other controller medication dosages were not allowed to be modified throughout the trial (except for systemic corticosteroids used to treat asthma exacerbation). More than 90% (795 out of 850) of the study patients had the same dose regimens of ICS (1,000 mcg/day fluticasone equivalent) and LABAs (100 mcg/day salmeterol equivalent). The primary efficacy endpoint was the rate of asthma exacerbations, while FEV1 and FeNO, among others, were evaluated as exploratory endpoints.
This study was conducted according to US Food and Drug Administration regulations, the International Conference on Harmonisation E6 Guidelines for Good Clinical Practice, and other national requirements. All sites obtained institutional review board approval to conduct this study and obtained signed informed consent from study participants before enrollment.
Data Used in Model Development
In the analysis, data from 722 patients (351 in the omalizumab group and 371 in the placebo group) were used for the IgE–FEV1 modeling, while in the IgE–FeNO modeling, data from 348 patients were included (173 in the omalizumab group and 175 in the placebo group) which represent the subset of patients with FeNO measurements. Given the large overall variability in the observed baseline values (week 0) of IgE, FEV1, and FeNO, these baseline values could not be reliably imputed when missing. Therefore, in both analyses, subjects without a baseline total IgE measurement were excluded, as were subjects in the omalizumab group with no posttreatment free IgE samples. Furthermore, in the IgE–FEV1 modeling, subjects without baseline FEV1 measurements were excluded; similarly, in the IgE–FeNO modeling, subjects without baseline FeNO measurements were excluded. In order to control for the confounding effect of oral corticosteroids (OCS) on FEV1 and FeNO, data from subjects (7%) who received long-term OCS treatment during the 48-week treatment period were excluded from the analysis.
Serum IgE Measurements
Blood samples for the measurement of serum free IgE (i.e., IgE not bound to omalizumab) and total IgE (i.e., free IgE and IgE bound to omalizumab) were collected at patients’ visits at study weeks 0, 16, 32, and 48 before the administration of omalizumab or placebo. Free and total IgE from serum samples were measured using enzyme-linked immunosorbent assays described previously (23,24). The quantifiable range of the free IgE assay was 0.78 to 150 ng/ml, while the lower limit of quantification of total IgE was 2.4 ng/ml.
FEV1 Measurements
Spirometry, including FEV1 measurement, was conducted every 4 weeks from week 0 to 48 for the study subjects and was performed before omalizumab or placebo administration. Spirometry was conducted in accordance with the American Thoracic Society guidelines (25). Subjects were instructed not to use short-acting beta-agonists (i.e., albuterol, levalbuterol) on the day of scheduled spirometry until after spirometry had been performed.
In the IgE–FEV1 modeling, measured FEV1 (in milliliters) was expressed as a percentage of the subject’s predicted FEV1 (in milliliters) (FEV1 percent predicted = FEV1/predicted FEV1 × 100%) as is conventionally done in FEV1 data analysis (26). FEV1 percent predicted at baseline (baseline FEV1/predicted FEV1 × 100%) was also used to assess disease status and was one of the inclusion criteria in many asthma studies including EXTRA (21,26,27). Thus, in the analysis, we used the same response measure (FEV1 percent predicted) as used in the trial inclusion criteria. The predicted FEV1 (PFEV1) values in the EXTRA trial were calculated using a method by Crapo et al. (28) for subjects 18 years old or above and Polgar et al. (29) for subjects under 18 years of age:
- Adults ≥ 18 years:
- Male: PFEV1 (ml) = 41.4 × Height (cm) − 24.4 × Age (years) − 2,190
- Female: PFEV1 (ml) = 34.2 × Height (cm) − 25.5 × Age (years) − 1,578
- Adolescents 11 to < 18 years:
- PFEV1 (ml) = 0.002098 × [Height (cm)]2.7986
FeNO Measurements
FeNO was measured at study weeks 0, 4, 8, 12, 16, 32, and 48 for a subset of subjects in the study (21). All FeNO samples were taken before omalizumab or placebo administration.
Measurement of FeNO was performed at US sites using a handheld portable device, the NIOX MINO® (Aerocrine, Solna, Sweden). Measurements were taken at approximately the same time of day at each visit for each subject and prior to performing spirometry. To reduce variability, sites were provided with the same NIOX MINO® devices and one to two staff members at each site were trained to perform measurements. Devices were calibrated on a regular basis according to the manufacturer’s instructions, and ambient nitric oxide was recorded to account for variability in different locations. FeNO measurements were taken at least twice for each visit, and in the case of discrepant values, the mean value was recorded.
Efficacy Model Development
Model Input
In the efficacy modeling, measured serum IgE concentrations were used as inputs to the models describing the dynamics of FEV1 (percent predicted) and FeNO. For the omalizumab group, total IgE measurements at baseline and free IgE measurements posttreatment were used, whereas for the placebo group, total IgE measurements at both baseline and posttreatment were used. In the placebo group, since the change of IgE values over time was not due to drug effect, each subject’s average IgE level over the time course of the trial was used as the model input as a better estimate of that subject’s IgE value. In the omalizumab group, the free IgE time course data were constructed by linearly interpolating the free IgE measurements at the available sampling times. Posttreatment free IgE measurements were obtained no earlier than 16 weeks into the trial; however, omalizumab is expected to rapidly and extensively suppress free IgE within 1 day following the given subcutaneous doses, based on data from previous omalizumab clinical trials (14,24). Therefore, the missing IgE time course following the first dose and prior to the first posttreatment IgE sample was constructed by adding an early posttreatment time (0.1 week) and imputing the free IgE value by back-extrapolating the first posttreatment measured free IgE value for each subject (Fig. 1a). It is also noted that there was a wide variation in IgE values across individuals. The individual mean IgE over time in the placebo group ranged from 14 to 2,067 ng/ml, and the individual mean posttreatment free IgE over time in the omalizumab group ranged from 2.3 to 94 ng/ml.
Fig. 1.
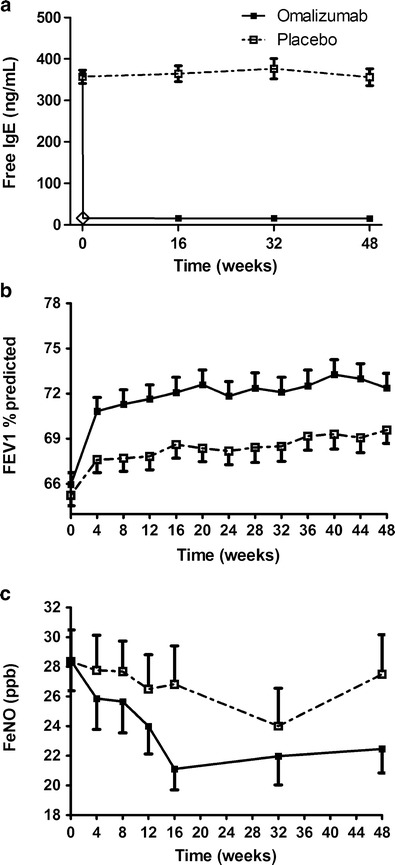
Mean observed free IgE (a), FEV1 percent predicted (b), and FeNO (c) responses in the omalizumab and placebo groups. Error bars represent the standard errors of the mean. The open diamond in a represents the back-extrapolated free IgE data at week 0.1 (details in the “Materials and Methods” section)
IgE–FEV1 Base Model
In this study, an increase in mean FEV1 (percent predicted) over time in the placebo group was observed, which is commonly seen in asthma studies (30). This apparent placebo response needed to be accounted for in the population model. In addition, the time course of the FEV1 (percent predicted) placebo response in each individual was variable, with subjects showing either an increase, decrease, or no change in FEV1 (percent predicted) over time (Fig. 2, lower panels). Similar to the placebo group, the individual time course of FEV1 (percent predicted) in the omalizumab group also varied (Fig. 2, upper panels). However, the mean FEV1 (percent predicted) response in the omalizumab group was higher than that in the placebo group (Fig. 1b). Exploratory analysis of the raw data showed an inverse relationship between free IgE and FEV1 (percent predicted), with the free IgE (in nanograms per milliliter; mean ± SE) increasing from 5 ± 0.2 to 10 ± 0.2, to 25 ± 0.9, and to 364 ± 17, while the corresponding values of FEV1 (percent predicted) (mean ± SE) at week 48 decreased from 78 ± 3.0 to 73 ± 1.3, to 71 ± 1.5, and to 70 ± 0.9. To model these data and describe the relationship between free IgE and FEV1 (percent predicted) in omalizumab and placebo groups, the following differential equation was used:
 |
1 |
where Kimp and Kdet are rate constants reflecting FEV1 (percent predicted) improvement and deterioration, respectively. It should be emphasized that this model is not an indirect response (IDR) model (31) and this one model is used to describe both the omalizumab and placebo responses. In contrast to a typical IDR model, FEV1 is not assumed to be in equilibrium before and after treatment. Moreover, this single model can describe each individual’s FEV1 response in both the omalizumab and placebo groups that can show an increase, decrease, or no change in FEV1. In addition, the initial condition (FEV1(0)) was estimated for each individual. The inhibitory effect (IE) of IgE on FEV1 (percent predicted) at a particular time was described by a sigmoidal function:
 |
2 |
where Imax is the maximum IgE inhibitory effect, IC50 is the serum free IgE concentration causing 50% of the maximum inhibitory effect, CIgE is the free IgE serum concentration at that time, and the hill coefficient (H1) reflects the steepness of the sigmoidal curve representing the IgE–FEV1 relationship. Depending on the initial condition (FEV1(0)) and the values of Kimp and Kdet, the FEV1 (percent predicted) for subjects in both groups could increase, decrease, or remain unchanged over time. For omalizumab-treated group, the increase in FEV1 (percent predicted) could be greater than in the placebo group due to the reduction in free IgE, leading to a decrease in IE.
Fig. 2.
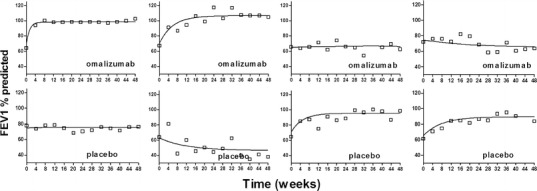
Comparison of observed and individual predicted FEV1 percent predicted responses for typical subjects in omalizumab (upper panels) and placebo (lower panels) groups. Open squares are the observed FEV1 percent predicted. Solid lines are the individual model predictions
In the population analysis, the model in Eq. 1 was reparameterized by introducing the variable maxFEV1 to represent the theoretical maximum steady-state FEV1 (percent predicted) a subject could achieve when free IgE level decreases to 0 and then replacing the parameter Kimp with the multiplication of Kdet and maxFEV1. Exploratory data analysis relating FEV1 (percent predicted) at weeks 48 and 0 in both placebo and omalizumab groups suggested that maxFEV1 and FEV1(0) were positively correlated. Therefore, maxFEV1 was modeled as a linear function of FEV1(0) as follows:
 |
3 |
where slope and inter are the slope and intercept that define this linear relationship, respectively. Other functions, such as proportional and sigmoidal, and model without assuming any relationship between maxFEV1 and FEV1(0) were also considered, but these other models were rejected based on selection criteria. Moreover, modeling the relationship between FEV1(0) and maxFEV1 can benefit future model applications (e.g., simulation of FEV1 responses in a patient population with different FEV1(0)).
IgE–FeNO Base Model
Since FeNO response, compared with FEV1, depends much less on patient’s mood and effort during measurement, no significant change in FeNO was observed in the placebo group (Fig. 1c). An IDR model (31) was used to describe the relationship between free IgE and FeNO:
 |
4 |
 |
5 |
where Kin and Kout are rate constants reflecting FeNO increase and decrease, respectively. The term SE represents the stimulatory effect of IgE on FeNO at a certain time, Emax is the maximum IgE stimulatory effect, and EC50 is the serum free IgE concentration causing 50% of the maximum stimulatory effect. CIgE is the free IgE serum concentration at that time, and the hill coefficient (H2) reflects the steepness of sigmoidal curve representing the IgE–FeNO relationship. This model was also reparameterized by introducing the variable minFeNO to represent the theoretical minimum steady-state FeNO response achievable as free IgE decreases to 0 and then replacing the parameter Kin with the multiplication of Kout and minFeNO. The initial condition (FeNO(0)) can be derived as:
 |
6 |
where CIgE(0) is the baseline IgE serum concentration. Although there was no significant FeNO response in the placebo group, data from both omalizumab and placebo groups were used in the population modeling as the placebo data still contain information about the IgE–FeNO relationship.
Covariate Assessment
Once the base model was determined, the effects of covariates on the interindividual variability of model parameters were evaluated. Numerous covariates were considered, including patient demographics, disease status, and baseline pharmacodynamic (PD) biomarkers (Table I). Potential explanatory covariates were first selected through graphical assessments and then incorporated in the model for evaluation. Continuous covariate candidates were tested in the model with a power function, while categorical covariates were examined with a proportional change model. The significance of each covariate was evaluated using the likelihood ratio test. If one covariate alone caused a decrease in twice the negative log-likelihood of at least 3.84, it was considered a significant covariate. In addition to the likelihood ratio test, other model selection criteria included the model convergence and decrease in interindividual variability of model parameters. For those covariates with missing values, complete case analysis was used by modeling only data from subjects having no missing covariates.
Table I.
Summary of Covariates Evaluated in the Analysis
| Covariates | IgE–FEV1 model | IgE–FeNO model | ||
|---|---|---|---|---|
| N | Statistics | N | Statistics | |
| Age (years) | 722 | 46 (12–75) | 348 | 45 (12–75) |
| Body weight (kg) | 721 | 84.7 (40.5–150) | 348 | 86.3 (41.8–150) |
| Height (cm) | 722 | 164 (127–198) | 348 | 164 (140–198) |
| Sex | 722 | 348 | ||
| Male | 246 | 246 (34%) | 118 | 118 (34%) |
| Female | 476 | 476 (66%) | 230 | 230 (66%) |
| Race | 722 | 348 | ||
| White | 554 (77%) | 264 (75.9%) | ||
| Black | 138 (19%) | 66 (19.0%) | ||
| Asian or Pacific Islander | 16 (2.1%) | 11 (3.2%) | ||
| American Indian or Alaska native | 3 (0.4%) | 1 (0.3%) | ||
| Other | 11 (1.5%) | 6 (1.6%) | ||
| Baseline blood eosinophil count (109 cells/L) | 679 | 0.26 (0.03–2.96) | 324 | 0.26 (0.03–2.96) |
| Baseline FEF 25–75% (ml) | 720 | 1,570 (250–6,070) | 348 | 1,535 (270–5,680) |
| Baseline FVC (ml) | 722 | 2,770 (879–7,100) | 348 | 2,770 (1,020–6,640) |
| Predicted FEV1 (ml) | 722 | 3,012 (1,006–5,094) | 348 | 3,011 (1,563–4,933) |
| Baseline symptom score | 719 | 3.80 (1.0–6.7) | 348 | 3.83 (1.0–6.6) |
| Current smoking status | 722 | 348 | ||
| Smoking | 12 (1.7%) | 8 (2.3%) | ||
| Nonsmoking | 710 (98.3%) | 340 (97.7%) | ||
| Number of exacerbation requiring treatment (past year) | 722 | 348 | ||
| 0 | 16 (2.2%) | 6 (1.7%) | ||
| 1 | 384 (53.2%) | 188 (54.0%) | ||
| 2 | 152 (21.1%) | 74 (21.3%) | ||
| 3 | 94 (13.0%) | 46 (13.2%) | ||
| ≥4 | 76 (10.5%) | 34 (9.8%) | ||
| Asthma reversibility (% improvement from baseline after bronchodilator) | 702 | 7.5 (−48.1–112) | 342 | 7.4 (−17.2–89.0) |
| Duration of asthma (years) | 722 | 21 (0–71) | 348 | 22 (0–71) |
Data are presented as median (ranges) or n (percent)
N number of subjects having the covariate, FEF 25–75% forced expiratory flow during the middle half of the forced vital capacity, FVC forced vital capacity, FEV1 forced expiratory volume in 1 s
Population Analysis
Population estimates were obtained through the application of the expectation maximization (EM) algorithm to the parametric, nonlinear mixed-effects maximum likelihood model, as proposed and developed by Schumitzky (32) and Walker (33) (with essential, enabling computational enhancements and extensions by Bauer and Guzy (34)) and implemented in ADAPT5 (MLEM module) (35). All the model parameters in the IgE–FEV1 model (Kdet, Imax, IC50, H1, inter, slope, and FEV1(0)) and in the IgE–FeNO model (Kout, Emax, EC50, H2, and minFeNO) are assumed to be log-normally distributed via exponential transformation. The full variance–covariance matrix for the model parameters was estimated. A combined proportional/additive error model was used to describe the residual error in the IgE–FEV1 model, while a proportional error model was used to describe the residual error in the IgE–FeNO model.
Model Evaluation
Visual predictive checks (36) of the final models were conducted by Monte Carlo simulation, and 100 population data sets were simulated for each model. The FEV1 (percent predicted) and FeNO profiles over the treatment period were simulated for each patient. The 5th, 50th, and 95th percentiles of the simulated predictions and the 90% inclusion interval for each percentile were calculated and compared with the 5th, 50th, and 95th percentiles of the observations at each time point.
RESULTS
Study Data
The mean observed free IgE data in the placebo group were high during the study, while the posttreatment mean free IgE data were extensively reduced in the omalizumab group (Fig. 1a). The overall mean free IgE level in placebo group was 364 ng/ml with %CV (coefficient of variance = standard deviation / mean × 100%) of 89% and %RSE (relative standard error = standard error / mean × 100%) of 4.6%. In the omalizumab group, the pretreatment (week 0) mean free IgE level was 367 ng/ml with %CV of 84% and %RSE of 4.4%, while the overall average posttreatment free IgE level sampled at weeks 16, 32, and 48 was 16 ng/ml with %CV of 80% and %RSE of 2.6%. As shown in Fig. 1b, there was a notable dynamic FEV1 (percent predicted) effect in the omalizumab group and a modest FEV1 (percent predicted) improvement in the placebo group over the time course of the study. The pretreatment mean FEV1 (percent predicted) were 65.2 (%CV of 21% and %RSE of 1.1%) and 66.0 (%CV of 22% and %RSE of 1.2%), and the mean FEV1 (percent predicted) at week 48 were 69.6 (%CV of 23% and %RSE of 1.3%) and 72.4 (%CV of 25% and %RSE of 1.4%) for placebo and omalizumab groups, respectively. The mean FeNO responses during the study are depicted in Fig. 1c. The pretreatment mean FeNO was 28.4 (%CV of 98% and %RSE of 7.4%) for both placebo and omalizumab groups, while mean FeNO at week 48 were 27.5 (%CV of 103% and %RSE of 9.7%) and 22.5 (%CV of 80% and %RSE of 7.2%) for placebo and omalizumab groups, respectively.
IgE–FEV1 Model
The population parameter estimates (mean, interindividual variability, and associated %RSE) in the IgE–FEV1 model are presented in Table II. The estimated correlations of all parameters in IgE–FEV1 model were in the range from −0.41 to 0.80. To evaluate the goodness of fit of the model, the observed data were plotted against both the individual predictions and population predictions from the model (Fig. 3a, b). The standardized conditional residuals were also plotted against time and population predictions (Fig. 3c, d). Taken together, these results indicated that there were no systemic trends in the model standardized conditional residuals with time or with population predicted FEV1 (percent predicted), despite the significant variability in the observed data. Despite the large discrepancy in patients’ FEV1 (percent predicted) responses, the proposed models were capable of capturing these different types of responses, as evidenced by the good fits between the individual predicted and observed data in each case (Fig. 2).
Table II.
Summary of Parameters in the IgE–FEV1 Population Model
| Parameters | IgE–FEV1 model | |
|---|---|---|
| Mean (%RSE) | IIV (%RSE) | |
| K det (week−1) | 0.102 (15.5%) | 135% (17.7%) |
| I max | 0.0814 (14.0%) | 93.8% (21.0%) |
| IC50 (ng/ml) | 19.8 (12.2%) | 76.5% (21.1%) |
| H1 | 15.9 (38.0%) | 127% (53.0%) |
| slope | 0.00866 (34.0%) | 101% (42.5%) |
| inter | 74.9 (1.28%) | 17.3% (4.85%) |
| FEV1(0) | 64.6 (0.945%) | 20.4% (3.82%) |
| Residual variability (proportional) | 0.0547 (2.16%) | – |
| Residual variability (additive) | 6.13 (1.00%) | – |
Covariances for the model parameters are not shown in the table
%RSE percent relative standard error (SE / mean × 100%), IIV interindividual variability is reported as CV% (SD / mean × 100%), K det deterioration rate constant of FEV1, I max the maximum IgE inhibitory effect on FEV1, IC50 serum free IgE concentration causing 50% of the maximum inhibitory effect, H1 the hill coefficient, slope and inter the slope and intercept used to define maxFEV1 and FEV1(0) linear relationship shown in Eq. 3 in the “Materials and Methods” section, FEV1(0) FEV1 percent predicted at baseline (week 0)
Fig. 3.
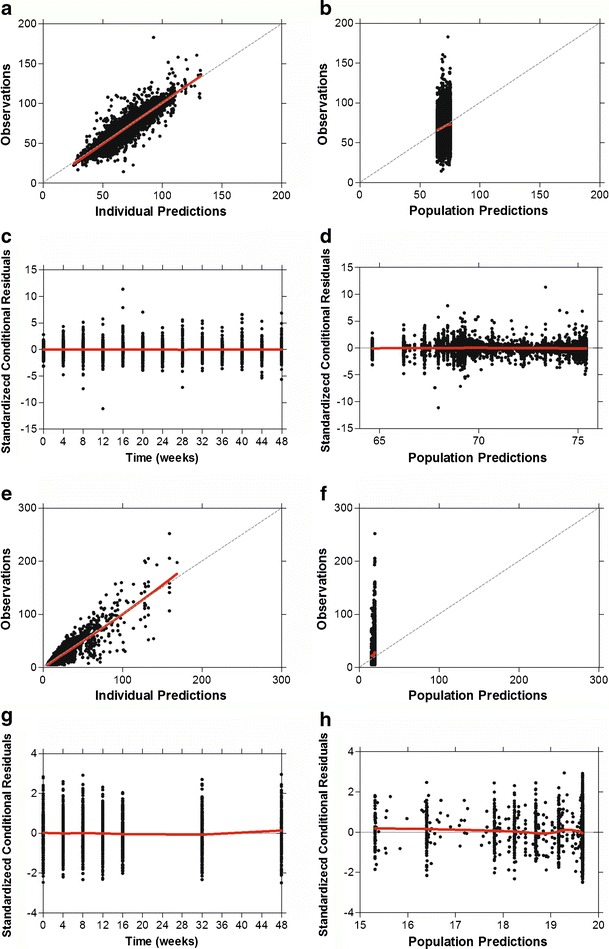
Goodness-of-fit plots for IgE–FEV1 model (a–d) and IgE–FeNO model (e–h). Each model includes scatter plots of the observations versus the individual model predictions (a, e) and population model predictions (b, f) and plots of standardized conditional residuals versus time (c, g) and population model predictions (d, h). Dashed lines are the lines of identity. Red lines are the loess fit lines
Numerous covariates, including demographics, disease status, and baseline PD biomarkers (Table I), were tested in the model to assess the impact of various factors on the variability observed in the FEV1 (percent predicted) responses. Graphical assessments of the potential covariates suggested clear effects of asthma reversibility (percent improvement from baseline after bronchodilator) on model parameters, inter and FEV1(0). In addition, all of the baseline spirometry measurements, including the forced vital capacity (FVC) and the forced expiratory flow during the middle half of the forced vital capacity (FEF25–75%), had obvious effects on FEV1(0). However, due to the expected high correlations among all the spirometry measurements, these covariates were not fully independent of the observed model output (FEV1 percent predicted). Moreover, incorporating these spirometry measurements as well as asthma reversibility in the model resulted in no significant decreases in the interindividual variability of parameters associated with the sensitivity and magnitude of drug response (IC50, H1, and Imax). Hence, these covariates were not included in the final model.
IgE–FeNO Model
The estimated population mean and interindividual variability of parameters in the IgE–FeNO model are summarized in Table III. The estimated correlations of all parameters in the IgE–FeNO model were in the range from −0.13 to 0.75. The resulting goodness-of-fit diagnostic plots are shown in Fig. 3e–h and indicated that there were no systemic biases in the model predictions.
Table III.
Summary of Parameters in the IgE–FeNO Population Model
| Parameters | IgE–FeNO model | |
|---|---|---|
| Mean (%RSE) | IIV (%RSE) | |
| K out (week−1) | 0.0216 (54.8%) | 195% (53.1%) |
| E max | 0.725 (21.5%) | 108% (20.9%) |
| EC50 (ng/ml) | 19.7 (37.8%) | 77.7% (42.6%) |
| H2 | 6.38 (47.0%) | 90.8% (46.0%) |
| minFeNO (ppb) | 11.4 (8.44%) | 33.0% (17.9%) |
| Residual variability (proportional) | 0.348 (1.61%) | – |
Covariances for the model parameters are not shown in the table
%RSE percent relative standard error (SE / mean × 100%), IIV interindividual variability is reported as CV% (SD / mean × 100%), K out decrease rate constant of FeNO, E max the maximum IgE stimulatory effect on FeNO, EC50 serum free IgE concentration causing 50% of the maximum stimulatory effect, H2 the hill coefficient, minFeNO the theoretical minimal steady-state FeNO response when free IgE decreases to 0
In the covariate analysis, given clear trends detected in the graphical assessments, baseline blood eosinophil count was further tested in the model as a covariate for Emax, EC50, H2, and minFeNO. However, baseline blood eosinophil count was not found to be a significant covariate according to the selection criteria (details in the “Materials and Methods” section). Therefore, similar to the IgE–FEV1 model, no covariates were incorporated in the IgE–FeNO model.
Model Evaluation
Model evaluation was performed using visual predictive checks for both the IgE–FEV1 and IgE–FeNO models. The results are shown in Fig. 4a, b, e. The 90% inclusion intervals for the model-predicted percentiles are also displayed. There was generally an agreement between the model-predicted and observed data across the 5th, 50th, and 95th percentiles. The median (50th percentile) of the model predictions and observations were plotted separately to show the trend more clearly (Fig. 4c, d, f). The predicted median reasonably reproduced the observed median responses of both FEV1 (percent predicted) and FeNO, with most of the observations falling within the 90% inclusion intervals of the predictions. These results confirmed that the two models were capable of capturing the time-dependent trends as well as overall variability in both the observed FEV1 (percent predicted) and FeNO responses.
Fig. 4.
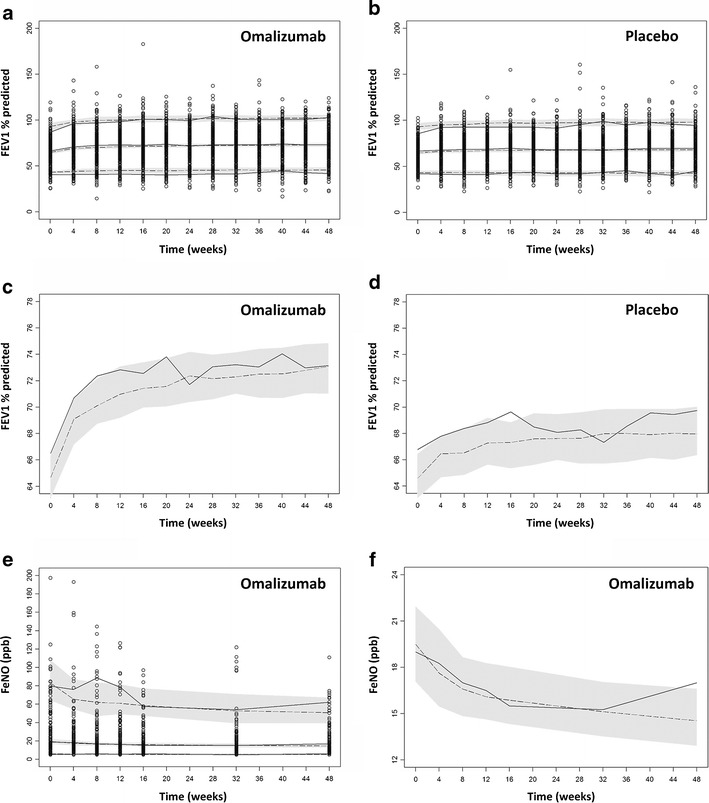
Visual predictive check results for the IgE–FEV1 (a–d) and IgE–FeNO (e, f) models. a, b, e Full visual predictive check plots; c, d, f medians (50th percentile) from the visual predictive check in order to show the trends more clearly. Open circles are the observations. Solid lines are the 5th, 50th, and 95th percentiles of the observations. Dashed lines are the 5th, 50th, and 95th percentiles of the simulated predictions. Shaded bands in a, b, e are the 90% inclusion intervals for the 5th, 50th, and 95th percentiles of the simulated predictions, and shaded bands in c, d, f are the 90% inclusion interval for the median simulated predictions
IgE–FEV1 and IgE–FeNO Relationships
To illustrate the IgE–FEV1 and IgE–FeNO relationships predicted by the models, model-predicted steady-state FEV1 (percent predicted) and FeNO were plotted versus free IgE using the following equations derived from the models:
 |
7 |
 |
8 |
where CIgE ranged from 2 to 2,000 ng/ml and all the parameter values used in the right-hand sides of the equations were the population mean estimates from the two models (Tables II and III). These plots are depicted in Fig. 5 as curves. The estimated mean IC50 of 19.8 ng/ml and EC50 of 19.7 ng/ml reflected the mean threshold free IgE level at which the FEV1 and FeNO responses occur, respectively. Supplementary Fig. 1 shows the observed posttreatment free IgE values of all subjects in the omalizumab group. The fluctuations around the estimated mean IC50 or EC50 (∼20 ng/ml) in the data support the identifiability of this parameter (both mean and interindividual variability) in the modeling analysis. In addition, the high hill coefficients (H1 and H2) of 15.9 and 6.38 indicated that both the FEV1 and FeNO responses were very sensitive to free IgE concentration changes in a narrow range around the mean IC50 and EC50 (calculated IC10–IC90 range was 17–23 ng/ml from Eq. 7 and calculated EC10–EC90 range was 14–28 ng/ml from Eq. 8). Histograms of the mean observed posttreatment free IgE values in both the placebo and omalizumab groups are also displayed in Fig. 5. There was a wide range of IgE values to inform the estimation of the sigmoidal relationship between IgE and FEV1 or between IgE and FeNO, including a large number of subjects with IgE values around the estimated IC50 or EC50 to allow estimation of the steepness (H1 and H2) of the relationship.
Fig. 5.
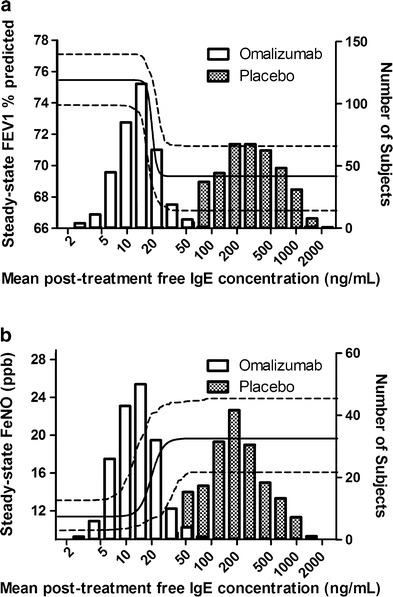
Model-predicted relationships between serum free IgE level and steady-state FEV1 percent predicted (a) and serum free IgE level and steady-state FeNO (b). Solid curves are the mean predictions and areas between two dashed curves are the 90% confidence intervals. The histograms illustrate the mean observed posttreatment serum free IgE distributions in the omalizumab and placebo groups
DISCUSSION
The models developed in this study aimed to quantitatively describe the relationships between serum free IgE and two clinically relevant outcome measures for asthma: FEV1 (percent predicted), a measure of pulmonary function, and FeNO, a measure of airway inflammation. Given this modeling objective, the linear-interpolated free IgE data from each study subject were used as the model input. This was considered appropriate given that the changes in clinical outcomes of asthma are generally slow, taking up to 3 months before asthma clinical symptoms reach new equilibrium (37). Hence, the minimal fluctuations in free IgE between omalizumab doses (every 2 or 4 weeks) would be expected to have a minimal impact on clinical outcomes and thus could be ignored. For the omalizumab-treated subjects, IgE data at an early time (0.1 week) were imputed via back-extrapolation in order to construct the missing IgE time course between weeks 0 and 16. A sensitivity test found no notable changes in the population estimates (mean and interindividual variability) with imputation times of 0.05 and 0.3 weeks.
In the IgE–FEV1 analysis, we modeled the omalizumab and placebo effects simultaneously as is conventionally done in many modeling studies (38–40). We have also explored the use of traditional placebo response modeling approaches, which model the treatment response as a subject-specific random deviation from the mean (or median) of the placebo response (38). This traditional approach is not applicable given that FEV1 (percent predicted) response in individual subjects can increase, decrease, or remain unchanged over the course of the study (Fig. 2). Instead of using a separate model for the placebo effect, the placebo effect was incorporated in the single differential equation (not an IDR model) by assuming nonequilibrium at baseline. Although the simple model structure assumed that the rate constants for placebo and treatment effect are the same, this assumption can be justified by the fact that the shape of the observed mean FEV1 (percent predicted) profiles (Fig. 1b) and the variability in individual subjects’ responses (Fig. 2) were comparable between these two groups.
It has been reported previously that average trough free IgE levels below 25 ng/ml were associated with optimal clinical responses to omalizumab (22). In this work, the population-based models estimated a mean IC50 of 19.8 ng/ml and EC50 of 19.7 ng/ml for the effect of free IgE on FEV1 and FeNO, respectively. The corresponding IC10–IC90 range was 17–23 ng/ml for FEV1 and EC10–EC90 range was 14–28 ng/ml for FeNO, suggesting that reducing the free IgE level below the range of 23 to 28 ng/ml is expected to lead to optimal improvement in lung function and reduction in airway inflammation. Thus, these results supported the previously reported mean target free IgE level (25 ng/ml) for omalizumab treatment and indicated that the current omalizumab dosing strategy based on this mean target free IgE level is reasonable.
Relatively high interindividual variability for IC50 (76.5%) and EC50 (77.7%) was estimated in the modeling, suggesting that the target free IgE levels could vary considerably among individuals. As shown in Fig. 6, the 90% inclusion interval was 6–52 ng/ml for the individual predicted IC50 in the IgE–FEV1 model and was 14–52 ng/ml for the individual predicted EC50 in the IgE–FeNO model. This can be partially explained by the differences in the fraction of allergen-specific IgE between subjects (41), and it is one of the reasons why, even when free IgE level dropped below 25 ng/ml in omalizumab treatment, some patients were still not able to respond to omalizumab. Furthermore, the relatively high mean hill coefficients (H1 and H2) estimated (15.9 in the IgE–FEV1 model and 6.38 in the IgE–FeNO model) indicated steep IgE–response relationship curves with narrow dynamic ranges (Fig. 5). These findings are also supported by prior studies on the mechanism of action of omalizumab. Once a threshold number of cell surface IgE cross-linking is reached, then histamine release will be triggered (42,43), resulting in an all-or-none (on/off) release at the level of a cell. However, the threshold differences across cells and, in addition, the downstream effects would be expected to smooth out this response, so that IgE–FEV1 relation may be steep but not on/off.
Fig. 6.
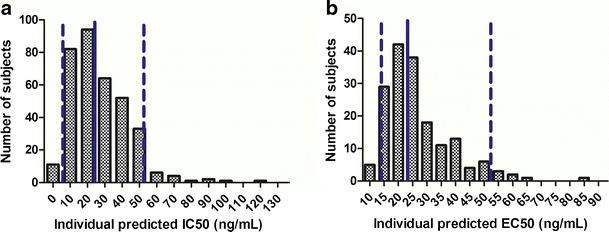
Distributions of individual model-predicted IC50 in IgE–FEV1 model (a) and EC50 in IgE–FeNO model (b). Solid lines are the medians and areas between dashed lines are the 90% inclusion intervals
In both models, the reciprocal of the deterioration rate constant (Kdet or Kout) can be thought of as mean response time (MRT). Based on the modeling results (Tables II and III), MRT was about 10 weeks for FEV1 response, which is consistent with historical data (37), while the MRT for FeNO response was about 45 weeks, indicating a slow underlying improvement in quenching allergen-driven eosinophilic inflammation, which needs to be confirmed with more FeNO data.
In general, efficacy modeling with data from late-stage clinical development is challenging due to the limited dose range evaluated. In this study, all patients’ omalizumab dosing was based on the omalizumab dosing table to decrease the free IgE concentration from the allowable pretreatment level range (72–1,680 ng/ml) to a low mean target value (25 ng/ml). As a result, there was a gap between the distributions of mean posttreatment free IgE levels in the omalizumab and placebo groups (Fig. 5). If the true free IgE IC50 of the IgE–FEV1 or EC50 of the IgE–FeNO relationship were to fall within this gap region, the data would not have been informative to produce precise estimates of the IC50, EC50, H1, and H2 values or stable modeling results. However, in this study, the mean estimates of both IC50 and EC50 were within the subject-rich regions, rather than the gap regions, in the free IgE distribution histograms, which increased our confidence in the stability and preciseness of the modeling results. Given the fact that in this study most of the omalizumab-treated subjects’ mean posttreatment free IgE levels were below 50 ng/ml with a mean of 16 ng/ml, the modeling results would be further confirmed if more data were available from an omalizumab-treated population with higher posttreatment free IgE levels.
CONCLUSIONS
The population-based efficacy models presented provide useful insights into the relationships between serum free IgE level and pulmonary function (as measured by FEV1 percent predicted) and airway inflammation (as measured by FeNO). The modeling results provided a quantitative validation for the mean target free IgE level (25 ng/ml) for omalizumab treatment. In addition, the resulting population models could be used to predict population FEV1 (percent predicted) or FeNO response for omalizumab and/or other anti-IgE asthma therapeutics for which PK-IgE models are constructed.
Electronic Supplementary Material
Below is the link to the electronic supplementary material.
(DOC 31 kb)
ACKNOWLEDGMENTS
We thank Phil Lowe, Tong Lu, Jin Yan Jin, Heleen Scheerens, Jeff Harris, Edward Conner, Michelle Freemer, Hsin-Ju Hsieh, Jin Zhu, Greg Spaniolo, and Dennis Wong for their advice and support and Yehong Wang for the data preparation for this analysis.
Conflicts of Interest
RZ, YZ, WSP, JV, MDE, JGM, and KER are employees of Genentech, Inc., a member of the Roche Group and are Roche stockholders. DZD declared an advisory relationship with Genentech, Inc., a member of the Roche Group.
REFERENCES
- 1.Masoli M, Fabian D, Holt S, Beasley R. Global Initiative for Asthma (GINA) Program. The global burden of asthma: executive summary of the GINA Dissemination Committee report. Allergy. 2004;59:469–478. doi: 10.1111/j.1398-9995.2004.00526.x. [DOI] [PubMed] [Google Scholar]
- 2.Beasley R. The burden of asthma with specific reference to the United States. J Allergy Clin Immunol. 2002;109(Suppl):482–489. doi: 10.1067/mai.2002.122716. [DOI] [PubMed] [Google Scholar]
- 3.Global Initiative for Asthma. Global strategy for asthma management and prevention (updated 2010). http://www.ginasthma.org/pdf/GINA_Report_2010.pdf (2010). Accessed 17 Aug 2012.
- 4.Fendrick AM, Baldwin JL. Allergen-induced inflammation and the role of immunologlobulin E (IgE) Am J Ther. 2001;8:291–297. doi: 10.1097/00045391-200107000-00011. [DOI] [PubMed] [Google Scholar]
- 5.Burrows B, Martinez FD, Halonen M, Barbee RA, Cline MG. Association of asthma with serum IgE levels and skin-test reactivity to allergens. N Engl J Med. 1989;320:271–277. doi: 10.1056/NEJM198902023200502. [DOI] [PubMed] [Google Scholar]
- 6.Holt PG, Macaubas C, Stumbles PA, Sly PD. The role of allergy in the development of asthma. Nature. 1999;402(Suppl):B12–B17. doi: 10.1038/35037009. [DOI] [PubMed] [Google Scholar]
- 7.Novak N, Bieber T. Allergic and nonallergic forms of atopic diseases. J Allergy Clin Immunol. 2003;112:252–262. doi: 10.1067/mai.2003.1595. [DOI] [PubMed] [Google Scholar]
- 8.Prussin C, Metcalfe DD. 4. IgE, mast cells, basophils, and eosinophils. J Allergy Clin Immunol. 2003;111(Suppl):486–494. doi: 10.1067/mai.2003.120. [DOI] [PubMed] [Google Scholar]
- 9.Holgate S, Casale T, Wenzel S, Bousquet J, Deniz Y, Reisner C. The anti-inflammatory effects of omalizumab confirm the central role of IgE in allergic inflammation. J Allergy Clin Immunol. 2005;115:459–465. doi: 10.1016/j.jaci.2004.11.053. [DOI] [PubMed] [Google Scholar]
- 10.Vollmer WM, Buist AS, Johnson LR, McCamant LE, Halonen M. Relationship between serum IgE and cross-sectional and longitudinal FEV1 in two cohort studies. Chest. 1986;90:416–423. doi: 10.1378/chest.90.3.416. [DOI] [PubMed] [Google Scholar]
- 11.Sherrill DL, Lebowitz MD, Halonen M, Barbee RA, Burrow B. Longitudinal evaluation of the association between pulmonary function and total serum IgE. Am J Respir Crit Care Med. 1995;152:98–102. doi: 10.1164/ajrccm.152.1.7599870. [DOI] [PubMed] [Google Scholar]
- 12.Shadick NA, Sparrow D, O’Connor GT, DeMolles D, Weiss ST. Relationship of serum IgE concentration to level and rate of decline of pulmonary function: the normative aging study. Thorax. 1996;51:787–792. doi: 10.1136/thx.51.8.787. [DOI] [PMC free article] [PubMed] [Google Scholar]
- 13.Zeiger RS, Heller S. The development and prediction of atopy in high-risk children: follow-up at age seven years in a prospective randomized study of combined maternal and infant food allergen avoidance. J Allergy Clin Immunol. 1995;95:1179–1190. doi: 10.1016/S0091-6749(95)70074-9. [DOI] [PubMed] [Google Scholar]
- 14.Lowe PJ, Tannenbaum S, Gautier A, Jimenez P. Relationship between omalizumab pharmacokinetics, IgE pharmacodynamics and symptoms in patients with severe persistent allergic (IgE-mediated) asthma. Br J Clin Pharmacol. 2009;68:61–76. doi: 10.1111/j.1365-2125.2009.03401.x. [DOI] [PMC free article] [PubMed] [Google Scholar]
- 15.Ahmad Al Obaidi AH, Mohamed AI Samarai AG, Yahya Al Samarai AK, Al Janabi JM. The predictive value of IgE as biomarker in asthma. J Asthma. 2008;45:654–663. doi: 10.1080/02770900802126958. [DOI] [PubMed] [Google Scholar]
- 16.Piacentini GL, Bodini A, Costella S, Vicentini L, Mazzi P, Sperandio S, et al. Exhaled nitric oxide and sputum eosinophil markers of inflammation in asthmatic children. Eur Respir J. 1999;13:1386–1390. doi: 10.1183/09031936.99.13613919. [DOI] [PubMed] [Google Scholar]
- 17.Warke TJ, Fitch PS, Brown V, Taylor R, Lyons JDM, Ennis M, et al. Exhaled nitric oxide correlates with airway eosinophils in childhood asthma. Thorax. 2002;57:383–387. doi: 10.1136/thorax.57.5.383. [DOI] [PMC free article] [PubMed] [Google Scholar]
- 18.Payne DN, Adcock IM, Wilson NM, Oates T, Scallan M, Bush A. Relationship between exhaled nitric oxide and mucosal eosinophilic inflammation in children with difficult asthma, after treatment with oral prednisolone. Am J Respir Crit Care Med. 2001;164:1376–1381. doi: 10.1164/ajrccm.164.8.2101145. [DOI] [PubMed] [Google Scholar]
- 19.Dweik RA, Boggs PB, Erzurum SC, Irvin CG, Leigh MW, Lundberg JO, et al. An official ATS clinical practice guideline: interpretation of exhaled nitric oxide levels (FENO) for clinical applications. Am J Respir Crit Care Med. 2011;184:602–615. doi: 10.1164/rccm.9120-11ST. [DOI] [PMC free article] [PubMed] [Google Scholar]
- 20.Sacco O, Sale R, Silvestri M, Serpero L, Sabatini F, Raynal ME, et al. Total and allergen-specific IgE levels in serum reflect blood eosinophilia and fractional exhaled nitric oxide concentrations but not pulmonary functions in allergic asthmatic children sensitized to house dust mites. Pediatr Allergy Immunol. 2003;14:475–481. doi: 10.1046/j.0905-6157.2003.00092.x. [DOI] [PubMed] [Google Scholar]
- 21.Hanania NA, Alpan O, Hamilos DL, Condemi JJ, Reyes-Rivera I, Zhu J, et al. Omalizumab in severe allergic asthma in inadequately controlled with standard therapy: a randomized trial. Ann Intern Med. 2011;154:573–582. doi: 10.7326/0003-4819-154-9-201105030-00002. [DOI] [PubMed] [Google Scholar]
- 22.Hochhaus G, Brookman L, Fox H, Johnson C, Matthews J, Ren S, et al. Pharmacodynamics of omalizumab: implications for optimised dosing strategies and clinical efficacy in the treatment of allergic asthma. Curr Med Res Opin. 2003;19:491–498. doi: 10.1185/030079903125002171. [DOI] [PubMed] [Google Scholar]
- 23.Adelroth E, Rak S, Haahtela T, Aasand G, Rosenhall L, Zetterstorm O, et al. Recombinant humanized mAb-E25, an anti-IgE mAb, in birch pollen-induced seasonal allergic rhinitis. J Allergy Clin Immunol. 2000;106:253–259. doi: 10.1067/mai.2000.108310. [DOI] [PubMed] [Google Scholar]
- 24.Hayashi N, Tsukamoto Y, Sallas WM, Lowe PJ. A mechanism-based binding model for the population pharmacokinetics and pharmacodynamics of omalizumab. Br J Clin Pharmacol. 2007;63:548–561. doi: 10.1111/j.1365-2125.2006.02803.x. [DOI] [PMC free article] [PubMed] [Google Scholar]
- 25.Standardization of spirometry, 1994 update. American Thoracic Society. Am J Respir Crit Care Med. 1995;152:1107–36. [DOI] [PubMed]
- 26.Solèr M, Matz J, Townley R, Buhl R, O’Brien J, Fox H, et al. The anti-IgE antibody omalizumab reduces exacerbations and steroid requirement in allergic asthmatics. Eur Respir J. 2001;18:254–261. doi: 10.1183/09031936.01.00092101. [DOI] [PubMed] [Google Scholar]
- 27.Busse W, Corren J, Lanier BQ, McAlary M, Fowler-Taylor A, Cioppa GD, et al. Omalizumab, anti-IgE recombinant humanized monoclonal antibody, for the treatment of severe allergic asthma. J Allergy Clin Immunol. 2001;108:184–190. doi: 10.1067/mai.2001.117880. [DOI] [PubMed] [Google Scholar]
- 28.Crapo RO, Morris AH, Gardner RM. Reference spirometric values using techniques and equipment that meet ATS recommendations. Am Rev Respir Dis. 1981;123:659–664. doi: 10.1164/arrd.1981.123.6.659. [DOI] [PubMed] [Google Scholar]
- 29.Polgar G, Promadhat V. Pulmonary function testing in children: techniques and standards. Philadelphia: W.B. Saunders; 1971. pp. 170–180. [Google Scholar]
- 30.Wang X, Shang D, Ribbing J, Ren Y, Deng C, Zhou T, et al. Placebo effect model in asthma clinical studies: longitudinal meta-analysis of forced expiratory volume in 1 second. Eur J Clin Pharmacol. 2012;68:1157–1166. doi: 10.1007/s00228-012-1245-2. [DOI] [PubMed] [Google Scholar]
- 31.Krzyanski W, Jusko WJ. Integrated functions for four basic models of indirect pharmacodynamics response. J Pharm Sci. 1998;87:67–72. doi: 10.1021/js970168r. [DOI] [PubMed] [Google Scholar]
- 32.Schumitzky A. EM algorithms and two stage methods in pharmacokinetic population analysis. In: D’Argenio DZ, editor. Advanced methods of pharmacokinetic and pharmacodynamic systems analysis. New York: Plenum; 1995. pp. 140–160. [Google Scholar]
- 33.Walker S. An EM, algorithm for nonlinear random effects models. Biometrics. 1996;52:934–944. doi: 10.2307/2533054. [DOI] [Google Scholar]
- 34.Bauer RJ, Guzy S. Monte Carlo parameter expectation maximization (MC-PEM) method for analyzing population pharmacokinetic/pharmacodynamic data. In: D’Argenio DZ, editor. Advanced methods of pharmacokinetic and pharmacodynamic systems analysis. Massachusetts: Kluwer Academic; 2004. pp. 155–163. [Google Scholar]
- 35.D’Argenio DZ, Schumitzky A, Wang X. ADAPT 5 user’s guide: pharmacokinetic/pharmacodynamic systems analysis software. Los Angeles: Biomedical Simulations Resource; 2009. [Google Scholar]
- 36.Holford N. The visual predictive check—superiority to standard diagnostic (Rorschach) plots. Abstract 738, p. 14. http://www.page-meeting.org/?abstract=738 (2005). Accessed 25 Oct 2012.
- 37.Slavin RG, Ferioli C, Tannenbaum SJ, Martin C, Blogg M, Lowe PJ. Asthma symptom re-emergence after omalizumab withdrawal correlates well with increasing IgE and decreasing pharmacokinetic concentrations. J Allergy Clin Immunol. 2009;123:107.e3–113.e3. doi: 10.1016/j.jaci.2008.09.050. [DOI] [PubMed] [Google Scholar]
- 38.Samara E, Cao G, Locke C, Granneman GR, Dean R, Killian A. Population analysis of the pharmacokinetics and pharmacodynamics of seratrodast in patients with mild to moderate asthma. Clin Pharmacol Ther. 1997;62:426–435. doi: 10.1016/S0009-9236(97)90121-1. [DOI] [PubMed] [Google Scholar]
- 39.Zhou H, Hu C, Zhu Y, Lu M, Liao S, Yeilding N, et al. Population-based exposure-efficacy modeling of ustekinumab in patients with moderate to severe plaque psoriasis. J Clin Pharmacol. 2010;50:257–267. doi: 10.1177/0091270009343695. [DOI] [PubMed] [Google Scholar]
- 40.Hu C, Xu Z, Zhang Y, Rahman MU, Davis HM, Zhou H. Population approach for exposure-response modeling of golimumab in patient with rheumatoid arthritis. J Clin Pharmacol. 2011;51:639–648. doi: 10.1177/0091270010372520. [DOI] [PubMed] [Google Scholar]
- 41.Johansson SGO, Nopp A, Öman H, Ankerst J, Cardell LO, Grönneberg R, et al. The size of the disease relevant IgE antibody fraction in relation to ‘total-IgE’ predicts the efficacy of anti-IgE (Xolair) treatment. Allergy. 2009;64:1472–1477. doi: 10.1111/j.1398-9995.2009.02051.x. [DOI] [PubMed] [Google Scholar]
- 42.MacGlashan DW, Jr, Peters SP, Warner J, Lichtenstein LM. Characteristics of human basophil sulfidopeptide leukotriene release: releasability defined as the ability of the basophil to respond to dimeric cross-links. J Immunol. 1986;136:2231–2239. [PubMed] [Google Scholar]
- 43.MacGlashan DW., Jr Releasability of human basophils: cellular sensitivity and maximal histamine release are independent variables. J Allergy Clin Immunol. 1993;91:605–615. doi: 10.1016/0091-6749(93)90266-I. [DOI] [PubMed] [Google Scholar]
Associated Data
This section collects any data citations, data availability statements, or supplementary materials included in this article.
Supplementary Materials
(DOC 31 kb)