

Abstract
Liver metastasis in colorectal cancer is the major cause of cancer-related deaths. To identify and characterize proteins associated with colon cancer metastasis, we have compared the conditioned serum-free medium of highly metastatic KM12SM colorectal cancer cells with the parental, poorly metastatic KM12C cells using quantitative stable isotope labeling by amino acids in cell culture (SILAC) analyses on a linear ion trap-Orbitrap Velos mass spectrometer. In total, 1337 proteins were simultaneously identified in SILAC forward and reverse experiments. For quantification, 1098 proteins were selected in both experiments, with 155 proteins showing >1.5-fold change. About 52% of these proteins were secreted directly or using alternative secretion pathways. GDF15, S100A8/A9, and SERPINI1 showed capacity to discriminate cancer serum samples from healthy controls using ELISAs. In silico analyses of deregulated proteins in the secretome of metastatic cells showed a major abundance of proteins involved in cell adhesion, migration, and invasion. To characterize the tumorigenic and metastatic properties of some top up- and down-regulated proteins, we used siRNA silencing and antibody blocking. Knockdown expression of NEO1, SERPINI1, and PODXL showed a significant effect on cellular adhesion. Silencing or blocking experiments with SOSTDC1, CTSS, EFNA3, CD137L/TNFSF9, ZG16B, and Midkine caused a significant decrease in migration and invasion of highly metastatic cells. In addition, silencing of SOSTDC1, EFNA3, and CD137L/TNFSF9 reduced liver colonization capacity of KM12SM cells. Finally, the panel of six proteins involved in invasion showed association with poor prognosis and overall survival after dataset analysis of gene alterations. In summary, we have defined a collection of proteins that are relevant for understanding the mechanisms underlying adhesion, migration, invasion, and metastasis in colorectal cancer.
Despite the efforts for colorectal cancer (CRC)1 prevention using different strategies (1–6), 30–40% of patients have regionally advanced disease or suffer from metastasis when diagnosed (7). Moreover, half of the CRC patients will develop recurrence and liver metastasis within 5 years (8). Although genetic changes leading to the development of sporadic colorectal cancer primary tumors in intestinal cells have been relatively well characterized (9), further efforts are necessary to better understand the biology of CRC metastasis and to identify associated markers that can be used as diagnostic/prognostic biomarkers or potential drug targets. Metastasis is a complex process involving different steps from extravasation to liver colonization and requires the concerted action of a large number of proteins to modulate different effects on adhesion, migration, invasion, and survival at the target organ (10).
Cancer cells secrete proteins or protein fragments to body fluids, such as blood, that can be used as biomarkers (11, 12) and/or potential therapeutic targets (13). In the case of CRC, there are only three proteins currently used as biomarkers: the carcinoembryonic antigen (CEA) for recurrence and metastasis (1), deleted in colorectal carcinoma (DCC), and vascular endothelial growth factor (VEGF). The secretome constitutes a rich source of information not only for the identification of biomarkers but for the characterization of altered molecules like growth factors, cytokines, proteases, etc., which are vital for cancer progression and metastasis.
We are using the well known human KM12 cell system (14) to study the biology of CRC metastasis. KM12SM cells, which possess high metastatic capacity to liver, were isolated from liver metastases in nude mice after five cycles of intrasplenic injection of the poorly metastatic cell line KM12C (14, 15). Multiple studies support a good correlation between the findings observed in the KM12 cell model and patient samples, indicating that KM12 isogenic cell lines recapitulate quite effectively some of the critical issues in CRC metastasis (16–21). In a previous study, we carried out a characterization of plasma membrane proteins of metastatic KM12 cells using a SILAC assay but with a low accuracy and resolution linear ion trap (17). About 60 proteins that showed ≥1.5-fold-change between both types of cells were identified. Recent studies applied iTRAQ or label-free quantification to other pairs of isogenic, nonmetastatic-metastatic colorectal cancer cell lines, SW480 and SW620, for the characterization of protein differences in the whole cell proteome (22) and secretome (23), respectively. The SW620 cell line was isolated from a metastatic lymph node of the same patient as SW480 (24). In contrast, KM12SM cells were chosen based on their capacity for liver metastasis, which makes them most appropriate for the study of liver homing and late stages of metastasis.
We are analyzing different fractions of KM12 cells, including the secretome, for a deeper analysis of functionally relevant proteins in metastasis. In a previous report, we analyzed the cytokine/chemokine profiles released in the conditioned media by colorectal metastatic cancer KM12SM cells compared with KM12C using antibody microarrays (20). We found an important role for TH2 cytokine IL-13 and its receptor IL13Rα2 in cell adhesion, migration, invasion, and liver colonization. Here, we continued this in-depth characterization of the secretome compartment using SILAC analysis with a high accuracy and resolution mass spectrometer, the linear ion trap Orbitrap Velos. The proteomic characterization resulted in the identification and quantification of 1337 and 1098 proteins, respectively, in the conditioned medium. In silico studies demonstrated a predominant association of deregulated proteins in metastatic cells to adhesion, migration, and invasion processes. Three candidates (GDF15, S100A8/A9, and SERPINI1) showed promise as CRC diagnostic markers in serum samples from CRC patients using ELISA. Functional studies using siRNA silencing and antibody blocking experiments demonstrated important tumorigenic and invasive properties in some previously uncharacterized proteins in CRC. In addition, three proteins, EFNA3, CD137L/TNFSF9, and SOSTDC1, demonstrated a critical role in liver homing for metastasis. Finally, meta-analysis of mRNA alterations data indicated that CD137L/TNFSF9, CTSS, SOSTDC1, ZG16B, EFNA3, and MDK were associated with poor prognosis in colorectal cancer.
EXPERIMENTAL PROCEDURES
KM12 Cells and SILAC Cell Culture
KM12C and KM12SM human colon cancer cells were obtained from the Fidler laboratory (MD Anderson Cancer Center, Houston, TX) (14). Prior to metabolic labeling, KM12 cells were expanded in the laboratory to prepare a large batch of working aliquots that were stored in liquid nitrogen. These two cell lines were not authenticated in our laboratory. DMEM containing l-lysine and l-arginine or heavy l-[13C6]lysine and l-[13C6]arginine was purchased from Dundee Cell Products. For metabolic labeling, KM12C and KM12SM cells were grown and maintained in DMEM supplemented with 10% dialyzed FBS (Invitrogen), 100 units/ml penicillin/streptomycin (Invitrogen) at 37°C in 5% CO2, with either isotopically light or heavy amino acids for eight doublings to achieve >98% incorporation of the labeled amino acids. Incorporation of heavy amino acids was determined as described previously (25). We carried out forward and reverse experiments to avoid any labeling bias in the study.
Sample Preparation, SDS-PAGE, and In-gel Digestion
A scheme of the labeling procedure is shown in supplemental Fig. S1. For preparation of conditioned medium, 5 × 10⁶ KM12C or KM12SM cells, either heavy or light labeled, were seeded for 24 h. Cells were washed with PBS, incubated with serum-free medium for 1 h, washed again with PBS, and incubated for 48 h in serum-free DMEM supplemented with heavy or light amino acids. Cell viability, determined with 0.4% trypan blue solution (Invitrogen), was higher than 95%. The conditioned medium was centrifuged at 1500 × g to remove cell debris and stored at −80°C until use.
Proteins in the conditioned medium were precipitated with methanol/chloroform (26). Protein content was quantified with the 2D-Quant kit (GE Healthcare) and/or by fluorescence using the tryptophan method (27). Then 100 μg of protein from KM12C and KM12SM cells conditioned medium were mixed at a 1:1 ratio and run at 25 mA per gel in 12.5% SDS-PAGE. Gels were stained with the Colloidal Blue staining kit (Invitrogen), and lanes containing forward and reverse labeling experiments were cut into 18 slices. Excised bands were cut into small pieces and destained with 50 mm ammonium bicarbonate, 50% ACN, dehydrated with ACN, and dried. Gel pieces were rehydrated with 12.5 ng/μl trypsin in 50 mm ammonium bicarbonate and incubated overnight at 30°C. Peptides were extracted at 37°C using 100% ACN and then 0.5% TFA, dried, cleaned using ZipTip with 0.6 μl C18 resin (Millipore), and reconstituted in 5 μl of 0.1% formic acid, 2% ACN.
Mass Spectrometry Analysis, Protein Identification, and SILAC Quantification
Peptides were trapped onto a C18-A1 ASY-Column 2-cm precolumn (Thermo Scientific), then eluted onto a Biosphere C18 column (C18, inner diameter 75 μm, 10 cm long, 3-μm particle size) (NanoSeparations), and separated using a 170-min gradient from 0 to 35% Buffer B (Buffer A: 0.1% formic acid, 2% ACN; Buffer B: 0.1% formic acid in ACN) at a flow rate of 300 nl/min on a NanoEasy HPLC (Proxeon) coupled to a nanoelectrospray ion source (Proxeon). Mass spectra were acquired on an LTQ-Orbitrap Velos mass spectrometer (Thermo Scientific) in the positive ion mode. Full scan MS spectra (m/z 400–1200) were acquired in the Orbitrap with a target value of 1,000,000 at a resolution of 60,000 at m/z 400, and the 15 most intense ions were selected for collision-induced dissociation (CID) fragmentation in the linear ion trap with a target value of 10,000 and normalized collision energy of 35%. Precursor ion charge state screening and monoisotopic precursor selection were enabled. Singly charged ions and unassigned charge states were rejected. Dynamic exclusion was enabled with a repeat count of 1 and exclusion duration of 30 s. Mass spectra *.raw files were searched against the human SwissProt database (SwissProt_57.15.fasta) using the MASCOT search engine (version 2.3, Matrix Science) through Proteome Discoverer (version 1.3.0.339) (Thermo Scientific). Search parameters included a maximum of two missed cleavages allowed, carbamidomethylation of cysteines as a fixed modification and oxidation of methionine, N-terminal acetylation, and [13C]Arg, [13C]Lys as variable modifications. Precursor and fragment mass tolerance were set to 10 ppm and 0.8 Da, respectively. Identified peptides were validated using Percolator algorithm (28) with a q-value threshold of 0.01. Relative quantification of identified peptides was performed using Proteome Discoverer. For each SILAC pair, Proteome Discoverer determined the area of the extracted ion chromatogram and computed the “heavy/light” ratio. Protein ratios were then calculated as the median of all the quantified unique peptides belonging to a certain protein. The ratios among proteins in the heavy and light versions were used as fold-change. Protein ratios with higher variability were manually inspected by checking the isotopic envelope of both heavy and light forms and how many peaks of the envelope were used to determine the area of the envelope of all PSMs corresponding to the peptides used to identify the protein. A multipoint normalization strategy was applied to normalize the data sets against the 5% trimmed mean values, which is a robust statistical measure of central tendency that normalizes most of the log2 protein ratios to 0. Briefly, 5% of the most extreme outliers (values) were removed, and the mean of 95% of the remaining data was determined and used to normalize the ratio values, thus minimizing the effect of these extreme outliers and centering the log2 ratio distribution to zero. Because metabolic conversion of arginine/proline can affect quantification accuracy in some cell types, we investigated arginine to proline conversion in KM12 cells. By adding heavy proline as a variable modification, less than 2% of proline-containing peptides were heavy labeled in KM12 cells, which has been reported not to affect significantly SILAC quantification (25).
Western Blot
For Western blot, conditioned media from KM12C and KM12SM CRC cells were concentrated 100-fold using VIVASPIN 500 (cutoff, 3000 Da) (Sartorius) by centrifugation at 15,000 × g. Then 25 μg of each protein extract were separated by SDS-PAGE and transferred to Hybond-C nitrocellulose membranes (GE Healthcare) using mini trans-blot equipment (Bio-Rad). After blocking, membranes were incubated with specific monoclonal or polyclonal antibodies against the selected proteins (supplemental Table S1). Membranes were incubated at optimized dilutions of primary antibodies followed by incubation with either HRP anti-mouse IgG (Pierce) at 1:5000 dilution, HRP anti-rabbit IgG (Sigma-Aldrich) at 1:5000 dilution, or HRP anti-goat IgG (Dako Cytomation) at 1:10,000 dilution. Specific reactive proteins were visualized with ECL SuperSignal West Femto (Pierce).
Serum Samples
The Institutional Ethical Review Boards of the Centro de Investigaciones Biológicas and the Spanish Research Council approved these studies in colorectal cancer. Written informed consent was obtained from all patients. Sixty serum samples from CRC patients (n = 40, A–D Duke's stages) and healthy control reference sera (n = 20) were obtained from Hospital Puerta de Hierro (Madrid, Spain), Hospital de Salamanca (Salamanca, Spain), and the Hospital of Cabueñes (Gijón, Spain). Clinical data from all the patients are shown in supplemental Table S2. All sera were processed using identical procedures. Blood samples were left at room temperature for a minimum of 30 min (and a maximum of 60 min) to allow clot formation and then centrifuged at 3000 × g for 10 min at 4°C. The serum was frozen and stored at −80°C until use. Samples were handled anonymously according to ethical and legal guidelines at the Spanish Research Council and the respective hospitals.
ELISA
ELISA kits were purchased from RayBiotech (GDF15), USCN Life Sciences (VGF, SERPINI1, NEO1, and ZG16B), Cusabio (LUM and PODXL), ImmunoDiagnostiK (S100A8/A9), and BMAssay (SOSTDC1). Specificity of the ELISA kits was verified by the manufacturers. ELISA experiments were carried out using the recommended serum dilution in each case and according to the instructions of the manufacturer. The sensitivity of the ELISA kits for detection of S100A8/A9, GDF15, and SERPINI1 was 76, 2, and 280 pg/ml, respectively. For the analysis of ELISA data sets, a one-tailed Student's t test was performed assuming unequal variances to assess whether the means of healthy normal and CRC groups were statistically different from each other. Each individual protein marker was evaluated by a receiver operating characteristic (ROC) curve, and the corresponding area under the curve (AUC) calculated using JMP10 (SAS).
Cell Proliferation, Adhesion, Migration, Invasion Assays
KM12SM cells were transiently transfected with siRNAs directed against NEO1, SERPINI1, MDK, general transcription factor II-I, GDF15, EFNA3, ZG16B, PODXL, and control siRNA (Sigma-Aldrich) using JetPrime Transfection Reagent (Polyplus). In addition, we performed experiments with KM12SM cells incubated with or without indicated antibodies (supplemental Table S1). For siRNA transfections, 5 × 10⁵ cells were seeded in culture plates and maintained in DMEM with 10% fetal calf serum at 37°C in 5% CO2 for 24 h. Then cells growing in 1 ml of DMEM with 10% fetal calf serum were transfected with 55 pmol of siRNA using 2 μl of JetPrime Transfection reagent in 200 μl of JetPrime buffer. Finally, 24 h after transfection, cells were used for invasion, migration and proliferation assays, whereas adhesion assays were performed 48 h after transfection (20). For confirming siRNA knockdown, cells were subjected to RT-PCR and Western blot analysis using specific primers and antibodies, respectively.
For cell proliferation, 104 transfected cells were seeded in 96-well culture plates for 16 h and transferred to medium containing 2% FBS with or without the indicated antibodies. After 24 h, cell viability was determined using the 3-(4,5-dimethylthiazol-2-yl)-2,5-diphenyltetrazolium bromide assay (Promega). For cell adhesion, 96-well plates were coated with Matrigel (0.4 μg/mm2) (BD Biosciences) in coating buffer (0.1 m NaHCO3, pH 8.8) for 20 h and incubated with 0.5% BSA in 0.1 m NaHCO3, pH 8.8, for 2 h to block unspecific binding. Cells were starved without serum for 5 h and incubated in the presence or absence of different antibodies. Cells were labeled with BCECF-AM: (2′,7′-bis-(2-carboxyethyl)-5-(and-6)-carboxyfluorescein) acetoxymethyl (Invitrogen), detached with 2 mm EDTA in PBS, and resuspended in adhesion medium. 7 × 10⁴ cells in 100 μl were added in triplicate to plates and then incubated for 25 min. Nonadherent cells were removed by two washes with DMEM. Bound cells were lysed in 1% SDS in PBS and quantified using a fluorescence analyzer (POLARstar Galaxy).
For wound healing/migration, transfected cells were cultured to confluence in Matrigel-coated plates (0.4 μg/mm2), and a 1 mm-wide wound was made across the monolayer using a 200-μl micropipette tip. The cells were incubated in the presence (5 μg/ml) or absence of antibodies. Pictures were taken immediately (0 h) and 24 h after the injury. Migration speed was calculated as the distance covered by cells in 1 day divided by 24 h and by 2 (advance in two fronts).
For invasion, 6 × 10⁴ transfected cells were resuspended in serum-free DMEM and loaded onto 8-μm pore-size filters coated with 35 μl of a 1:3 dilution of Matrigel on Transwells (Costar). The lower compartments of the invasion chambers were filled with DMEM with 10% serum or medium alone. After 48 h of incubation, noninvading cells were removed from the upper surface of the filter, and invasive cells were fixed with 4% paraformaldehyde (Sigma-Aldrich), stained with crystal violet, and counted under a microscope.
In Vivo Liver Homing Assays
Homing assays were performed as described previously (20). In brief, KM12SM cells transfected with different siRNAs were inoculated intrasplenically in Swiss nude mice (n = 3 per siRNA). Mice were euthanized 24 h after inoculation. Then RNA was isolated from the liver using TRIzol (Invitrogen) and retrotranscribed, and 0.3 μg of cDNA was subjected to PCR with TaqDNA polymerase (Invitrogen) to amplify human GAPDH. The PCR consisted of 30 cycles of amplification. As loading control, a 20-cycle amplification of murine β-actin was performed.
Bioinformatic and Statistical Analysis
SignalP 4.0 and SecretomeP 2.0 were used to determine the secretion pathways of the quantified proteins. For SignalP 4.0, those proteins having a cutoff value exceeding 0.45 possessed a signal peptide. According to SecretomeP 2.0 guidelines, proteins secreted through nonclassical pathways showed an NN-score above 0.5 without containing a signal peptide predicted by SignalP (29). Exocarta database was used to identify differentially released proteins previously identified in exosomes and to correlate them with externalization through nonclassical secretion (30). The Ingenuity Pathway Analysis (IPA) (Ingenuity Systems) (2012 Spring release version) was used to predict biological functions and, together with STRING 9.0 (31, 32), to determine Gene Ontology annotations and protein interaction analysis in the secretome of KM12 CRC cells. Individual features of the identified proteins (location, function, etc.) were further investigated by using GeneCards database.
cBio Cancer Genomics Portal was used to determine the association of selected proteins to prognosis of CRC using publicly available genomic data on colorectal adenocarcinoma using breast invasive carcinoma, glioblastoma multiforme, and lung squamous cell carcinoma genomic data as control. The portal provides visualization, analysis, and download of large scale cancer genomics data sets from 26 cancer genomic studies (33). Fisher's exact test was used to calculate the p values indicating the probability that each biological function assigned to the data set is assigned by chance. For other analyses, statistical comparisons were performed using the two-tailed Student's t test. p values <0.05 were considered statistically significant.
RESULTS
Protein Identification and Quantification in KM12 Conditioned Media Using SILAC
Conditioned media from highly metastatic KM12SM and poorly metastatic KM12C cells were investigated for differences in secreted proteins that could be associated with CRC metastasis. A scheme of the procedure is shown in supplemental Fig. S1. To avoid biases in cell labeling that could affect the final quantification, we performed forward (heavy KM12SM versus light KM12C cells) and reverse labeling experiments (light KM12SM versus heavy KM12C cells). Conditioned media were harvested after 48 h, concentrated, and quantified. Protein extracts were mixed 1:1 and run on SDS-polyacrylamide gels; 18 bands were excised and in-gel digested. Then peptides were separated using reverse phase and analyzed on a linear ion trap Orbitrap Velos mass spectrometer. A total of 11,565 peptides were identified in both forward and reverse experiments resulting in 2087 identified proteins and 1337 overlapping proteins (supplemental Table S3 and Fig. 1A).
Fig. 1.

Identification, quantification, and data normalization of proteins. A, proteins identified and quantified in both SILAC experiments. About 64% of proteins were coincident in both SILAC analyses, forward and reverse. B, histogram plot of the fold-changes for all of the quantified proteins in log2-transformed ratios after normalization for both SILAC experiments and the combined data. Data normalization was performed against the 5% trimmed mean to adjust log2 protein ratio distribution to zero. Curves representing normal distribution and not normalized data curves are represented.
For quantification, peptide ratios were calculated using Proteome Discoverer by comparing the intensities of the light- and heavy-labeled precursor ions at high resolution. Proteins were quantified with at least one peptide hit in forward and reverse experiments. In total, 8581 peptides corresponding to 1722 proteins were used for quantification with 1098 quantified proteins common in both forward and reverse experiments (Fig. 1A). Histogram plot of log2-transformed SILAC ratio distributions showed that in general the proteins of the heavy labeled samples were expressed at 2-fold higher ratios (Fig. 1B). Given the efficient metabolic labeling (>98%), these deviations might be due to an inaccurate protein quantification or problems with sample mixing. To overcome this issue, we normalized the data sets against the 5% trimmed means to minimize the effect of extreme outliers and to center the protein log2 ratio distribution to zero (Fig. 1B) (34). After this normalization, we fixed a fold-change of >1.5 (mean of two experiments) and a variability lower than 20% for selection. For a few proteins with only one quantified peptide or with variability >20%, MS and MS/MS spectra were manually inspected to avoid erroneous quantification (supplemental Fig. S2). In total, 155 proteins fulfilled the requested conditions (supplemental Table S4). From these, 114 proteins showed down-regulation, and 41 were up-regulated in highly metastatic KM12SM cells. A short list of proteins with a fold-change of >2 is shown in Table I.
Table I. Proteins differentially secreted by KM12SM and KM12C CRC cells with at least 2-fold change variation.
MS/MS spectra for those proteins with single peptide entries are shown in supplemental Fig. S2.
| Description | Abreviation | Accession no. | Forward SILAC (heavy KM12SM vs. light KM12C) |
Reverse SILAC (light KM12SM vs. heavy KM12C) |
||||||
|---|---|---|---|---|---|---|---|---|---|---|
| -Fold changea | Mascot score | Coverage | No. of peptides | -Fold changea | Mascot score | Coverage | No. of peptides | |||
| Protein S100-A8 | S100A8 | P05109 | >30 | 833.41 | 53.76 | 8 | >30 | 181.2 | 47.31 | 5 |
| Tumor necrosis factor ligand superfamily member 9 | CD137L/TNFSF9 | P41273 | 27.73 | 397.2 | 31.50 | 6 | 39 | 6.69 | 1 | |
| Podocalyxin-like protein 1 | PODXL | O00592 | 10.89 | 389 | 7.35 | 4 | 19.34 | 158 | 10.57 | 6 |
| Midkine | MDK | P21741 | 12.61 | 50 | 6.99 | 1 | - | 30 | 6.99 | 1 |
| Cathepsin S | CTSS | P25774 | 15.15 | 202 | 13.29 | 4 | 2.77 | 105 | 17.82 | 5 |
| Glutathione S-transferase P | GSTP1 | P09211 | 6.92 | 2728 | 63.33 | 9 | 10.79 | 1660 | 57.14 | 8 |
| Neurosecretory protein VGF | VGF | O15240 | 9.66 | 299 | 8.94 | 6 | 7.22 | 631 | 26.83 | 14 |
| Carcinoembryonic antigen-related cell adhesion molecule 5 | CEACAM5 | P06731 | 8.34 | 598 | 7.55 | 4 | 5.93 | 685 | 12.54 | 7 |
| Growth/differentiation factor 15 | GDF15 | Q99988 | 6.21 | 3096 | 38.96 | 11 | 5.81 | 2493 | 45.78 | 12 |
| Zymogen granule protein 16 homolog B | ZG16B | Q96DA0 | 3.43 | 557 | 29.81 | 5 | 6.40 | 197 | 29.81 | 5 |
| Selenium-binding protein 1 | SELENBP1 | Q13228 | 3.70 | 138 | 13.14 | 5 | 4.49 | 33 | 9.32 | 4 |
| General transcription factor IIF subunit 1 | GTF2F1 | P35269 | 4.90 | 43 | 3.09 | 1 | 3.17 | 44 | 3.09 | 1 |
| General transcription factor II-I | GTF2I | P78347 | 3.03 | 73 | 3.61 | 3 | 4.07 | 46 | 1.70 | 1 |
| Sclerostin domain-containing protein 1 | SOSTDC1 | Q6X4U4 | 3.37 | 51 | 13.59 | 3 | - | - | - | - |
| Protein ETHE1, mitochondrial | ETHE1 | O95571 | 2.22 | 67 | 26.77 | 6 | 4.16 | 33 | 26.77 | 6 |
| Brain-specific serine protease 4 | PRSS22 | Q9GZN4 | 4.30 | 448 | 24.61 | 6 | 1.61 | 176 | 16.09 | 5 |
| Putative maltase-glucoamylase-like protein FLJ16351 | MGAL1 | Q6ZN80 | 2.60 | 42 | 2.94 | 2 | 3.06 | 140 | 11.76 | 6 |
| Fascin | FSCN1 | Q16658 | 2.91 | 138 | 18.26 | 9 | 2.64 | 79 | 10.55 | 5 |
| Proteasome subunit β type-9 | PSMB9 | P28065 | 3.14 | 73 | 8.68 | 2 | 2.16 | 89 | 4.57 | 1 |
| Proteasome subunit β type-8 | PSMB8 | P28062 | 2.23 | 465 | 19.93 | 5 | 2.97 | 214 | 25.00 | 7 |
| Src homology 3 domain-containing kinase-binding protein 1 | SH3KBP1 | Q96B97 | 2.49 | 57 | 1.65 | 1 | 2.66 | 22 | 1.65 | 1 |
| Melanotransferrin | MFI2 | P08582 | 1.92 | 30 | 7.32 | 6 | 3.21 | 140 | 4.07 | 3 |
| YTH domain family protein 2 | YTHDF2 | Q9Y5A9 | 1.98 | 100 | 12.61 | 8 | 2.98 | 30 | 8.81 | 5 |
| V-type proton ATPase subunit B, brain isoform | ATP6V1B2 | P21281 | 1.74 | 142 | 16.44 | 7 | 3.19 | 34 | 7.24 | 3 |
| Endothelial protein C receptor | PROCR | Q9UNN8 | 2.81 | 682 | 14.71 | 3 | 2.07 | 1193 | 26.05 | 5 |
| Ribosyldihydronicotinamide dehydrogenase (quinone) | NQO2 | P16083 | 1.30 | 101 | 19.05 | 3 | 2.97 | 57 | 11.26 | 2 |
| Acyl-protein thioesterase 1 | LYPLA1 | O75608 | 1.57 | 133 | 20.00 | 4 | 2.50 | 48 | 13.91 | 3 |
| Activated RNA polymerase II transcriptional co-activator p15 | SUB1 | P53999 | 0.49 | 97 | 18.90 | 2 | 0.53 | 69 | 18.90 | 2 |
| Adenylate kinase isoenzyme 1 | AK1 | P00568 | 0.52 | 75 | 17.01 | 3 | 0.48 | 153 | 28.35 | 5 |
| 10-kDa heat shock protein, mitochondrial | HSPE1 | P61604 | 0.50 | 867 | 65.69 | 8 | 0.50 | 581 | 57.84 | 7 |
| 39 S ribosomal protein L12, mitochondrial | MRPL12 | P52815 | 0.53 | 116 | 22.73 | 5 | 0.47 | 57 | 18.18 | 4 |
| 3-Hydroxyisobutyrate dehydrogenase, mitochondrial | HIBADH | P31937 | 0.46 | 29 | 3.87 | 1 | 0.54 | 103 | 8.63 | 2 |
| Complement decay-accelerating factor | CD55 | P08174 | 0.51 | 516 | 24.15 | 9 | 0.47 | 393 | 21.78 | 8 |
| tRNA (adenine-N(1)-)-methyltransferase noncatalytic subunit TRM6 | TRMT6 | Q9UJA5 | 0.52 | 21 | 3.82 | 1 | 0.45 | 34 | 3.82 | 1 |
| Synaptogyrin-2 | SYNGR2 | O43760 | 0.47 | 36 | 20.54 | 5 | 0.49 | 41 | 12.50 | 3 |
| Toll-interacting protein | TOLLIP | Q9H0E2 | 0.53 | 63 | 11.68 | 4 | 0.39 | 232 | 24.45 | 6 |
| Endoplasmic reticulum mannosyl-oligosaccharide 1,2-α-mannosidase | MAN1B1 | Q9UKM7 | 0.44 | 27 | 2.72 | 2 | 0.47 | 24 | 6.72 | 4 |
| 78-kDa glucose-regulated protein | HSPA5 | P11021 | 0.41 | 2455 | 43.43 | 26 | 0.49 | 4874 | 21.10 | 11 |
| Solute carrier family 12 member 2 | SLC12A2 | P55011 | 0.49 | 216 | 6.77 | 5 | 0.40 | 105 | 4.13 | 3 |
| Guanine nucleotide-binding protein G(I)/G(S)/G(O) subunit γ12 | GNG12 | Q9UBI6 | 0.48 | 48 | 37.50 | 2 | 0.41 | 182 | 37.50 | 2 |
| Serine/threonine-protein phosphatase PGAM5, mitochondrial | PGAM5 | Q96HS1 | 0.47 | 31 | 7.27 | 2 | 0.40 | 47 | 14.88 | 4 |
| Tax1-binding protein 3 | TAX1BP3 | O14907 | 0.44 | 177 | 25.00 | 2 | 0.41 | 109 | 25.00 | 2 |
| Tetraspanin-8 | TSPAN8 | P19075 | 0.50 | 45 | 4.22 | 1 | 0.35 | 99 | 7.59 | 2 |
| Stomatin-like protein 2 | STOML2 | Q9UJZ1 | 0.48 | 558 | 31.18 | 8 | 0.37 | 752 | 25.28 | 7 |
| Transmembrane emp24 domain-containing protein 9 | TMED9 | Q9BVK6 | 0.42 | 62 | 21.28 | 4 | 0.42 | 170 | 8.51 | 2 |
| Transcription intermediary factor 1-β | TRIM28 | Q13263 | 0.43 | 52 | 6.11 | 5 | 0.41 | 134 | 8.86 | 5 |
| Transmembrane emp24 domain-containing protein 7 | TMED7 | Q9Y3B3 | 0.44 | 29 | 11.16 | 2 | 0.39 | 52 | 14.73 | 3 |
| α-N-acetylgalactosaminide α-2,6-sialyltransferase 1 | ST6GALNAC1 | Q9NSC7 | 0.43 | 25 | 2.83 | 2 | 0.40 | 70 | 4.33 | 2 |
| MARCKS-related protein | MARCKSL1 | P49006 | 0.50 | 149 | 14.36 | 2 | 0.32 | 550 | 14.36 | 2 |
| Ras-related protein Rab-25 | RAB25 | P57735 | 0.46 | 48 | 13.15 | 3 | 0.35 | 297 | 36.62 | 7 |
| Translocon-associated protein subunit δ | SSR4 | P51571 | 0.49 | 220 | 36.42 | 5 | 0.32 | 249 | 36.42 | 5 |
| Cytochrome c oxidase subunit 5A, mitochondrial | COX5A | P20674 | 0.49 | 62 | 16.00 | 2 | 0.32 | 81 | 16.67 | 3 |
| Hydroxymethylglutaryl-CoA synthase, cytoplasmic | HMGCS1 | Q01581 | 0.42 | 39 | 2.50 | 1 | 0.38 | 35 | 2.50 | 1 |
| ADP-ribosylation factor 6 | ARF6 | P62330 | 0.51 | 273 | 26.86 | 4 | 0.29 | 465 | 38.86 | 5 |
| Cytochrome b-c1 complex subunit Rieske, mitochondrial | UQCRFS1 | P47985 | 0.46 | 30 | 8.03 | 2 | 0.33 | 144 | 18.61 | 4 |
| Nephronectin | NPNT | Q6UXI9 | 0.42 | 50 | 7.79 | 4 | 0.37 | 113 | 10.44 | 5 |
| Prohibitin-2 | PHB2 | Q99623 | 0.46 | 592 | 39.13 | 11 | 0.33 | 1359 | 46.82 | 13 |
| CD59 glycoprotein | CD59 | P13987 | 0.51 | 94 | 15.63 | 3 | 0.26 | 140 | 25.00 | 3 |
| Electron transfer flavoprotein subunit α, mitochondrial | ETFA | P13804 | 0.42 | 182 | 27.63 | 7 | 0.34 | 956 | 43.24 | 11 |
| Ras-related protein Rap-2c | RAP2C | Q9Y3L5 | 0.53 | 22 | 16.39 | 3 | 0.24 | 32 | 6.01 | 1 |
| RNA-binding protein Raly | RALY | Q9UKM9 | 0.44 | 40 | 12.75 | 4 | 0.32 | 83 | 26.47 | 7 |
| ATP synthase subunit δ, mitochondrial | ATP5D | P30049 | 0.44 | 248 | 13.69 | 2 | 0.32 | 126 | 13.69 | 2 |
| Sodium/potassium-transporting ATPase subunit β-1 | ATP1B1 | P05026 | 0.50 | 1085 | 28.71 | 8 | 0.25 | 990 | 28.71 | 8 |
| Transmembrane emp24 domain-containing protein 4 | TMED4 | Q7Z7H5 | 0.50 | 66 | 12.33 | 3 | 0.24 | 45 | 8.81 | 2 |
| Laminin subunit α-5 | LAMA5 | O15230 | 0.48 | 294 | 3.25 | 10 | 0.26 | 126 | 1.38 | 4 |
| Cytochrome b-c1 complex subunit 2, mitochondrial | UQCRC2 | P22695 | 0.49 | 70 | 3.53 | 1 | 0.25 | 309 | 32.23 | 10 |
| Syndecan-1 | SDC1 | P18827 | 0.48 | 417 | 16.13 | 5 | 0.24 | 459 | 5.48 | 1 |
| Nucleotide exchange factor SIL1 | SIL1 | Q9H173 | 0.45 | 180 | 13.88 | 6 | 0.27 | 67 | 7.38 | 3 |
| Voltage-dependent anion-selective channel protein 1 | VDAC1 | P21796 | 0.41 | 517 | 30.04 | 7 | 0.30 | 1681 | 65.72 | 15 |
| Neutral α-glucosidase AB | GANAB | Q14697 | 0.44 | 1014 | 27.75 | 24 | 0.27 | 3625 | 20.55 | 20 |
| ADP-ribosylation factor 4 | ARF4 | P18085 | 0.51 | 174 | 17.22 | 3 | 0.19 | 356 | 30.00 | 5 |
| Cytochrome c oxidase subunit 4 isoform 1, mitochondrial | COX4I1 | P13073 | 0.43 | 135 | 18.34 | 3 | 0.26 | 155 | 18.34 | 3 |
| Peroxiredoxin-4 | PRDX4 | Q13162 | 0.51 | 328 | 19.93 | 6 | 0.14 | 276 | 15.87 | 4 |
| Cathepsin D | CTSD | P07339 | 0.32 | 11430 | 52.43 | 21 | 0.25 | 13443 | 55.34 | 25 |
| ATP synthase subunit α, mitochondrial | ATP5A1 | P25705 | 0.35 | 265 | 18.63 | 9 | 0.23 | 1017 | 36.89 | 18 |
| Stromal cell-derived factor 2-like protein 1 | SDF2L1 | Q9HCN8 | 0.30 | 50 | 19.91 | 3 | 0.26 | 49 | 5.88 | 1 |
| Agrin | AGRN | O00468 | 0.33 | 1458 | 9.34 | 16 | 0.21 | 2556 | 9.19 | 16 |
| Ephrin type-A receptor 4 | EPHA4 | P54764 | 0.37 | 42 | 2.64 | 3 | 0.16 | 119 | 5.48 | 4 |
| Peptidyl-prolyl cis-trans isomerase C | PPIC | P45877 | 0.30 | 451 | 16.51 | 4 | 0.18 | 698 | 17.45 | 4 |
| Trifunctional enzyme subunit β, mitochondrial | HADHB | P55084 | 0.35 | 26 | 5.91 | 3 | 0.13 | 76 | 5.70 | 3 |
| 45-kDa calcium-binding protein | SDF4 | Q9BRK5 | 0.31 | 1060 | 30.39 | 10 | 0.16 | 361 | 16.57 | 6 |
| CD81 antigen | CD81 | P60033 | 0.17 | 61 | 15.25 | 2 | 0.28 | 33 | 15.25 | 2 |
| β-1,3-N-acetylglucosaminyltransferase lunatic fringe | LFNG | Q8NES3 | 0.24 | 155 | 7.12 | 3 | 0.18 | 231 | 4.75 | 2 |
| Insulin-like growth factor-binding protein 2 | IGFBP2 | P18065 | 0.24 | 7408 | 58.15 | 17 | 0.17 | 6878 | 59.38 | 16 |
| Kallikrein-6 | KLK6 | Q92876 | 0.22 | 615 | 40.98 | 8 | 0.16 | 534 | 33.61 | 7 |
| Lactadherin | MFGE8 | Q08431 | 0.26 | 106 | 18.60 | 6 | 0.11 | 373 | 23.00 | 8 |
| Integrin β-4 | ITGB4 | P16144 | 0.23 | 42 | 2.69 | 5 | 0.14 | 54 | 1.10 | 2 |
| UPF0556 protein C19orf10 | C19orf10 | Q969H8 | 0.22 | 953 | 30.06 | 7 | 0.13 | 827 | 27.17 | 5 |
| Lumican | LUM | P51884 | 0.20 | 35 | 8.58 | 3 | 0.12 | 50 | 14.79 | 5 |
| Integrin α-6 | ITGA6 | P23229 | 0.17 | 570 | 15.93 | 15 | 0.15 | 1155 | 17.17 | 17 |
| Laminin subunit γ-1 | LAMC1 | P11047 | 0.22 | 946 | 23.74 | 33 | 0.09 | 1014 | 11.25 | 15 |
| Ephrin-A3 | EFNA3 | P52797 | 0.12 | 43 | 6.72 | 1 | 0.19 | 118 | 6.72 | 1 |
| Neuroserpin | SERPINI1 | Q99574 | 0.15 | 97 | 20.98 | 8 | 0.13 | 143 | 23.66 | 11 |
| Mesencephalic astrocyte-derived neurotrophic factor | MANF | P55145 | 0.16 | 256 | 43.02 | 10 | 0.12 | 463 | 53.63 | 12 |
| Chitinase domain-containing protein 1 | CHID1 | Q9BWS9 | 0.18 | 64 | 13.74 | 5 | 0.09 | 70 | 10.69 | 4 |
| Interstitial collagenase | MMP1 | P03956 | 0.14 | 79 | 15.35 | 7 | 0.13 | 209 | 18.98 | 9 |
| Kallikrein-10 | KLK10 | O43240 | 0.10 | 472 | 23.55 | 5 | 0.10 | 921 | 30.07 | 7 |
| Neogenin | NEO1 | Q92859 | 0.04 | 339 | 16.50 | 17 | 0.02 | 234 | 12.32 | 15 |
a Ratios among proteins in the heavy and light versions were used as fold-change.
Validation, Gene Ontology Analysis, and Location of Deregulated Proteins
Eight differentially expressed candidates (five up-regulated and three down-regulated) with available antibodies were selected for initial validation using Western blot analyses in concentrated supernatants (Fig. 2). Western blot results were consistent with the MS quantification data. The MS spectra of representative peptides are shown in Fig. 2. Unaltered Rho-GDI was used as a control.
Fig. 2.

Validation of identified and quantified proteins. Conditioned media of KM12C and KM12SM CRC cells were concentrated using Vivaspin 500 centrifugal devices, separated by SDS-PAGE, transferred to nitrocellulose membranes, and probed with the indicated antibodies. Rho GDI was used as a control. Protein abundance was quantified by densitometry, and KM12SM/KM12C ratios were calculated to compare the expression with the SILAC ratios. The MS spectrum for each of the verified proteins is shown, including identified peptide sequence and heavy/light ratios for the corresponding peptides.
According to Gene Ontology analysis, secreted proteins represented 9% of the total number of quantified proteins, plasma membrane proteins (14%), nuclear (18%), and cytoplasmic protein (52%) (Fig. 3A). However, to elucidate if proteins could use alternative secretion pathways, each protein was analyzed with SecretomeP. Remarkably, 53 out of 155 proteins showed an NN-score of >0.5, which predicts nonsignal peptide-triggered protein secretion and correlates with a nonclassical protein secretion pathway (supplemental Table S5 and Fig. 3B). Thus, a total of 80 out of 155 were potentially secreted proteins via different pathways. In addition, to analyze if quantified proteins could be present in exosomes, we used the Exocarta database, which contains proteins identified in exosomes via proteomic analyses. Eighty eight out of 155 proteins had been previously identified in exosomes (supplemental Table S6), including 31 out of 53 alternatively secreted proteins according to SecretomeP. Finally, we analyzed if quantified proteins were also identified in a previous study related to the differential protein expression on the cell surface of KM12 cells (17). We found 19 secreted proteins previously identified in the membrane-associated fraction of KM12 cells (data not shown). Therefore, more than 50% of the proteins could be associated with exosomes, and 12% could be cleaved from membranes.
Fig. 3.

Analysis of the location and secretion of quantified proteins. A, location analysis of the differentially secreted proteins was based on Gene Ontology. B, secretion analysis of the 154 differentially expressed protein. Nonclassical secretion data were obtained using the SecretomeP and the SignalP software. Those proteins that showed an NN-score of >0.5 and did not contain signal peptide were considered as secreted proteins using nonconventional secretion.
Biological Function, Pathway Analysis, and Interaction Networks for Deregulated Proteins
To identify altered biological functions and pathways that might play a role in CRC metastasis, differentially secreted proteins from KM12SM and KM12C cells were analyzed using IPA (Table II). Within biological functions, “Cancer” was the top altered function (n = 72 proteins and p values ranging from 9.44E-08 to 2.87E-02) followed by “Gastrointestinal Disease” (n = 41 proteins) and “Neurological Disease” (n = 42 proteins), with p values <2.56E-02. Regarding molecular and cellular functions, the analysis revealed the following: (i) “Cellular Movement” (n = 43 proteins); (ii) “Cell Death” (n = 61 proteins); (iii) “Cell Morphology” (n = 31 proteins), and (iv) “Cellular Assembly and Organization” (n = 31 proteins); most of them are necessary to confer metastatic properties to the KM12SM cells. We also found 42, 29, and 11 proteins associated with “Tissue Development,” “Organ Morphology,” and “Tumor Morphology,” respectively, involved in the “Physiological System Development and Function.” Regarding the most represented canonical pathways among the 155 differentially released proteins, the top five canonical pathways were as follows: (i) “Ephrin Receptor Signaling” (p value 2.08E-05); (ii) “Integrin Signaling” (p value 3.31E-04); (iii) “Oxidative Phosphorylation” (p value 4.23E-04); (iv) “Clathrin-mediated Endocytosis Signaling” (p value 1.19E-03), and (v) “Mitochondrial Dysfunction” (p value 2.25E-03).
Table II. Ingenuity pathway analysis-predicted top biological functions.
| Top biological functions | p values (ranging from)a | No. of moleculesb |
|---|---|---|
| Diseases and disorders | ||
| Cancer | 9.44E-08 to 2.87E-02 | 72 |
| Gastrointestinal disease | 9.44E-08 to 2.58E-02 | 41 |
| Neurological disease | 1.10E-06 to 2.56E-02 | 42 |
| Psychological disease | 1.10E-06 to 1.72E-02 | 20 |
| Dermatological diseases and conditions | 2.57E-05 to 2.84E-02 | 30 |
| Molecular and cellular functions | ||
| Cellular movement | 6.94E-07 to 2.56E-02 | 43 |
| Cell death | 7.97E-06 to 2.90E-02 | 61 |
| Cell morphology | 8.87E-06 to 2.91E-02 | 31 |
| Cellular assembly and organization | 8.87E-06 to 2.57E-02 | 31 |
| Nucleic acid metabolism | 7.19E-05 to 2.56E-02 | 7 |
| Physiological system development and function | ||
| Renal and urological system development and function | 1.55E-04 to 2.04E-02 | 13 |
| Organ morphology | 1.55E-04 to 2.04E-02 | 29 |
| Tissue development | 2.58E-04 to 2.04E-02 | 42 |
| Tumor morphology | 2.58E-04 to 2.54E-02 | 11 |
| Cardiovascular system development and function | 2.58E-04 to 2.54E-02 | 21 |
a Fisher's exact test was used to calculate a p value for each protein of the dataset identified in the biological function studied, indicating the probability that each biological function assigned to the data set is assigned by chance; then we have a range of p values corresponding to all p values calculated for all proteins of the dataset in the biological function.
b The number of molecules of the 155 differentially released protein dataset is shown.
IPA analysis also indicated the most relevant associated network functions (score >46) as follows: (i) “Nucleic Acid Metabolism, Small Molecule Biochemistry, Protein Synthesis.” We observed a down-regulation of several members of the ADP-ribosylation factor (ARF) family of proteins that have been related to tumor suppression (35), vesicular trafficking, microvesicle/exosome formation, and signaling pathways that lead to actin remodeling (supplemental Fig. S3). (ii) “Cellular Movement, Cancer, Gastrointestinal Disease” included CD137L/TNFSF9, PODXL, GDF15, EFNA3, and LUM among others (Fig. 4A). (iii) “Post-translational Modification, Cell to Cell Signaling and Interaction” contained CTSS, MDK, VGF, etc. (Fig. 4B); and (iv) “Cell Death, Inflammatory Response, Cellular Growth, and Proliferation” (SH3KBP1). In addition, we analyzed the interactions between the identified proteins and relevant biological functions using STRING (32). Using MCL algorithm (value 2), we defined 21 clusters containing three or more proteins (supplemental Fig. S4). Results were coincident with IPA analysis. Among several small clusters, there was a large cluster composed of 13 proteins related with cell adhesion and migration (composed of ITGA6, ITGB4, LAMA5, LAMC1, PODXL, and THBS2 among others). Gene Ontology analysis of this subset of proteins revealed a significant association to cell-substrate junction assembly (p value 1.02E-04) or hemidesmosome assembly (p value 5.74 E-04). A smaller cluster of proteins included MDK, syndecan-1, syndecan-binding protein, MMP1, and LUM, all of them related to extracellular matrix organization. Collectively, these analyses revealed a high association of the differentially released proteins with cellular movement, cell-cell signaling, growth, and proliferation necessary for tumor growth and cancer metastasis.
Fig. 4.
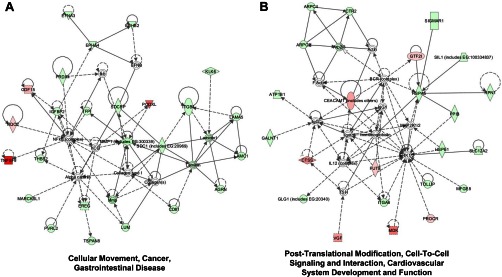
Network alterations associated with secreted proteins in colorectal cancer metastasis. Protein networks were identified by IPA using the 154 differentially released proteins identified in the study. A, Cellular Movement, Cancer and Gastrointestinal Disease Network was identified with a score of 51. The network consisted of 24 up-regulated and four down-regulated proteins from a total of 35 interacting proteins, with seven proteins unidentified by SILAC. B, Post-Translational Modification, Cell-To-Cell Signaling and Interaction, Cardiovascular System Development, and Function Network were identified with a score of 46. The network consisted of 17 up-regulated and seven down-regulated proteins from a total of 34 proteins, and 10 proteins of the network remained unidentified. Green, down-regulated proteins in KM12SM cells. Red, up-regulated proteins in KM12SM cells. White, nondetected proteins. Light color, less deregulated. Dark color, more deregulated.
GDF15, S100A8/A9, and SERPINI1 Are Candidate Biomarkers for Colorectal Cancer Diagnosis
One of the goals of this study was to identify proteins deregulated in the KM12SM metastatic cell line that could be used in human serum as CRC biomarkers. We tested and quantified the presence in serum from CRC patients in comparison with the healthy controls of nine deregulated proteins (GDF15, S100A8/A9, VGF, SERPINI1, NEO1, PODXL, LUM, SOSTDC1, and ZG16B) using commercially available ELISAs. GDF15 was used as a control because it has been already described as a good candidate for the CRC diagnostic marker in serum (23, 36, 37). Using 60 serum samples (40 cancer and 20 healthy), levels in serum for S100A8/A9 (849.3 versus 228.8 ng/ml), GDF15 (10.9 versus 5.4 pg/ml), and SERPINI1 (38.2 versus 4.8 ng/ml) significantly discriminated patients from controls samples (Fig. 5A). We determined sensitivity and specificity of these candidate biomarkers using ROC curves. Individual AUCs for discriminating CRC from controls were 0.75, 0.81, and 0.82 for S100A8/A9, GDF15, and SERPINI1, respectively (Fig. 5B). Combined AUC for S100A8/A9, SERPINI1, and GDF15 increased the sensitivity and specificity to 60 and 95%, respectively, with an AUC of 0.884 (Fig. 5C). These results confirm the predictive value of SERPINI1, which can be improved in terms of sensitivity and specificity in combination with GDF15 and S100A8/A9. Using commercial ELISAs, none of the other tested antigens was able to discriminate between patients and controls (data not shown).
Fig. 5.

Diagnostic value of S100A8/A9, GDF15, and SERPINI1 in serum samples. A, S100A8/A9, GDF15, and SERPINI1 were assayed by ELISA using 60 serum samples (40 from CRC and 20 from healthy individuals) at 1:50, 1:20, and 1:10 dilution, respectively. Data are represented in dot plots depicting the smallest observation (sample minimum), lower quartile (Q1), median (Q2), upper quartile (Q3), and largest observation (sample maximum). Horizontal bar in the box plot represents the median of the ELISA values data set. B, specificity and sensitivity were calculated using ROC curves for each marker. AUC is indicated. C, ROC curve was calculated for the combinations of the three markers.
Differentially Secreted Proteins Play a Major Role in Cell Adhesion, Migration, and Invasion of KM12SM Metastatic Cells
To study their role in proliferation, invasion, and metastasis, we carried out a functional analysis of 14 top up- or down-regulated proteins in highly metastatic KM12SM cells. We used either siRNA silencing or antibody blocking experiments, depending on which reagent was available for that particular gene/protein. The efficiency of siRNA down-regulation on the different targets was confirmed by PCR and Western blot analyses (supplemental Fig. S5). Regarding proliferation, siRNA inhibition of CD137L/TNFSF9 and CTSS showed a significant reduction in proliferation (Fig. 6A). At the antibody level, we confirmed the results of CD137L/TNFSF9 with the addition of LUM. In contrast, a small but significant increase in proliferation was observed after NEO1 inhibition. At the adhesion level, a >3-fold reduction in adhesion capacity was observed after NEO1-, SERPINI1-, and PODXL-silencing with siRNA and antibody blocking (Fig. 6B). A clear inhibition of migration was observed for ZG16B, CD137L, and EFNA3, followed by CTSS and SOSTDC1 using siRNA or antibody blocking (Fig. 6C). Finally, regarding invasion, a critical step for metastasis, ZG16B, CTSS, CD137L, and EFNA3, together with MDK and SOSTDC1, caused a significant reduction in the invasion ability after siRNA silencing (Fig. 6D). After antibody blocking, a strong reduction was observed for CD137L/TNFSF9, CTSS, and SOSTDC1. In conclusion, we observed an important role for ZG16B, CD137L/TNFSF9, CTSS, SOSTDC1, and EFNA3 in migration and invasion and MDK only in invasion of metastatic cells. NEO1, SERPINI1, and PODXL appeared to play a significant role in cellular adhesion.
Fig. 6.

In vitro functional studies to determine the effect of differentially released protein in CRC metastasis. Adhesion, migration, invasion, and proliferation assays were performed with KM12SM CRC cells to study the effect of siRNAS or blocking antibodies against indicated targets on CRC metastasis. Experiments were performed three times, with consistent results. Error bar, standard deviation. (*, p < 0.05; **, p < 0.01; ***, p < 0.001.) A, adhesion assays were performed after 48 h of transfection of KM12SM cells with siRNAs directed against the indicated targets and, alternatively, with blocking antibodies using parental KM12SM cells. B–D, migration, invasion, and proliferation assays, respectively, were performed 24 h after transfection of KM12SM cells with siRNAs directed against the indicated targets and, alternatively, with blocking antibodies using parental KM12SM cells.
SOSTDC1, CD137L/TNFSF9, and EFNA3 Play a Major Role in Liver Homing
Colonization of distant organs is the final and critical step in metastasis. To determine the liver homing capacity of the invasion panel proteins, we carried out in vivo experiments using Swiss nude mice. Livers were collected 24 h after intrasplenic injection of transiently transfected KM12SM metastatic cells, and RNA was extracted to amplify human GAPDH by PCR (Fig. 7). Human GAPDH was detected at a similar extent in livers from mice inoculated with cells transiently silenced with ZG16B, CTSS, and MDK, parental cells (KM12SM), and control siRNA. KM12SM transfected with siRNA control behaved equally to parental KM12SM cells. However, PCR amplification resulted in a barely or nondetectable band in mice inoculated with silenced cells corresponding to SOSTDC1, CD137L/TNFSF9, and EFNA3. Therefore, these three proteins seem to be critical for liver homing and metastatic colonization in colorectal cancer.
Fig. 7.
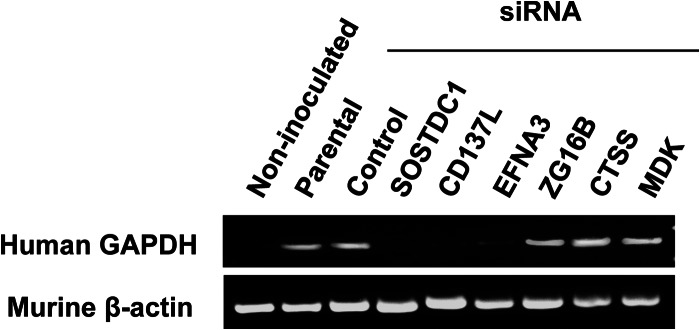
SOSTDC1, CD137L, or EFNA3 silencing suppresses liver metastasis in KM12SM cells. Nude mice were inoculated intrasplenically with KM12SM cells transfected with the indicated siRNAs and were sacrificed 24 h after injection. RNA was isolated from the liver and subjected to RT-PCR to amplify human GAPDH. A representative experiment out of three is shown. Murine β-actin was amplified as loading control.
Prognostic Value of the Invasion Panel
To evaluate the prognostic value of those proteins that showed a significant effect of migration, invasion, and liver homing, we carried out a meta-analysis of association to overall survival (OS) using publicly available genomic data on colorectal adenocarcinoma using the cBio Cancer Genomics Portal (33). We used mRNA expression data sets, with a z-score threshold ± 2.0, for a total of 274 colorectal cancer samples analyzed in the database. Using Kaplan-Meier analysis of OS based on the median mRNA expression levels, we investigated the prognostic value of each protein (CD137L/TNFSF9, CTSS, SOSTDC1, ZG16B, EFNA3, and MDK) and their different combinations, including the whole six protein panel. Combinations of two and three proteins showed significant association with prognosis (data not shown), but the six-protein panel displayed the most significant association with OS (log-rank test p value = 0.030), where 46 patients from a total of 274 showed alterations in this gene signature (Fig. 8A). Then we evaluated if these panels could be extended to other tumor types (Fig. 8, B–D). The association with OS for breast cancer, glioblastoma, and lung adenocarcinoma did not deliver significant p values (log-rank test p value of >0.48) after analyzing the same six gene combinations (Fig. 8, B–D), respectively. Moreover, we also tested this panel signature in other available gene datasets, i.e. kidney, ovarian, bladder, and prostate cancer, without observing significant association with prognosis (data not shown). In summary, the invasion panel composed of six proteins might constitute a molecular signature for poor prognosis in colorectal cancer.
Fig. 8.

Prognostic role of CD137L, CTSS, SOSTDC1, ZG16B, EFNA3, and MDK at mRNA level in colorectal cancer and other tumors. A, using cBioCancer Genomics Portal database, Kaplan-Meier estimates of survival showed that patients with alterations in the six-gene invasion panel had worse overall survival than those without alterations (log-rank test p: 0.03). B–D, no significant association with overall survival of the six protein invasion panel was obtained for breast cancer, glioblastoma, and lung cancer, respectively.
DISCUSSION
The use of high accuracy and sensitivity mass spectrometry combined with SILAC labeling for the comparison of the conditioned medium from highly metastatic KM12SM cells with poorly metastatic KM12C cells enabled the discovery of a large number of differentially secreted proteins associated with metastasis in colon cancer. Among them, three proteins (SERPINI1, GDF15, and S100A8/A9) showed potential as candidate biomarkers for CRC diagnosis. Other proteins like CD137L/TNFSF9, CTSS, SOSTDC1, EFNA3, ZG16B, and MDK revealed a role in cell adhesion and/or invasion, which suggest a pro-oncogenic and pro-metastatic property for these molecules. Furthermore, SOSTDC1, CD137L/TNFSF9, and EFNA3 appeared to be relevant in liver homing. The panel of six proteins showed association with poor prognosis in colorectal cancer after database analysis. However, this association presents some limitations that must be acknowledged. The TCGA colon cancer dataset includes all different stages coming from different sites of origin, composing a heterogeneous group that might not be the most representative for survival studies. Because the results are based on a single study dataset, they should be reanalyzed for confirmation using much larger numbers of patients with similar distributions between both groups.
We performed a preliminary comparison of our results with two recent reports aiming to identify differentially expressed proteins in SW480/SW620 metastatic colorectal cancer cells that used iTRAQ labeling of the whole cell proteome (22) or label-free analysis of the secretome (23), respectively. A few of the short-listed proteins (Table I) were coincident with the iTRAQ study, i.e. Calcyclin-binding protein and myristoylated alanine-rich protein kinase C substrate. Regarding the label-free analysis, we found a common protein GDF15 and two proteins AGR3 and IGFBP2 similar to AGR2 and IGFBP7. There could be several reasons to explain this relatively low level of coincidence, apart from being different cell lines from different patients. First, the KM12SM cell line shows a more pronounced liver tropism than SW620. Second, we used conditioned media and SDS-PAGE fractionation instead of the whole proteome used for iTRAQ labeling or unfractionated conditioned media used for label-free. Third, we used SILAC instead of iTRAQ labeling or label-free. Fourth, different software was used for quantification. However, the similarities found in this work should contribute to settle down specific and commonly altered proteins in colon cancer metastasis.
Many of the identified proteins were initially classified as nonsecreted, but further in silico analysis revealed that they could use nonconventional secretion pathways. Similar findings were described for the secretome of prostate or pancreatic cancer cell lines (38, 39). There might be several reasons to explain the presence of these proteins. They could be exosomal proteins, proteins cleaved from plasma membrane, or proteins derived from cellular breakage. After analysis with ExoCarta database, we found that more than 50% of the proteins had been previously observed in human exosomes. In addition, about 12% were proteins previously associated with the plasma membrane proteome of KM12 cells (17). A currently extended hypothesis proposes a key role for tumor-derived exosomes and shedding vesicles in tumor progression (40–43). Some of the quantified growth factors and cytokines that have been found in exosomes might help to form the premetastatic niche; indeed some proteins like S100A8/A9 or MMP1 were associated with colonization of other organs (44). MMPs, especially S100A8/A9, induce inflammation-related pathways in the tumor microenvironment, which are necessary for premetastatic niche formation (44, 45).
One goal of our study was to investigate the potential use of differentially released proteins as CRC diagnostic biomarkers in serum. Although these biomarkers were obtained from comparing metastatic versus nonmetastatic cells, we checked their utility for a general screening using serum from patients at different stages of progression. After testing nine different proteins, only S100A8/A9, GDF15, and SERPINI1 showed the ability to discriminate CRC patients from controls. GDF15, also known as macrophage inhibitory cytokine 1 (MIC1), has been previously described as a serum biomarker for colon and pancreatic cancer in different studies (23, 36–38), and S100A8/A9 was proposed as serological and tissue marker for colorectal cancer (46). The observed AUC values for individual GDF15 were similar to those previously reported (23). No AUCs were available for S100A8/A9 in colon cancer. We found that SERPINI1 also gives a significant level of discrimination in serum. No association to CRC was previously reported for SERPINI1, which has been associated with acute ischemic stroke (47) in serum. The combination of these three proteins, GDF15, S100A8/A9, and SERPINI1, improved significantly their individual ability as a biomarker giving an AUC of 0.884, with a sensitivity of 60% at 95% specificity. The levels of specificity and sensitivity were promising for colon cancer screening.
Overall, the proteomic profile found in the secretome provides important clues about the different adhesion and invasive properties of KM12SM cells, which might be associated with the metastatic process to liver. After data mining, we have observed that EFNA3, ZG16B, MDK, CTSS, CD137L/TNFSF9, and SOSTDC1 share common regulatory pathways involved in cell motility (migration and invasion), adhesion, and proliferation. A schematic depicting the common regulatory pathways is shown in Fig. 9. Among the most common altered pathways, we found PI3K, Src, and MAPK as main actors in the processes of migration and invasion, as well as α2β1 integrin as a mediator of adhesion. Collectively, these proteins seem to activate the PI3K signaling pathway responsible for the higher migration and invasion properties of KM12SM cells in comparison with KM12C cells.
Fig. 9.

Common regulatory pathways associated with the proteins identified in this study. A, proteins involved in the different processes. In black, proteins that promote these processes are shown, and in red proteins that inhibit them are shown. B, pathways affected by the proteins regulating cell adhesion, migration, invasion, or proliferation (from left to right and top to bottom). EFNA3 binds and activates EphA receptors (75); these receptors trigger activation of PI3K and Src (72) and inhibit MAPK (73). CTSS increases expression of MET, EGFR, ITGA2, and MMP3 (54). In turn, MET activates PI3K (76); ITGA2 activates MAPK (77), and both molecules are also activated by EGFR (78). SERPINI1 is an inhibitor of tissue plasminogen activator (tPA) (57), which inhibits ITGB1 (79). TNFSF9 triggers activation of PI3K and Src (61). PODXL promotes ITGB1-mediated cell adhesion (48). NEO1 is a receptor of Netrin, which also binds ITGB1 (80), inducing a collaborative signaling that enhances cell adhesion (51). NEO1 also inhibits focal adhesion kinase (FAK) activation, which is an activator of Ras (81). SOSTDC1, also known as USAG1, is an inhibitor of several BMPs (82). BMP4 inhibits activation of MMP9 (83), whose expression is inhibited by BMP2 (84), which also reduces PTEN expression (85). Midkine binds to ITGB1 (60), inducing ITGB1/TSPAN1 interaction that activates STAT1, which in turn promotes expression of MMP2 and MMP26 (86). ZG16B increases CXCR4 expression (66), which can stimulate PI3K (65).
Podocalyxin-like 1 (PODXL), one of the most up-regulated proteins in highly metastatic cells, co-localizes with β1 integrin and enhances adhesion, migration, and intercellular communication in endothelial cells (48). Overexpression of PODXL has been observed in several cancers (prostate, breast, brain, testicular, and hepatocellular and renal cell carcinoma) and was associated with poor prognosis in colorectal cancer (49). It also plays a role in epithelial-mesenchymal transition, promoting the acquisition of a motile phenotype (50). However, only effects on adhesion but not in migration or invasion were observed in metastatic KM12SM cells. Down-regulated neogenin (NEO1) displays identical secondary structure to, and is a homolog to, DCC (51). The precise biological function of DCC is quite unknown, although it was initially described as a suppressor gene and biomarker for colorectal cancer progression. After NEO1 deletion with siRNA silencing or antibody blocking, we noticed a significant decrease in cell adhesion to Matrigel of KM12SM cells, together with a minor but significant increase of cell proliferation. These results, combined with the down-regulation of NEO1 expression in metastatic cells, might support a role for NEO1 as a suppressor in colon cancer metastasis. DCC has been shown to increase cell-cell adhesion in the loss of the cell-matrix interaction (52), in agreement with our observations regarding NEO1 effects on cell-matrix interaction.
Proteases are highly relevant in invasion and metastasis by conditioning the extracellular matrix. Several proteases were up-regulated in KM12SM cells (CTSS and BSSP-4/PRSS2) and others were down-regulated (SERPINI1, KLK6, KLK10, MMP1, and cathepsin D). Blocking of cathepsin S (CTSS) activity appears to block cell migration and, more importantly, invasion, confirming a previous report on the role of CTSS in colorectal cancer invasion and angiogenesis (53). In gastric cancer, CTSS up-regulates the expression of CXCL16, MET, and EGFR, producing the downstream activation of PI3K/AKT and MAPK (54). Serpins are known to block CTSS protease action (55). Up-regulated BSSP-4/PRSS2, a serine protease expressed in airway epithelial cells, is involved in the urokinase plasminogen activator system (56). This suggests a direct relation between the up-regulation of CTSS and BSSP-4 and the down-regulation of SERPINI1. Neuroserpin (SERPINI1) is a secreted protease that inhibits tissue-type plasminogen activator and plasmin (57). SERPINI1 silencing and blocking showed an important decrease in KM12SM cells adhesion. Therefore, SERPINI1 silencing could avoid plasmin inhibition, facilitating the degradation of extracellular matrix components and weakening adhesion. Plasmin activates VEGF, TGFβ, or FGF2.
Midkine (MDK) was up-regulated in KM12SM cells and enhanced the invasion properties of KM12SM cells. MDK is a secreted growth factor, which has been reported as overexpressed in different types of cancers, including colorectal cancer (58). Midkine was found to enhance the migration and invasion of primary desmoid tumor cell cultures (59). β1 integrin works as a functional receptor for MDK, mediating its effects (Fig. 9) (60). Up-regulated CD137L, also known as TNFSF9 or 4-1BBL, is a membrane receptor protein that belongs to the tumor necrosis factor (TNF) ligand family. This cytokine seems to be involved in cell adhesion and proliferation of myeloid cells (61). This effect was blocked by Src and PI3K inhibitors. Its expression was previously observed in colorectal cancer (62), but its origin or its effect on cancer cell signaling was unknown. Silencing and blocking experiments demonstrated a clear role in migration, invasion, liver homing, and poor prognosis in colon cancer that deserves further research. Up-regulated ZG16B, also known as pancreatic adenocarcinoma up-regulated factor (63), is a secreted mammalian lectin. In pancreatic cancer, ZG16B promotes metastasis by regulating TLR2/CXCR4 activation (64). CXCR4 regulates the effects on migration and invasion by activation of PI3K (65). Recently, pancreatic adenocarcinoma up-regulated factor/ZG16B has been shown to promote angiogenesis and migration of endothelial cells, resulting in increased vascular permeability (66). ZG16B silencing experiments demonstrated a significant reduction of migration and invasion in KM12SM cells. Both CD137L and ZG16B share a common capacity for activation of Toll-like receptors and TNF induction, and both are related to inflammation development. Thus, CD137L/TNFSF9 and ZG16B might play a role in the maintenance of the inflammatory state within cancer tissue. CD137L/TNFSF9 appears to be required for TLR4-induced activation of transcription factors CREB and CCAAT/enhancer-binding protein (a late event) (67). CREB regulates, among others, the synthesis of many neuropeptides, including VGF. This might explain the alterations in some neuropeptides, i.e. VGF or mesencephalic astrocyte-derived neurotrophic factor. VGF (non-acronymic), up-regulated by nerve growth factor, is a neuroendocrine-specific protein, which was first isolated from a rat pheochromocytoma (68). No association with intestinal cells or colon cancer has been previously reported. Our observation could be related to the strong relationship between intestinal cells and the enteric nervous system.
Another up-regulated protein, SOSTDC1 (sclerostin domain containing protein 1, also known as USAG1 or ectodin), functions as antagonist of bone morphogenetic proteins (BMP) and Wnt signaling (69). In renal cancer, SOSTDC1 suppressed BMP-7-induced phosphorylation of Smad-1, -5, and -8 and Wnt-3a signaling, reducing proliferation (70). In metastatic cells, silencing of SOSTDC1 reduced migration, invasion, and liver homing. Finally, EFNA3 is a relatively uncharacterized member of the ephrin family, without previous association to colorectal cancer. The receptor EphA4 was also down-regulated in KM12SM cells (Table I). EphA receptors and ephrins have been shown to affect the growth, migration, and invasion of cancer cells in culture as well as tumor growth, invasiveness, angiogenesis, and metastasis in vivo (71). This action was mediated by PI3K and Src (72) or MAPK (73). In the nervous system, EphA4 and EFNA3 inhibit β1 integrin signaling activity (74). Silencing of EFNA3 reduced migration, invasion, and homing in KM12SM metastatic cells. However, the fact that EFNA3 was down-regulated in KM12SM, but silencing also decreased homing, discards a possible role as metastasis suppressor, suggesting that its effects might be indirectly mediated.
To summarize, this unbiased proteome-wide approach of the secretome of KM12 cells identified a large number of novel proteins that seem to play a major role in metastasis of colorectal cancer. Further studies must be performed to determine whether they might become new targets for therapeutic intervention in colorectal cancer.
Supplementary Material
Acknowledgments
We thank Gonzalo Gómez-López for bioinformatics support and Francisco Garcia-Tabares and Tamar San Hipolito-Martín for technical assistance.
Footnotes
* This work was supported in part by Grant BIO2009-08818 from the Spanish Ministry of Science and Innovation, a grant to establish research groups (Asociación Española Contra el Cáncer), and Grant S2011/BMD-2344, Colomics2 from Comunidad de Madrid.
 This article contains supplemental material.
1 The abbreviations used are:
- CRC
- colorectal cancer
- AGR2
- anterior gradient 2 homolog
- AGR3
- anterior gradient 3 homolog
- ARF4
- ADP-ribosylation factor 4
- ARF5
- ADP-ribosylation factor 5
- BMP
- bone morphogenetic proteins
- BSSP-4/PRSS22
- brain-specific serine protease 4
- CA125
- cancer antigen 125
- CD137L/TNFSF9
- tumor necrosis factor ligand superfamily member 9
- CREB
- cAMP-responsive element-binding protein
- CTSS
- cathepsin S
- CXCR4
- chemokine (CXC motif) receptor 4
- DCC
- deleted in colorectal carcinoma
- EFNA3
- ephrin-A3
- EphA4
- ephrin type-A receptor 4
- FGF2
- fibroblast growth factor 2
- GDF15
- growth/differentiation factor 15
- IGFBP2
- insulin-like growth factor-binding protein 2
- IGFBP7
- insulin-like growth factor-binding protein 7
- IL-13
- interleukin 13
- IL13Rα2
- interleukin 13 receptor α2
- IPA
- ingenuity pathway analysis
- ITGA6
- integrin α-6
- ITGB4
- integrin β-4
- iTRAQ
- isobaric tag for relative and absolute quantification
- KLK10
- kallikrein-10
- KLK6
- kallikrein-6
- LAMA5
- laminin subunit α-5
- LAMC1
- laminin subunit γ-1
- LUM
- lumican
- MDK
- Midkine
- MMP1
- interstitial collagenase
- NEO1
- neogenin
- OS
- overall survival
- PODXL
- podocalyxin-like protein 1
- S100A8/9
- S100 calcium-binding protein A8/A9
- SERPINI1
- neuroserpin
- SH3KBP1
- Src homology 3 domain-containing kinase-binding protein 1
- SILAC
- stable isotope labeling by amino acids in cell culture
- SOSTDC1
- sclerostin domain-containing protein 1
- THBS2
- thrombospondin 2
- TLR2
- Toll-like receptor 2
- TRAF1
- TNF receptor-associated factor 1
- TRAF2
- TNF receptor-associated factor 2
- VGF
- neurosecretory protein VGF
- ZG16B
- zymogen granule protein 16 homolog B
- ROC
- receiver operating characteristic
- AUC
- area under the curve
- EGFR
- EGF receptor
- PSM
- peptide spectrum match.
REFERENCES
- 1. Locker G. Y., Hamilton S., Harris J., Jessup J. M., Kemeny N., Macdonald J. S., Somerfield M. R., Hayes D. F., Bast R. C., Jr. (2006) ASCO 2006 update of recommendations for the use of tumor markers in gastrointestinal cancer. J. Clin. Oncol. 24, 5313–5327 [DOI] [PubMed] [Google Scholar]
- 2. Duffy M. J., van Dalen A., Haglund C., Hansson L., Holinski-Feder E., Klapdor R., Lamerz R., Peltomaki P., Sturgeon C., Topolcan O. (2007) Tumour markers in colorectal cancer: European Group on Tumour Markers (EGTM) guidelines for clinical use. Eur. J. Cancer 43, 1348–1360 [DOI] [PubMed] [Google Scholar]
- 3. Babel I., Barderas R., Díaz-Uriarte R., Martínez-Torrecuadrada J. L., Sánchez-Carbayo M., Casal J. I. (2009) Identification of tumor-associated autoantigens for the diagnosis of colorectal cancer in serum using high density protein microarrays. Mol. Cell. Proteomics 8, 2382–2395 [DOI] [PMC free article] [PubMed] [Google Scholar]
- 4. Babel I., Barderas R., Diaz-Uriarte R., Moreno V., Suarez A., Fernandez-Acenero M. J., Salazar R., Capella G., Casal J. I. (2011) Identification of MST1/STK4 and SULF1 proteins as autoantibody targets for the diagnosis of colorectal cancer by using phage microarrays. Mol. Cell. Proteomics 10, M110.001784. [DOI] [PMC free article] [PubMed] [Google Scholar]
- 5. Hundt S., Haug U., Brenner H. (2007) Blood markers for early detection of colorectal cancer: a systematic review. Cancer Epidemiol. Biomarkers Prev. 16, 1935–1953 [DOI] [PubMed] [Google Scholar]
- 6. Barderas R., Babel I., Díaz-Uriarte R., Moreno V., Suárez A., Bonilla F., Villar-Vázquez R., Capellá G., Casal J. I. (2012) An optimized predictor panel for colorectal cancer diagnosis based on the combination of tumor-associated antigens obtained from protein and phage microarrays. J. Proteomics 75, 4647–4655 [DOI] [PubMed] [Google Scholar]
- 7. Smith J. J., Deane N. G., Dhawan P., Beauchamp R. D. (2008) Regulation of metastasis in colorectal adenocarcinoma: a collision between development and tumor biology. Surgery 144, 353–366 [DOI] [PMC free article] [PubMed] [Google Scholar]
- 8. Weitz J., Koch M., Debus J., Höhler T., Galle P. R., Büchler M. W. (2005) Colorectal cancer. Lancet 365, 153–165 [DOI] [PubMed] [Google Scholar]
- 9. Fearon E. R. (2011) Molecular genetics of colorectal cancer. Annu. Rev. Pathol. 6, 479–507 [DOI] [PubMed] [Google Scholar]
- 10. Nguyen D. X., Massagué J. (2007) Genetic determinants of cancer metastasis. Nat. Rev. Genet. 8, 341–352 [DOI] [PubMed] [Google Scholar]
- 11. Hanash S. M., Pitteri S. J., Faca V. M. (2008) Mining the plasma proteome for cancer biomarkers. Nature 452, 571–579 [DOI] [PubMed] [Google Scholar]
- 12. Hudson M. E., Pozdnyakova I., Haines K., Mor G., Snyder M. (2007) Identification of differentially expressed proteins in ovarian cancer using high-density protein microarrays. Proc. Natl. Acad. Sci. U.S.A. 104, 17494–17499 [DOI] [PMC free article] [PubMed] [Google Scholar]
- 13. Hanash S., Taguchi A. (2010) The grand challenge to decipher the cancer proteome. Nat. Rev. Cancer 10, 652–660 [DOI] [PubMed] [Google Scholar]
- 14. Morikawa K., Walker S. M., Nakajima M., Pathak S., Jessup J. M., Fidler I. J. (1988) Influence of organ environment on the growth, selection, and metastasis of human colon carcinoma cells in nude mice. Cancer Res. 48, 6863–6871 [PubMed] [Google Scholar]
- 15. Morikawa K., Walker S. M., Jessup J. M., Fidler I. J. (1988) In vivo selection of highly metastatic cells from surgical specimens of different primary human colon carcinomas implanted into nude mice. Cancer Res. 48, 1943–1948 [PubMed] [Google Scholar]
- 16. Kuniyasu H., Ohmori H., Sasaki T., Sasahira T., Yoshida K., Kitadai Y., Fidler I. J. (2003) Production of interleukin 15 by human colon cancer cells is associated with induction of mucosal hyperplasia, angiogenesis, and metastasis. Clin. Cancer Res. 9, 4802–4810 [PubMed] [Google Scholar]
- 17. Luque-García J. L., Martínez-Torrecuadrada J. L., Epifano C., Cañamero M., Babel I., Casal J. I. (2010) Differential protein expression on the cell surface of colorectal cancer cells associated with tumor metastasis. Proteomics 10, 940–952 [DOI] [PubMed] [Google Scholar]
- 18. Li A., Varney M. L., Singh R. K. (2004) Constitutive expression of growth regulated oncogene (gro) in human colon carcinoma cells with different metastatic potential and its role in regulating their metastatic phenotype. Clin. Exp. Metastasis 21, 571–579 [DOI] [PubMed] [Google Scholar]
- 19. Calon A., Espinet E., Palomo-Ponce S., Tauriello D. V., Iglesias M., Céspedes M. V., Sevillano M., Nadal C., Jung P., Zhang X. H., Byrom D., Riera A., Rossell D., Mangues R., Massagué J., Sancho E., Batlle E. (2012) Dependency of colorectal cancer on a TGF-β-driven program in stromal cells for metastasis initiation. Cancer Cell 22, 571–584 [DOI] [PMC free article] [PubMed] [Google Scholar]
- 20. Barderas R., Bartolomé R. A., Fernandez-Aceñero M. J., Torres S., Casal J. I. (2012) High expression of IL-13 receptor α2 in colorectal cancer is associated with invasion, liver metastasis, and poor prognosis. Cancer Res. 72, 2780–2790 [DOI] [PubMed] [Google Scholar]
- 21. Hegde P., Qi R., Gaspard R., Abernathy K., Dharap S., Earle-Hughes J., Gay C., Nwokekeh N. U., Chen T., Saeed A. I., Sharov V., Lee N. H., Yeatman T. J., Quackenbush J. (2001) Identification of tumor markers in models of human colorectal cancer using a 19,200-element complementary DNA microarray. Cancer Res. 61, 7792–7797 [PubMed] [Google Scholar]
- 22. Ghosh D., Yu H., Tan X. F., Lim T. K., Zubaidah R. M., Tan H. T., Chung M. C., Lin Q. (2011) Identification of key players for colorectal cancer metastasis by iTRAQ quantitative proteomics profiling of isogenic SW480 and SW620 cell lines. J. Proteome Res. 10, 4373–4387 [DOI] [PubMed] [Google Scholar]
- 23. Xue H., Lü B., Zhang J., Wu M., Huang Q., Wu Q., Sheng H., Wu D., Hu J., Lai M. (2010) Identification of serum biomarkers for colorectal cancer metastasis using a differential secretome approach. J. Proteome Res. 9, 545–555 [DOI] [PubMed] [Google Scholar]
- 24. Leibovitz A., Stinson J. C., McCombs W. B., 3rd, McCoy C. E., Mazur K. C., Mabry N. D. (1976) Classification of human colorectal adenocarcinoma cell lines. Cancer Res. 36, 4562–4569 [PubMed] [Google Scholar]
- 25. Geiger T., Wisniewski J. R., Cox J., Zanivan S., Kruger M., Ishihama Y., Mann M. (2011) Use of stable isotope labeling by amino acids in cell culture as a spike-in standard in quantitative proteomics. Nat. Protoc. 6, 147–157 [DOI] [PubMed] [Google Scholar]
- 26. Wessel D., Flügge U. I. (1984) A method for the quantitative recovery of protein in dilute solution in the presence of detergents and lipids. Anal. Biochem. 138, 141–143 [DOI] [PubMed] [Google Scholar]
- 27. Wiśniewski J. R., Zougman A., Nagaraj N., Mann M. (2009) Universal sample preparation method for proteome analysis. Nat. Methods 6, 359–362 [DOI] [PubMed] [Google Scholar]
- 28. Käll L., Canterbury J. D., Weston J., Noble W. S., MacCoss M. J. (2007) Semi-supervised learning for peptide identification from shotgun proteomics datasets. Nat. Methods 4, 923–925 [DOI] [PubMed] [Google Scholar]
- 29. Bendtsen J. D., Jensen L. J., Blom N., Von Heijne G., Brunak S. (2004) Feature-based prediction of non-classical and leaderless protein secretion. Protein Eng. Des. Sel. 17, 349–356 [DOI] [PubMed] [Google Scholar]
- 30. Mathivanan S., Fahner C. J., Reid G. E., Simpson R. J. (2012) ExoCarta 2012: database of exosomal proteins, RNA, and lipids. Nucleic Acids Res. 40, D1241–D1244 [DOI] [PMC free article] [PubMed] [Google Scholar]
- 31. Jensen L. J., Kuhn M., Stark M., Chaffron S., Creevey C., Muller J., Doerks T., Julien P., Roth A., Simonovic M., Bork P., von Mering C. (2009) STRING 8–a global view on proteins and their functional interactions in 630 organisms. Nucleic Acids Res. 37, D412–D416 [DOI] [PMC free article] [PubMed] [Google Scholar]
- 32. Szklarczyk D., Franceschini A., Kuhn M., Simonovic M., Roth A., Minguez P., Doerks T., Stark M., Muller J., Bork P., Jensen L. J., von Mering C. (2011) The STRING database in 2011: functional interaction networks of proteins, globally integrated and scored. Nucleic Acids Res. 39, D561–D568 [DOI] [PMC free article] [PubMed] [Google Scholar]
- 33. Cerami E., Gao J., Dogrusoz U., Gross B. E., Sumer S. O., Aksoy B. A., Jacobsen A., Byrne C. J., Heuer M. L., Larsson E., Antipin Y., Reva B., Goldberg A. P., Sander C., Schultz N. (2012) The cBio cancer genomics portal: an open platform for exploring multidimensional cancer genomics data. Cancer Discov. 2, 401–404 [DOI] [PMC free article] [PubMed] [Google Scholar]
- 34. Yang W., Cai Q., Lui V. W., Everley P. A., Kim J., Bhola N., Quesnelle K. M., Zetter B. R., Steen H., Freeman M. R., Grandis J. R. (2010) Quantitative proteomics analysis reveals molecular networks regulated by epidermal growth factor receptor level in head and neck cancer. J. Proteome Res. 9, 3073–3082 [DOI] [PMC free article] [PubMed] [Google Scholar]
- 35. Sherr C. J. (2006) Autophagy by ARF: a short story. Mol. Cell 22, 436–437 [DOI] [PubMed] [Google Scholar]
- 36. Koopmann J., Rosenzweig C. N., Zhang Z., Canto M. I., Brown D. A., Hunter M., Yeo C., Chan D. W., Breit S. N., Goggins M. (2006) Serum markers in patients with resectable pancreatic adenocarcinoma: macrophage inhibitory cytokine 1 versus CA19-9. Clin. Cancer Res. 12, 442–446 [DOI] [PubMed] [Google Scholar]
- 37. Welsh J. B., Sapinoso L. M., Kern S. G., Brown D. A., Liu T., Bauskin A. R., Ward R. L., Hawkins N. J., Quinn D. I., Russell P. J., Sutherland R. L., Breit S. N., Moskaluk C. A., Frierson H. F., Jr., Hampton G. M. (2003) Large-scale delineation of secreted protein biomarkers overexpressed in cancer tissue and serum. Proc. Natl. Acad. Sci. U.S.A. 100, 3410–3415 [DOI] [PMC free article] [PubMed] [Google Scholar]
- 38. Makawita S., Smith C., Batruch I., Zheng Y., Ruckert F., Grutzmann R., Pilarsky C., Gallinger S., Diamandis E. P. (2011) Integrated proteomic profiling of cell line conditioned media and pancreatic juice for the identification of pancreatic cancer biomarkers. Mol. Cell. Proteomics 10, M111.008599. [DOI] [PMC free article] [PubMed] [Google Scholar]
- 39. Sardana G., Jung K., Stephan C., Diamandis E. P. (2008) Proteomic analysis of conditioned media from the PC3, LNCaP, and 22Rv1 prostate cancer cell lines: discovery and validation of candidate prostate cancer biomarkers. J. Proteome Res. 7, 3329–3338 [DOI] [PubMed] [Google Scholar]
- 40. Psaila B., Lyden D. (2009) The metastatic niche: adapting the foreign soil. Nat. Rev. Cancer 9, 285–293 [DOI] [PMC free article] [PubMed] [Google Scholar]
- 41. Ratajczak J., Wysoczynski M., Hayek F., Janowska-Wieczorek A., Ratajczak M. Z. (2006) Membrane-derived microvesicles: important and underappreciated mediators of cell-to-cell communication. Leukemia 20, 1487–1495 [DOI] [PubMed] [Google Scholar]
- 42. Lee T. H., D'Asti E., Magnus N., Al-Nedawi K., Meehan B., Rak J. (2011) Microvesicles as mediators of intercellular communication in cancer–the emerging science of cellular ‘debris. ’ Semin. Immunopathol. 33, 455–467 [DOI] [PubMed] [Google Scholar]
- 43. Muralidharan-Chari V., Clancy J. W., Sedgwick A., D'Souza-Schorey C. (2010) Microvesicles: mediators of extracellular communication during cancer progression. J. Cell Sci. 123, 1603–1611 [DOI] [PMC free article] [PubMed] [Google Scholar]
- 44. Peinado H., Rafii S., Lyden D. (2008) Inflammation joins the “niche.” Cancer Cell 14, 347–349 [DOI] [PMC free article] [PubMed] [Google Scholar]
- 45. Hiratsuka S., Nakamura K., Iwai S., Murakami M., Itoh T., Kijima H., Shipley J. M., Senior R. M., Shibuya M. (2002) MMP9 induction by vascular endothelial growth factor receptor-1 is involved in lung-specific metastasis. Cancer Cell 2, 289–300 [DOI] [PubMed] [Google Scholar]
- 46. Kim H. J., Kang H. J., Lee H., Lee S. T., Yu M. H., Kim H., Lee C. (2009) Identification of S100A8 and S100A9 as serological markers for colorectal cancer. J. Proteome Res. 8, 1368–1379 [DOI] [PubMed] [Google Scholar]
- 47. Rodríguez-González R., Millán M., Sobrino T., Miranda E., Brea D., de la Ossa N. P., Blanco M., Perez J., Dorado L., Castellanos M., Lomas D. A., Moro M. A., Dávalos A., Castillo J. (2011) The natural tissue plasminogen activator inhibitor neuroserpin and acute ischaemic stroke outcome. Thromb. Haemost. 105, 421–429 [DOI] [PubMed] [Google Scholar]
- 48. Larrucea S., Butta N., Arias-Salgado E. G., Alonso-Martin S., Ayuso M. S., Parrilla R. (2008) Expression of podocalyxin enhances the adherence, migration, and intercellular communication of cells. Exp. Cell Res. 314, 2004–2015 [DOI] [PubMed] [Google Scholar]
- 49. Larsson A., Johansson M. E., Wangefjord S., Gaber A., Nodin B., Kucharzewska P., Welinder C., Belting M., Eberhard J., Johnsson A., Uhlén M., Jirström K. (2011) Overexpression of podocalyxin-like protein is an independent factor of poor prognosis in colorectal cancer. Br. J. Cancer 105, 666–672 [DOI] [PMC free article] [PubMed] [Google Scholar]
- 50. Meng X., Ezzati P., Wilkins J. A. (2011) Requirement of podocalyxin in TGF-β induced epithelial mesenchymal transition. PLoS One 6, e18715. [DOI] [PMC free article] [PubMed] [Google Scholar]
- 51. Wilson N. H., Key B. (2007) Neogenin: one receptor, many functions. Int. J. Biochem. Cell Biol. 39, 874–878 [DOI] [PubMed] [Google Scholar]
- 52. Martín M., Simon-Assmann P., Kedinger M., Martin M., Mangeat P., Real F. X., Fabre M. (2006) DCC regulates cell adhesion in human colon cancer derived HT-29 cells and associates with ezrin. Eur. J. Cell Biol. 85, 769–783 [DOI] [PubMed] [Google Scholar]
- 53. Burden R. E., Gormley J. A., Jaquin T. J., Small D. M., Quinn D. J., Hegarty S. M., Ward C., Walker B., Johnston J. A., Olwill S. A., Scott C. J. (2009) Antibody-mediated inhibition of cathepsin S blocks colorectal tumor invasion and angiogenesis. Clin. Cancer Res. 15, 6042–6051 [DOI] [PubMed] [Google Scholar]
- 54. Yang Y., Yixuan Y., Lim S. K., Kiat L. S., Choong L. Y., Yee C. L., Lee H., Huiyin L., Chen Y., Yunhao C., Chong P. K., Kuan C. P., Ashktorab H., Hassan A., Wang T. T., Ting W. T., Salto-Tellez M., Manuel S. T., Yeoh K. G., Guan Y. K., Lim Y. P., Pin L. Y. (2010) Cathepsin S mediates gastric cancer cell migration and invasion via a putative network of metastasis-associated proteins. J. Proteome Res. 9, 4767–4778 [DOI] [PubMed] [Google Scholar]
- 55. Schick C., Pemberton P. A., Shi G. P., Kamachi Y., Cataltepe S., Bartuski A. J., Gornstein E. R., Brömme D., Chapman H. A., Silverman G. A. (1998) Cross-class inhibition of the cysteine proteinases cathepsins K, L, and S by the serpin squamous cell carcinoma antigen 1: a kinetic analysis. Biochemistry 37, 5258–5266 [DOI] [PubMed] [Google Scholar]
- 56. Yasuda S., Morokawa N., Wong G. W., Rossi A., Madhusudhan M. S., Sali A., Askew Y. S., Adachi R., Silverman G. A., Krilis S. A., Stevens R. L. (2005) Urokinase-type plasminogen activator is a preferred substrate of the human epithelium serine protease tryptase epsilon/PRSS22. Blood 105, 3893–3901 [DOI] [PMC free article] [PubMed] [Google Scholar]
- 57. Hastings G. A., Coleman T. A., Haudenschild C. C., Stefansson S., Smith E. P., Barthlow R., Cherry S., Sandkvist M., Lawrence D. A. (1997) Neuroserpin, a brain-associated inhibitor of tissue plasminogen activator is localized primarily in neurons. Implications for the regulation of motor learning and neuronal survival. J. Biol. Chem. 272, 33062–33067 [DOI] [PubMed] [Google Scholar]
- 58. Ye C., Qi M., Fan Q. W., Ito K., Akiyama S., Kasai Y., Matsuyama M., Muramatsu T., Kadomatsu K. (1999) Expression of midkine in the early stage of carcinogenesis in human colorectal cancer. Br. J. Cancer 79, 179–184 [DOI] [PMC free article] [PubMed] [Google Scholar]
- 59. Colombo C., Creighton C. J., Ghadimi M. P., Bolshakov S., Warneke C. L., Zhang Y., Lusby K., Zhu S., Lazar A. J., West R. B., van de Rijn M., Lev D. (2011) Increased midkine expression correlates with desmoid tumour recurrence: a potential biomarker and therapeutic target. J. Pathol. 225, 574–582 [DOI] [PubMed] [Google Scholar]
- 60. Muramatsu H., Zou P., Suzuki H., Oda Y., Chen G. Y., Sakaguchi N., Sakuma S., Maeda N., Noda M., Takada Y., Muramatsu T. (2004) α4β1- and α6β1-integrins are functional receptors for midkine, a heparin-binding growth factor. J. Cell Sci. 117, 5405–5415 [DOI] [PubMed] [Google Scholar]
- 61. Kim D. K., Lee S. C., Lee H. W. (2009) CD137 ligand-mediated reverse signals increase cell viability and cytokine expression in murine myeloid cells: involvement of mTOR/p70S6 kinase and Akt. Eur. J. Immunol. 39, 2617–2628 [DOI] [PubMed] [Google Scholar]
- 62. Dimberg J., Hugander A., Wågsäter D. (2006) Expression of CD137 and CD137 ligand in colorectal cancer patients. Oncol. Rep. 15, 1197–1200 [PubMed] [Google Scholar]
- 63. Kim S. A., Lee Y., Jung D. E., Park K. H., Park J. Y., Gang J., Jeon S. B., Park E. C., Kim Y. G., Lee B., Liu Q., Zeng W., Yeramilli S., Lee S., Koh S. S., Song S. Y. (2009) Pancreatic adenocarcinoma up-regulated factor (PAUF), a novel up-regulated secretory protein in pancreatic ductal adenocarcinoma. Cancer Sci. 100, 828–836 [DOI] [PMC free article] [PubMed] [Google Scholar]
- 64. Park H. D., Lee Y., Oh Y. K., Jung J. G., Park Y. W., Myung K., Kim K. H., Koh S. S., Lim D. S. (2011) Pancreatic adenocarcinoma up-regulated factor promotes metastasis by regulating TLR/CXCR4 activation. Oncogene 30, 201–211 [DOI] [PMC free article] [PubMed] [Google Scholar]
- 65. Sotsios Y., Whittaker G. C., Westwick J., Ward S. G. (1999) The CXC chemokine stromal cell-derived factor activates a Gi-coupled phosphoinositide 3-kinase in T lymphocytes. J. Immunol. 163, 5954–5963 [PubMed] [Google Scholar]
- 66. Kim S. J., Lee Y., Kim N. Y., Hwang Y., Hwang B., Min J. K., Koh S. S. (2012) Pancreatic adenocarcinoma up-regulated factor, a novel endothelial activator, promotes angiogenesis and vascular permeability. Oncogene doi: 10.1038/onc.2012.366 [DOI] [PubMed] [Google Scholar]
- 67. Kang Y. J., Kim S. O., Shimada S., Otsuka M., Seit-Nebi A., Kwon B. S., Watts T. H., Han J. (2007) Cell surface 4–1BBL mediates sequential signaling pathways ‘downstream’ of TLR and is required for sustained TNF production in macrophages. Nat. Immunol. 8, 601–609 [DOI] [PubMed] [Google Scholar]
- 68. Levi A., Eldridge J. D., Paterson B. M. (1985) Molecular cloning of a gene sequence regulated by nerve growth factor. Science 229, 393–395 [DOI] [PubMed] [Google Scholar]
- 69. Yanagita M., Oka M., Watabe T., Iguchi H., Niida A., Takahashi S., Akiyama T., Miyazono K., Yanagisawa M., Sakurai T. (2004) USAG-1: a bone morphogenetic protein antagonist abundantly expressed in the kidney. Biochem. Biophys. Res. Commun. 316, 490–500 [DOI] [PubMed] [Google Scholar]
- 70. Blish K. R., Wang W., Willingham M. C., Du W., Birse C. E., Krishnan S. R., Brown J. C., Hawkins G. A., Garvin A. J., D'Agostino R. B., Jr., Torti F. M., Torti S. V. (2008) A human bone morphogenetic protein antagonist is down-regulated in renal cancer. Mol. Biol. Cell 19, 457–464 [DOI] [PMC free article] [PubMed] [Google Scholar]
- 71. Pasquale E. B. (2010) Eph receptors and ephrins in cancer: bidirectional signalling and beyond. Nat. Rev. Cancer 10, 165–180 [DOI] [PMC free article] [PubMed] [Google Scholar]
- 72. Wong E. V., Kerner J. A., Jay D. G. (2004) Convergent and divergent signaling mechanisms of growth cone collapse by ephrinA5 and slit2. J. Neurobiol. 59, 66–81 [DOI] [PubMed] [Google Scholar]
- 73. Minami M., Koyama T., Wakayama Y., Fukuhara S., Mochizuki N. (2011) EphrinA/EphA signal facilitates insulin-like growth factor-I-induced myogenic differentiation through suppression of the Ras/extracellular signal-regulated kinase 1/2 cascade in myoblast cell lines. Mol. Biol. Cell 22, 3508–3519 [DOI] [PMC free article] [PubMed] [Google Scholar]
- 74. Bourgin C., Murai K. K., Richter M., Pasquale E. B. (2007) The EphA4 receptor regulates dendritic spine remodeling by affecting β1-integrin signaling pathways. J. Cell Biol. 178, 1295–1307 [DOI] [PMC free article] [PubMed] [Google Scholar]
- 75. Pasquale E. B. (1997) The Eph family of receptors. Curr. Opin. Cell Biol. 9, 608–615 [DOI] [PubMed] [Google Scholar]
- 76. Chen H. T., Tsou H. K., Chang C. H., Tang C. H. (2012) Hepatocyte growth factor increases osteopontin expression in human osteoblasts through PI3K, Akt, c-Src, and AP-1 signaling pathway. PLoS One 7, e38378. [DOI] [PMC free article] [PubMed] [Google Scholar]
- 77. Naci D., El Azreq M. A., Chetoui N., Lauden L., Sigaux F., Charron D., Al-Daccak R., Aoudjit F. (2012) α2β1 integrin promotes chemoresistance against doxorubicin in cancer cells through extracellular signal-regulated kinase (ERK). J. Biol. Chem. 287, 17065–17076 [DOI] [PMC free article] [PubMed] [Google Scholar]
- 78. Liebmann C. (2001) Bradykinin signalling to MAP kinase: cell-specific connections versus principle mitogenic pathways. Biol. Chem. 382, 49–55 [DOI] [PubMed] [Google Scholar]
- 79. Kim H. K., Oh D. S., Lee S. B., Ha J. M., Joe Y. A. (2008) Antimigratory effect of TK1–2 is mediated in part by interfering with integrin α2β1. Mol. Cancer Ther. 7, 2133–2141 [DOI] [PubMed] [Google Scholar]
- 80. Nikolopoulos S. N., Giancotti F. G. (2005) Netrin-integrin signaling in epithelial morphogenesis, axon guidance and vascular patterning. Cell Cycle 4, e131–135 [PubMed] [Google Scholar]
- 81. Endo M., Yamashita T. (2009) Inactivation of Ras by p120GAP via focal adhesion kinase dephosphorylation mediates RGMa-induced growth cone collapse. J. Neurosci. 29, 6649–6662 [DOI] [PMC free article] [PubMed] [Google Scholar]
- 82. Yanagita M. (2005) BMP antagonists: their roles in development and involvement in pathophysiology. Cytokine Growth Factor Rev. 16, 309–317 [DOI] [PubMed] [Google Scholar]
- 83. Shon S. K., Kim A., Kim J. Y., Kim K. I., Yang Y., Lim J. S. (2009) Bone morphogenetic protein-4 induced by NDRG2 expression inhibits MMP-9 activity in breast cancer cells. Biochem. Biophys. Res. Commun. 385, 198–203 [DOI] [PubMed] [Google Scholar]
- 84. Kumagai T., Shimizu T., Takeda K. (2006) Bone morphogenetic protein-2 suppresses invasiveness of TSU-Pr1 cells with the inhibition of MMP-9 secretion. Anticancer Res. 26, 293–298 [PubMed] [Google Scholar]
- 85. Pi W., Guo X., Su L., Xu W. (2012) BMP-2 up-regulates PTEN expression and induces apoptosis of pulmonary artery smooth muscle cells under hypoxia. PLoS One 7, e35283. [DOI] [PMC free article] [PubMed] [Google Scholar]
- 86. Huang Y., Sook-Kim M., Ratovitski E. (2008) Midkine promotes tetraspanin-integrin interaction and induces FAK-Stat1α pathway contributing to migration/invasiveness of human head and neck squamous cell carcinoma cells. Biochem. Biophys. Res. Commun. 377, 474–478 [DOI] [PubMed] [Google Scholar]
Associated Data
This section collects any data citations, data availability statements, or supplementary materials included in this article.