

Abstract
The past 15 years have seen significant progress in LC-MS/MS peptide sequencing, including the advent of successful de novo and database search methods; however, analysis of glycopeptide and, more generally, glycoconjugate spectra remains a much more open problem, and much annotation is still performed manually. This is partly because glycans, unlike peptides, need not be linear chains and are instead described by trees. In this study, we introduce SweetSEQer, an extremely simple open source tool for identifying potential glycopeptide MS/MS spectra. We evaluate SweetSEQer on manually curated glycoconjugate spectra and on negative controls, and we demonstrate high quality filtering that can be easily improved for specific applications. We also demonstrate a high overlap between peaks annotated by experts and peaks annotated by SweetSEQer, as well as demonstrate inferred glycan graphs consistent with canonical glycan tree motifs. This study presents a novel tool for annotating spectra and producing glycan graphs from LC-MS/MS spectra. The tool is evaluated and shown to perform similarly to an expert on manually curated data.
Protein glycosylation is a common modification, affecting ∼50% of all expressed proteins (1). Glycosylation affects critical biological functions, including cell-cell recognition, circulating half-life, substrate binding, immunogenicity, and others (2). Regrettably, determining the exact role glycosylation plays in different biological contexts is slowed by a dearth of analytical methods and of appropriate software. Such software is crucial for performing and aiding experts in data analysis complex glycosylation.
Glycopeptides are highly heterogeneous in regard to glycan composition, glycan structure, and linkage stereochemistry in addition to the tens of thousands of possible peptides. The analysis of protein glycosylation is often segmented into three distinct types of mass spectrometry experiments, which together help to resolve this complexity. The first analyzes enzymatically or chemically released glycans (which may or may not be chemically modified), and the second determines glycosylation sites after release of glycans from peptides (the resulting mass spectra allow detection of glycosylation sites and the glycans on those sites simultaneously). The third determines the glycosylation sites and the glycans on those sites simultaneously, by MS of intact glycopeptides. Frequently, researchers will perform all three types of analysis, with the first two types providing information about possible combinations of glycan structures and peptides that could be found in the third experiment. Using this MS1 information, the problem is reduced to matching masses observed with a combinatorial pool of all possible glycans and all possible glycosylated peptides within a sample; however, this combinatorial approach alone is insufficient (3), and tandem mass spectrometry can provide copious additional information to help resolve the glycopeptide content from complex samples.
The similar problem of inferring peptide sequences from MS/MS spectra has received considerably more attention. Peptide inference is more constrained than glycan inference, because the chain of MS/MS peaks corresponds to a linear peptide sequence; given an MS/MS spectrum, the linear peptide sequence can be inferred through brute force or dynamic programming via de novo methods (4–6) as described in Ref. 7. Additionally, the possible search space of peptides can be dramatically lowered by using database searching (8–21) as described in Ref. 7, which compares the MS/MS spectrum to the predicted spectra from only those peptides resulting from a protein database or translated open reading frames (ORFs) of a genomic database.
The possible search space of glycans is larger than the search space of peptides because, in contrast to linear peptide chains, glycans may form branching trees. Identifying glycans using database search methodologies is impractical, as it is impractical to define the database when the detailed activities of the set of glycosyltransferases are not defined. Generating an overly large database would artificially inflate the set of incompletely characterized spectra, and too small of a search space would lead to inaccurate results. Furthermore, as glycosylation is not a template-driven process, no clear choice for a database matching approach is available, and de novo sequencing is therefore a more appropriate approach.
As a result, few desirable software options are available for the high throughput analysis of tandem mass spectrometry data from intact glycopeptides (as noted in a recent review (22)). In fact, manual annotation of spectra is still commonplace, despite being slow and despite the potential for disagreement between different experts. Some available software requires user-defined lists of glycan and/or peptide masses as input, which is suboptimal from a sample consumption and throughput perspective (23, 24). These lists must typically be generated by parallel experiments or simply hypothesized a priori, meaning omissions in either list may affect the results. Furthermore, some software does not work on batched input files, meaning each spectrum must be analyzed separately (23, 25–28). Moreover, there is an even greater lack of open source software for glycoproteomics, so modifying the existing software for the researchers individual applications is not easily achieved. The one open source tool that we know of (GlypID) is applicable only to the analysis of glycopeptide spectra acquired from a very specialized workflow, which requires MS1, CID, and higher-energy C-trap type dissociation (HCD) spectra (29). With that approach, oxonium ions from HCD spectra are necessary to predict the glycan class; potential peptide lists are queried by precursor m/z values (requiring accurate a priori knowledge of all modifications), and possible theoretical “N-linked” precursor m/z values are used to select candidate spectra (using templates, unlike de novo characterization). As a result, the tool is specialized and limited to analysis of “N-linked” glycopeptide spectra from very specific experimental setups.
Free, open-source glycoproteomic software capable of batch analysis of general tandem mass spectrometry spectra of glycoconjugates is sorely needed. In this work, we present SweetSEQer, a tool for de novo analysis of tandem mass spectra of glycoconjugates (the most general class of spectra containing fragmentation involving sugars). Furthermore, because SweetSEQer is so general and simple, and because it does not require specific experimental setup, it is widely applicable to the analysis of general glycoconjugate spectra (e.g. it is already applicable to “O-linked” glycopeptide and glycoconjugate spectra). Moreover, because it is an open source and does not use external software, it not only eschews solving problems like MS1 deisotoping, it can also be easily customized and even used to augment and complement existing tools like GlypID (and, because we do not use a “copyleft” software license, our algorithm and code can even be added to non-open source and proprietary variants).
SweetSEQer's performance was tested on a validated, manually annotated set of glycoconjugate identifications from a urinary glycoproteomics study. Specificity was demonstrated by showing a low identification rate on negative control spectra from Escherichia coli. Annotated structures are shown to be consistent by a human expert by demonstrating a high overlap in identified glycan fragment ions, as well as a consistency between SweetSEQer's predicted glycan graph and glycan chains produced by an expert. Our simple object-oriented python implementation is freely available (Apache 2.0 license) on line.
EXPERIMENTAL PROCEDURES
Sample Preparation
A clean-catch urine sample from a healthy infant was obtained with an IRB-approved protocol from the Boston Children's Hospital internal biobank and processed using a spin filter-based sample preparation (30). Proteins were desalted, reduced, and alkylated in the spin filter, washed extensively with triethyl ammonium bicarbonate (TEAB), and subsequently digested with trypsin at a w/v ratio of 50:1 sample/enzyme overnight at 37°C. Peptides were labeled with TMT6–126 (Thermo Scientific) according to the manufacturer's instructions and purified with HLB cartridges (Oasis). Peptides were fractionated using an Agilent OFFGEL isoelectric point fractionator for 50 kV-h, extracted, and dried.
Individual fractions were reconstituted in loading buffer and analyzed by LC-MS/MS using a Thermo QExactive MS system (a high mass accuracy instrument) equipped with an Eksigent 2D nano-LC system, autosampler, and home-packed C18 column. A top 10 data-dependent LC-MS/MS method was utilized, and resolution was set to 70 K for MS1 and 17.5 K for MS2 scans. A 60-min linear gradient from 5 to 35% ACN was used. Normalized collision energy was 30, and the AGC was set for 1e6 for MS1 and 5e4 for MS2 scans.
Curated Validation Data
All MS2 spectra with the diagnostic Hex1HexNAc1 oxonium ion at 366.1395 m/z were manually annotated when the spectral quality permitted. In total, 62 N-glycopeptide spectra were identified. To evaluate the ability of SweetSEQer to identify glycoconjugates, these spectra were converted to centroided mgf files using the publicly available msconvert tool (from ProteoWizard 2.1 (31)). Similarly, to determine the false-positive rate and false discovery rate of SweetSEQer, three replicate samples of E. coli were processed on the same machine with identical experimental configuration, and the MS2 spectra were then converted into an mgf file using identical msconvert settings. E. coli is known to have very limited glycosylation (32); thus, E. coli spectra constitute high quality negative controls and can be used to measure the false-positive rate and false discovery rate. The positive and negative controls were then analyzed using an m/z tolerance of 0.01 Da and an intensity thresholding of 1% Base Peak Intensity in SweetSEQer to identify monosaccharide losses between fragment peaks.
Simple Method for Glycan Inference
SweetSEQer employs a simple idea: link MS/MS peaks of nontrivial intensity (defined by the free parameter τ) that are approximately separated by a predicted glycan mass-to-charge and then identify the largest directed subgraph with dynamic programming (peptide sequences are also inferred by identifying the longest path). For this experiment, we include hexose (162.0528 Da), HexNAc (203.0794), dHex (146.0579), and NeuAc (291.0954) (isotope shifts of ±1.003 Da are also included). Importantly, edges are added so that if there are edges connecting peak a to b via hexose (for example) and connecting a to c via hexose (with an isotope shift), then all edges coming from b are added to c (and vice versa). This allows a path to enter into one isotope peak and leave from another, substantially increasing the ability of SweetSEQer to piece together large connected glycan graphs; however, it does so without “merging” these isotope peaks, which would have a significant drawback. If isotope peaks were merged, a large collection of peaks each 1.003 Da from the next may all be merged together and permit paths that enter into the lowest m/z peak and exit via the highest m/z peak, far away. Furthermore, these individual isotope peaks present corroborating evidence and help discriminate genuine glycoconjugate spectra from false-positives, and merging them would discard this evidence.
The specific list of monosaccharides utilized are easily edited for the user's application. Peaks separated by these predicted mass-to-charges are found by performing a log2 search on the sorted peaks' mass-to-charges and searching for the value closest to the sum of the first peak and the predicted change from adding the glycan. This log2 search is significantly more efficient than performing a full pairwise search of all peaks. Spectra whose peptide sequences and glycan graphs (including edges from isotopic shifts) that are larger than user-defined thresholds pass through the filter and are displayed with colored peaks (the inferred peptide sequence and a glycan graph produced by the graph are displayed in the output). Note that for successful filtering of high quality glycans, the graph need not be perfect; successfully building a large tree simply indicates a high quality glycoconjugate match, and it can be used to quickly narrow spectra of interest and aid an expert in finding the glycan structure.
The free parameters of the method allow the user to define the stringency with which spectra are filtered as follows: ε defines the maximum allowable error between the expected and measured peak location (in m/z). λ defines the minimum peak intensity relative to the most intense peak in the spectrum (i > λimax). p defines the minimum number of fragment ions in the predicted peptide chain. g defines the minimum number of glycans in the predicted graph (this is the number of edges in the graph, including isotopic shifts). Finally, τ determines the minimum m/z value of peaks considered in the glycan graph. CID and HCD fragmentation of glycoconjugates produce characteristic oxonium ions in the low m/z region. These oxonium ions are highly useful for identifying which spectra came from glycoconjugates; however, they are not informative with regard to identifying the glycan or the peptide moieties. Therefore, the τ parameter in SweetSEQer allows the user to filter out those spectra that identify only these oxonium ion series. A useful value for this goal would be 660 Th, which is above the HexNAc-Hex-NeuAc ion at 657 Th. Otherwise, the commonly occurring ions at 204 (HexNAc), 366 (Hex-HexNAc), and 657 (NeuAc-Hex-HexNAc) would match several otherwise uninformative spectra. A complete sequencing of peptides <660 Th would yield little marginal utility, as smaller peptides are shared by several proteins.
RESULTS AND DISCUSSION
We processed both the control and positive curated data sets using SweetSEQer (parameters ε = 0.01; λ = 0.01; p = 0, g = 7, and τ = 500); even with this very simple filtering, 58/64 positive spectra are identified, while only identifying 1.3% of negative control spectra (Table I). This 1.3% corresponds to the false-positive rate, which is defined as the percent of nonglycoconjugate spectra that are mislabeled as glycoconjugate shown in Equation 1,
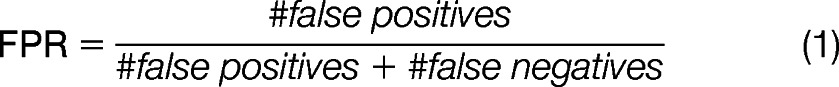 |
Table I. Results on positive (curated) and control spectra.
SweetSEQer identifies 93% (58/62) positive spectra (which were curated by an expert) while only identifying 1.3% of the negative control spectra from E. coli. E. coli is known to have very limited glycosylation. Both graphs are consistent with the canonical N-linked core.
| Positives | E. coli (negative controls) | |
|---|---|---|
| No. of spectra | 62 | 70,159 |
| No. matched | 58 | 915 |
| Percent matched | 93% | 1.3% |
However, the false discovery rate is defined as the percent of all spectra labeled as glycoconjugate that are incorrectly labeled as shown in Equation 2,
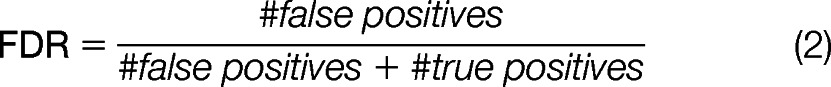 |
If a sample twice the size of the curated spectra (i.e. 124 spectra) were analyzed, where 50% of these spectra were glycoconjugate spectra and 50% were nonglycoconjugate spectra, then the estimated number of false-positive matches at a 1.3% false-positive rate would be 1.3% × 62 ≈ 0.8. With the 58 true positive hits in the curated spectra, we would estimate that a 50/50 mixture of glycoconjugate and nonglycoconjugate spectra would result in a false discovery rate of 0.8/(0.8 + 58) ≈ 1.4%. As the percentage of nonglycoconjugate spectra in the data set was increased, this rate would rise.
A high sensitivity-specificity tradeoff is especially useful in practice (rather than evaluation), when no curated positive controls are available. High quality negative controls (e.g. the E. coli spectra employed here) can be utilized by statistical methods for rigorously estimating the free parameters and providing nonarbitrary false discovery rate thresholds and probabilistic estimates for individual matches (33).
The output of SweetSEQer on two positive spectra are shown in Fig. 1 (note that intensities are scaled and averaged for the region of interest in the expert-annotated spectra). Table II shows two separate measures for demonstrating the consistency between expert-annotated spectra and SweetSEQer's graphs. First, for all identified curated spectra, we calculate the recall of expert-identified fragment ions that are also annotated by SweetSEQer. Second, for all identified curated spectra, we compute the percent of SweetSEQer-inferred graphs that are consistent with expert annotation. SweetSEQer correctly identifies the majority (85%) of the expert-annotated peaks. Note this high similarity, despite the fact that the expert did not see the SweetSEQer output and was thus not constrained to use the same charge state. In 6/58 spectra, the expert used an ion series from a different charge state, making it virtually impossible to find the same fragment ion peaks. SweetSEQer also generates graphs consistent with an expert's annotation on 91% (53/58) of the identified curated spectra. In many cases, SweetSEQer finds additional peaks that are consistent with canonical glycan structures. These results not only demonstrate consistency with an expert, they also highlight the limits of expert annotation; an expert may correctly observe peaks from core structures but frequently miss peaks of low intensity, which can provide more detailed resolution of the glycan structure.
Fig. 1.

Examples of annotated positive spectra and graphs produced by SweetSEQer. Each column shows a curated spectrum with results from an expert and from SweetSEQer. The 1st row shows the expert-annotated spectrum. SweetSEQer annotates spectra by drawing glycan peaks in red and peptide peaks in blue (isotope shifts are included for both). Note that intensities are scaled and averaged for the region of interest in the expert-annotated spectra. The 2nd row shows the spectrum as annotated by SweetSEQer. The 3rd row shows the corresponding glycan graph computed by SweetSEQer. SweetSEQer produces glycan graphs by connecting glycan peaks (isotope edges are removed to remove clutter). These glycan graphs are used by an expert to easily generate a consistent glycan tree (inset). Edges in the graph are annotated using standard glycan symbols as follows: ● (hexose); ■ (HexNAc); ▴ (dHex); and ♢ (NeuAc). For reference, the minimum m/z peak in the graph is annotated with an asterisk, and its mass is written in the top left corner of the graph.
Table II. Accuracy of annotation on identified curated spectra.
From the 58/62 curated spectra that SweetSEQer identifies, we compute the total number of fragment ions annotated by the expert and by SweetSEQer (including isotopic shifts), and we compute the percent of expert-annotated peaks that are found by SweetSEQer. Note that the expert did not see the SweetSEQer output beforehand and was thus not constrained to use the same charge state for the ion series. For 6/62 spectra, the charge state ion series used by the expert and SweetSEQer were different, making recall of the fragment ions virtually impossible. We then compute the number of those 58 spectra for which SweetSEQer produces a glycan graph consistent with the expert's manually drawn glycan chain. All expert results are produced blind to the SweetSEQer output.
| Analysis time | Fragment ions | Spectra with graphs consistent with expert | |
|---|---|---|---|
| Expert | 12 h | 465 | |
| SweetSEQer | <1 min | 1326 | 53 |
| Recall | 85% | 53/58 = 91% |
Additionally, even though the graphs produced by SweetSEQer are unconstrained (i.e. they do not exploit prior knowledge about likely glycan features and structures), these graphs are shown to be consistent with the canonical glycan structures (e.g. the N-linked core) and can substantially aid an expert in two principal ways: first, by winnowing likely glycoconjugate spectra from thousands of candidates, and second, by generating easily interpretable figures that help the user annotate spectra. This high quality computational annotation is easily married with an expert's prior knowledge (e.g. regarding likely characteristics and structures of glycans in his or her specific sample preparation) and can help yield analyses far superior to an expert alone. This prior knowledge can even be incorporated into the SweetSEQer code for tailored analysis (e.g. the observed oxonium ions could be analyzed earlier and used to determine the allowed glycans, and thus the allowed m/z gaps between fragment ions, for a given MS2 spectrum).
Despite its simplicity, it is intuitive how this method would produce high quality filtering and sequencing, particularly when high mass accuracy data are available; the algorithm simply automates a process similar to how glycan spectra are identified by hand. Because it is simple, open-sourced, object-oriented, and permits batch processing of MGF files, our method can be trivially remixed to add application-specific filtering. Missing peaks can be easily handled by including slightly penalized double edges. Branch and bound (and probabilistic variants (34), which have desirable theoretical properties (35)) can be used to search for canonical glycan structures in the graph (e.g. the chitobiose, also called the N-linked core). Moreover, our code indicates where the graph-building algorithm can be easily adapted to dramatically speed search with a hash table and windowing when ε is small. Although future methods are bound to introduce and expand upon probabilistic models, simple tools like SweetSEQer are quite useful for quickly sifting through MGF files and rapidly developing new tools.
Acknowledgments
Author Contributions: O.S. proposed the de novo approach for sequencing glycoconjugate spectra. J.F. prepared the urine samples, performed the LC-MS/MS analysis, and curated the data. G.M. prepared E. coli lysates for LC-MS/MS, and J.M. performed LC-MS/MS on them. O.S., J.F., R.L, J.S., and H.S. proposed the experiments in the paper.
Footnotes
* This work was supported, in whole or in part, by National Institutes of Health Grants NS007473 and NS066973 (to O.S.), Grant DK077836 (to J.F. and R.L.), Grant GM096319 (to J.M.), Grants HD020991 and DK082316 (to G.M.), Grant NS066973 (to J.S.), and Grants GM096319 and GM094844 (to H.S.).
REFERENCES
- 1. Apweiler R., Hermjakob H., Sharon N. (1999) On the frequency of protein glycosylation, as deduced from analysis of the SWISS-PROT database. Biochim. Biophys. Acta 1473, 4–8 [DOI] [PubMed] [Google Scholar]
- 2. Varki A. (1993) Biological roles of oligosaccharides: all of the theories are correct. Glycobiology 3, 97–130 [DOI] [PMC free article] [PubMed] [Google Scholar]
- 3. Desaire H., Hua D. (2009) When can glycopeptides be assigned based solely on high resolution mass spectrometry data? Int. J. Mass Spectrom. 287, 21–26 [Google Scholar]
- 4. Johnson R. S., Taylor J. A. (2002) Searching sequence databases via de novo peptide sequencing by tandem mass spectrometry. Mol. Biotechnol. 22, 301–315 [DOI] [PubMed] [Google Scholar]
- 5. Frank A., Pevzner P. (2005) Pepnovo: de novo peptide sequencing via probabilistic network modeling. Anal. Chem. 77, 964–973 [DOI] [PubMed] [Google Scholar]
- 6. Ma B., Zhang K., Hendrie C., Liang C., Li M., Doherty-Kirby A., Lajoie G. (2003) Peaks: powerful software for peptide de novo sequencing by tandem mass spectrometry. Rapid Commun. Mass Spectrom. 17, 2337–2342 [DOI] [PubMed] [Google Scholar]
- 7. Nesvizhskii A. I. (2010) A survey of computational methods and error rate estimation procedures for peptide and protein identification in shotgun proteomics. J. Proteomics 73, 2092–2123 [DOI] [PMC free article] [PubMed] [Google Scholar]
- 8. Eng J. K., McCormack A. L., Yates J. R., 3rd (1994) An approach to correlate tandem mass spectral data of peptides with amino acid sequences in a protein database. J. Am. Soc. Mass Spectrom. 5, 976–989 [DOI] [PubMed] [Google Scholar]
- 9. Park C. Y., Klammer A. A., Käll L., MacCoss M. J., Noble W. S. (2008) Rapid and accurate peptide identification from tandem mass spectra. J. Proteome Res. 7, 3022–3027 [DOI] [PMC free article] [PubMed] [Google Scholar]
- 10. Diament B. J., Noble W. S. (2011) Faster Sequest searching for peptide identification from tandem mass spectra. J. Proteome Res. 10, 3871–3879 [DOI] [PMC free article] [PubMed] [Google Scholar]
- 11. Perkins D. N., Pappin D. J., Creasy D. M., Cottrell J. S. (1999) Probability-based protein identification by searching sequence databases using mass spectrometry data. Electrophoresis 20, 3551–3567 [DOI] [PubMed] [Google Scholar]
- 12. Clauser K. R., Baker P., Burlingame A. L. (1999) Role of accurate mass measurement (±10 ppm) in protein identification strategies employing MS or MS/MS and database searching. Anal. Chem. 71, 2871–2882 [DOI] [PubMed] [Google Scholar]
- 13. Zhang N., Aebersold R., Schwikowski B. (2002) ProbID: A probabilistic algorithm to identify peptides through sequence database searching using tandem mass spectral data. Proteomics 2, 1406–1412 [DOI] [PubMed] [Google Scholar]
- 14. Craig R., Beavis R. C. (2004) Tandem: matching proteins with tandem mass spectra. Bioinformatics 20, 1466–1467 [DOI] [PubMed] [Google Scholar]
- 15. Colinge J., Masselot A., Giron M., Dessingy T., Magnin J. (2003) OLAV: Toward high throughput tandem mass spectrometry data identification. Proteomics 3, 1454–1463 [DOI] [PubMed] [Google Scholar]
- 16. Geer L. Y., Markey S. P., Kowalak J. A., Wagner L., Xu M., Maynard D. M., Yang X., Shi W., Bryant S. H. (2004) Open mass spectrometry search algorithm. J. Proteome Res. 3, 958–964 [DOI] [PubMed] [Google Scholar]
- 17. Matthiesen R., Trelle M. B., Højrup P., Bunkenborg J., Jensen O. N. (2005) Jensen. Vems 3.0: algorithms and computational tools for tandem mass spectrometry-based identification of post-translational modifications in proteins. J. Proteome Res. 4, 2338–2347 [DOI] [PubMed] [Google Scholar]
- 18. Tabb D. L., Fernando C. G., Chambers M. C. (2007) Myrimatch: highly accurate tandem mass spectral peptide identification by multivariate hypergeometric analysis. J. Proteome Res. 6, 654–661 [DOI] [PMC free article] [PubMed] [Google Scholar]
- 19. Dutta D., Chen T. (2007) Speeding up tandem mass spectrometry database search: metric embeddings and fast near neighbor search. Bioinformatics 23, 612–618 [DOI] [PubMed] [Google Scholar]
- 20. Alves G., Ogurtsov A. Y., Yu Y. K. (2007) RAId_DbS: peptide identification using database searches with realistic statistics. Biol. Direct 2, 25. [DOI] [PMC free article] [PubMed] [Google Scholar]
- 21. Xu H., Freitas M. A. (2008) Monte Carlo simulation-based algorithms for analysis of shotgun proteomic data. J. Proteome Res. 7, 2605–2615 [DOI] [PMC free article] [PubMed] [Google Scholar]
- 22. Dallas D. C., Martin W. F., Hua S., German J. B. (2012) Automated glycopeptide analysis–review of current state and future directions. Briefings in Bioinformatics, [DOI] [PMC free article] [PubMed] [Google Scholar]
- 23. Deshpande N., Jensen P. H., Packer N. H., Kolarich D. (2010) Glycospectrumscan: Fishing glycopeptides from MS spectra of protease digests of human colostrum siga. J. Proteome Res. 9, 1063–1075 [DOI] [PubMed] [Google Scholar]
- 24. Go E. P., Rebecchi K. R., Dalpathado D. S., Bandu M. L., Zhang Y., Desaire H. (2007) Glycopep db: a tool for glycopeptide analysis using a smart search. Anal. Chem. 79, 1708–1713 [DOI] [PubMed] [Google Scholar]
- 25. Clerens S., Van den Ende W., Verhaert P., Geenen L., Arckens L. (2004) Sweet substitute: A software tool for in silico fragmentation of peptide-linked N-glycans. PROTEOMICS 4, 629–632 [DOI] [PubMed] [Google Scholar]
- 26. Irungu J., Go E. P., Dalpathado D. S., Desaire H. (2007) Simplification of mass spectral analysis of acidic glycopeptides using glycopep id. Anal. Chem. 79, 3065–3074 [DOI] [PubMed] [Google Scholar]
- 27. Ren J. M., Rejtar T., Li L., Karger B. L. (2007) N-Glycan structure annotation of glycopeptides using a linearized glycan structure database (glydb). J. Proteome Res. 6, 3162–3173 [DOI] [PMC free article] [PubMed] [Google Scholar]
- 28. Woodin C. L., Hua D., Maxon M., Rebecchi K. R., Go E. P., Desaire H. (2012) Glycopep grader: A web-based utility for assigning the composition of N-linked glycopeptides. Anal. Chem. 84, 4821–4829 [DOI] [PMC free article] [PubMed] [Google Scholar]
- 29. Mayampurath A. M., Wu Y., Segu Z. M., Mechref Y., Tang H. (2011) Improving confidence in detection and characterization of protein N-glycosylation sites and microheterogeneity. Rapid Commun. Mass Spectrom. 25, 2007–2019 [DOI] [PubMed] [Google Scholar]
- 30. Manza L. L., Stamer S. L., Ham A. J., Codreanu S. G., Liebler D. C. (2005) Sample preparation and digestion for proteomic analyses using spin filters. Proteomics 5, 1742–1745 [DOI] [PubMed] [Google Scholar]
- 31. Kessner D., Chambers M., Burke R., Agus D., Mallick P. (2008) Proteowizard: open source software for rapid proteomics tools development. Bioinformatics 24, 2534–2536 [DOI] [PMC free article] [PubMed] [Google Scholar]
- 32. Feldman M. F., Wacker M., Hernandez M., Hitchen P. G., Marolda C. L., Kowarik M., Morris H. R., Dell A., Valvano M. A., Aebi M. (2005) Engineering N-linked protein glycosylation with diverse O antigen lipopolysaccharide structures in Escherichia coli. Proc. Natl. Acad. Sci. U.S.A. 102, 3016–3021 [DOI] [PMC free article] [PubMed] [Google Scholar]
- 33. Serang O., Paulo J., Steen H., Steen J. A. (2013) A Non-Parametric Cutout Index for Robust Evaluation of Identified Proteins, Mol Cell Proteomics, 12, 807–812 [DOI] [PMC free article] [PubMed] [Google Scholar]
- 34. Serang O., Mollinari M., Garcia A. A. (2012) Efficient exact maximum a posteriori computation for Bayesian SNP genotyping in polyploids. PLoS ONE 7, e30906. [DOI] [PMC free article] [PubMed] [Google Scholar]
- 35. Serang O., Moruz L., Hoopmann M. R., Käll L. (2012) Recognizing uncertainty increases robustness and reproducibility of mass spectrometry-based protein inferences. J. Proteome Res. 11, 5586–5591 [DOI] [PMC free article] [PubMed] [Google Scholar]