Abstract
Optical imaging and spectroscopy have emerged as effective tools for detecting malignant changes associated with oral cancer. While clinical studies have demonstrated high sensitivity and specificity for detection, current devices either interrogate a small region or can have reduced performance for some benign lesions. We describe a snapshot imaging spectrometer that combines the large field-of-view of widefield imaging with the diagnostic strength of spectroscopy. The portable device can stream RGB images at 7.2 frames per second and record both autofluorescence and reflectance spectral datacubes in < 1 second. We report initial data from normal volunteers and oral cancer patients.
OCIS codes: (170.0170) Medical optics and biotechnology; (170.6510) Spectroscopy, tissue diagnostics; (110.4234) Multispectral and hyperspectral imaging
1. Introduction
Oral cancer is a significant global health problem. In the US alone, around 40,000 people will be diagnosed with oral cancer and 8,000 will die from the disease this year [1,2]. More than one third of individuals diagnosed with oral cancer will die within five years, because it is typically discovered in a later stage when treatment is less effective. Unfortunately, these numbers have not improved for decades. Although the need for early diagnosis is clear, there are many factors that contribute to delay. The standard screening practice for oral cancer is visual inspection and palpation. During this procedure, clinicians check for abnormal lesions such as leukoplakia and erythroplakia, which appear as white and red patches in the oral cavity [3]. These lesions can be confused with benign conditions such as lichen planus, inflammation, and hyperkeratosis. Therefore, localized oral cancer may appear benign to a physician until an advanced stage. Lesions that are suspicious should be biopsied for histopathology, but physicians and patients are often unwilling to proceed with invasive biopsies especially when the expected yield is low. Biopsies also take time to process and examine, adding to patient stress and prolonging the time to diagnosis. When a biopsy is obtained, the small tissue region being sampled may not represent the highest pathological grade of a heterogeneous tumor [4].
Screening with optical imaging and spectroscopy has the potential to improve oral cancer diagnostics, while also lessening time and discomfort associated with traditional procedures. This is accomplished through non-invasive measurements that detect morphological and biochemical alterations which occur during cancer progression. For example, epithelial cancers are associated with degradation of stromal collagen as well as increased epithelial metabolism [5]. These alterations can be identified within autofluorescence spectra of the tissue by using a point spectrometer. Cancer is also associated with angiogenesis, which can affect both autofluorescence and reflectance spectra. Several clinical studies have used depth-sensitive point spectrometers to detect the associated spectral changes. One study of 46 subjects and 119 sites found that spectral shape, intensity, and peak wavelength can be used to classify oral cavity lesions with 82% sensitivity and 87% specificity in a validation set [6,7]. Another method, called Trimodal spectroscopy, incorporates additional diffuse reflectance measurements, which provides information regarding tissue absorption and structure, such as hemoglobin concentration and stromal collagen density. Results from this technique showed 96% sensitivity and specificity in distinguishing cancerous/dysplastic from normal tissue. In addition, the technique could distinguish dysplastic from cancerous tissue with a sensitivity of 64% and a specificity of 90% [8]. However, the small sampling area of these spectroscopic techniques makes it is difficult to screen the entire oral cavity for disease.
Another modality called widefield autofluorescence imaging can screen several centimeters of tissue at one time. When excited with blue light, normal tissue emits a pale blue/green autofluorescence that can be detected visually or with an image detector array. Dysplastic and cancerous regions with reduced autofluorescence appear dark-brown [9]. One such widefield autofluorescence device called the VELscope (LED Dental, Burnaby, Canada) is now FDA approved as an aid for oral cancer detection [10–12]. In one study, the VELscope identified 196 of 203 (97%) cases of severe dysplasia / carcinoma in situ (CIS) and invasive cancer using loss of autofluorescence, as well as 59 of 76 (78%) cases of low-grade (mild/moderate) dysplasia [13]. The device has also been used to delineate tumor margins. In a 2006 study, the device showed reduced autofluorescence beyond the clinically visible tumor in 19 out of 20 specimens. Biopsies from margins with reduced autofluorescence revealed dysplasia or cancer in 32 of 36 sites (89%) [10]. While the effectiveness of widefield autofluorescence imaging shows potential for detection of oral cancers and delineation of tumor margins, acquiring additional spectral information may increase specificity when imaging benign lesions, especially in a low-risk screening population.
An ideal approach for early cancer diagnostics could be to combine widefield imaging with spectral acquisition. This can be accomplished with spectral imaging, which is an optical modality that collects a full set of spatial and spectral information called a “datacube.” Although hyper- and multispectral imaging has been used extensively in the fields of remote sensing, astronomy, and food inspection, spectral imaging for cancer diagnostics is relatively new. Most current imaging spectrometers require a scanning mechanism to sequentially collect spatial and spectral data, which can be time consuming and impractical for clinical applications. For example, devices that employ a standard CCD coupled to a scanning liquid crystal tunable filter were be used to recover oxy/deoxy-hemoglobin spectra, which enabled imaging of vascular activity, oxygen saturation, scattering, and absorption in vivo over the entire tissue region [14]. These peaks cannot be distinguished using a conventional three-color CCD. However, the devices require long exposure times and binning for adequate light collection. Another clinical imaging device, built specifically for multispectral imaging of the oral cavity, uses motorized filter wheels for sequential acquisition. The Multispectral Digital Microscope obtains ten narrowband, parallel- and cross-polarized, and white-light images at four exposure settings with an acquisition time of one minute [9,15,16]. However, scanning through spectral filters results in image misalignment. Long exposure times also cause motion blur that possibly reduces accuracy of spatial/spectral features in the data set. In another study, the authors also suggested the benefit of more spectral samples [17], because autofluorescence changes associated with cancer progression can be better visualized with a full spectrum [7].
In this manuscript we present a new type of clinical imaging spectrometer that captures all spatial and spectral data simultaneously with efficient light throughput. The device can collect multimodal data in autofluorescence or reflectance modes, in order to measure different morphological and biochemical alterations associated with cancer progression. Multimodal datacubes with 350 x 355 spatial x 41 spectral samples were acquired with a recording time of < 1 second. Therefore, the device captures >200 thousand spectra per acquisition. We assess the diagnostic value of the multimodal device with a pilot study of eleven oral cancer patients. Spectral images and spectra are shown for several normal and abnormal regions and preliminary analysis is presented.
2. Methods
2.1 Instrumentation
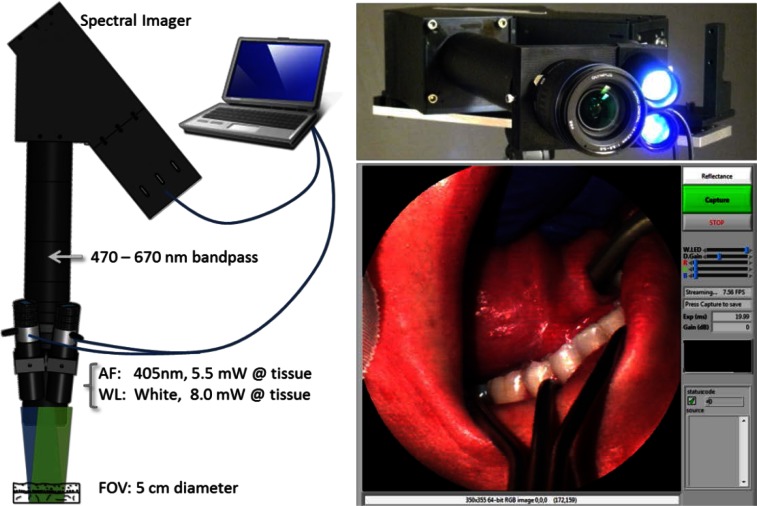
We built a multimodal snapshot imaging spectrometer based on a research instrument called the Image Mapping Spectrometer (IMS). The IMS has been used for live cell microscopy [18], animal imaging [19], ophthalmology [20], and endoscopy [21]. The study shown here is the first multi-patient clinical trial with the device. We modified the instrument to be more amenable to clinical research by making it compact, portable, rugged, and user-friendly. Briefly, we mounted the device to a portable tripod, attached a camera lens for wide-field imaging, and developed software-controlled illumination and acquisition (see Fig. 1).
Fig. 1.
The snapshot spectral imager has LEDs for autofluorescence (AF) and reflectance (WL) imaging. It collects 350 x 350 spatial x 41 spectral points simultaneously and is controlled with LabVIEW on a laptop computer.
Although the operational principle and performance of the IMS was previously described [22,23], we provide a short list of specifications in Table 1. The device is capable of recording 350 x 355 spatial x 41 spectral samples simultaneously with 58% light throughput at a maximum rate of 7.2 frames per second (FPS). A 3X zoom lens was attached to the existing distal optics of the IMS to obtain a FOV of 3 – 5 cm within the oral cavity. The spectral range was limited to 471 - 667 nm by a bandpass filter placed behind the camera lens. These wavelengths were selected because they contain spectral peaks of autofluorescence emission (i.e. collagen, NADH, FAD) and reflectance features (i.e. oxy- and deoxy-hemoglobin). To provide reflectance and autofluorescence excitation of the tissue, we used two high-power light emitting diodes (LEDs). A 10 W 405 nm (blue) LED was selected for autofluorescence excitation, as this wavelength has been shown to significantly increase contrast of emission from normal/abnormal lesions; also, this wavelength is blocked by the bandpass filter [9]. A 5 W broadband white LED was selected for reflectance imaging. The LED intensities were controlled with a USB data acquisition device.
Table 1. Specifications for the Snapshot Imaging Spectrometer.
| Parameter | Specification |
|---|---|
| Field of View | ~5 cm diameter |
| Working Distance | 10 – 20 cm (adjustable zoom lens) |
| Spatial Sampling | 350 x 355 pixels |
| Spatial Resolution | ~200 µm |
| Spectral Range | 471 – 667 nm |
| Spectral Sampling | 41 pixels |
| Spectral Resolution | 6 – 16 nm |
| Frame Rate | Up to 7.2 FPS |
| Pixel Size | 7.4 x 14.8 µm2 |
| Bit Depth | 12 bit |
| Blue LED | 405 nm, 10 W, 5.5 mW @ tissue |
| White LED | broadband, 5 W, 8 mW @ tissue |
The illumination system, camera acquisition, and image display were synchronized using a custom LabVIEW interface. Shown in Fig. 1, this program allows the user to switch between autofluorescence and reflectance imaging modes, adjust LED intensity, change display gain and color balance, and save datacubes. A real-time RGB representation of the datacube is also displayed. To match image display rate with the 7.2 FPS frame rate of the camera, we chose to display a streaming color representation of the datacube using only three spectral images (corresponding to red, green, and blue color channels). However, the entire datacube is recorded when the user saves an image. The complete acquisition sequence (1) records the reflectance datacube and RGB image, (2) turns the white LED off and blue LED on, (3) adjusts camera exposure and gain, and (4) records the autofluorescence datacube and RGB image.
Raw data from the IMS is a single encoded camera frame that contains all spatial and spectral information. Data must be reconstructed into a datacube using a custom calibration procedure, as described in [23]. The device was also flat-field corrected in order to account for small defects within the optical train. Flat-fielding was performed in reflectance mode using a certified reflectance standard (Spectralon) and a tungsten lamp. The spectra of the tungsten lamp was also recorded with a point spectrometer and used to normalize the IMS spectra [23].
2.2 Pilot clinical study design
The device was first tested on normal volunteers at Rice University under IRB protocol 11-218E. Images were acquired under Rice University protocol 07-62F and MD Anderson Cancer Center protocol 2006-0673. All tissue was illuminated in compliance with guidelines for UV/VIS exposure. Patients having abnormal tissue resected from the oral cavity were considered eligible for the study. Data was collected in vivo from consenting patients. When possible, data was collected from the lesions and clinically normal imaged sites, and biopsies were obtained from the lesion and the normal sites for pathological examination.
3. Results
3.1 Device characterization
Although the imaging spectrometer was thoroughly characterized for other applications [23], the modified device was further evaluated for spatial resolution, color balance, excitation light rejection, and recording speed. Using a 1951 USAF resolution target we found the device could resolve 200 µm features. A Macbeth ColorChecker chart was used to assess color balance of true-color reflectance datacube images. Fluorescence spectra were verified with measurements from a fluorescence calibration standard (Rhodamine dye, 2 mg/L). Rejection of excitation light was verified with a quartz disc, which showed less than 1:10 fluorescence ratio compared to the autofluorescence of normal tissue. The time to acquire a sequence of reflectance and autofluorescence datacubes was also calculated. This metric is important because movement of the patient, clinician, or researcher during a long acquisition can cause motion blur or misregistration of spectral images. The device was set to capture reflectance and autofluorescence datacubes at 100 ms and 500 ms exposure (with 0 dB and 20 dB gain), respectively. It took approximately 300 ms to adjust camera exposure/gain settings and to change white/blue LED intensities. Therefore, the total time to record both multimodal spectral datacubes, consisting of 41 x 2 spectral images, was < 1 second. Spectral images within each datacube have > 99% coregistration [23].
3.2 Pilot clinical study summary
Data are shown from 11 patients and 20 sites. Only measured sites with histopathology were included in the analysis. One site was excluded because of crosstalk from tooth autofluorescence. Table 2 summarizes the number of measurements acquired for different anatomical locations. Clinical impression (rendered by an experienced head and neck oncologic surgeon) and histopathological diagnosis (determined by an experienced head and neck pathologist) were determined for each site. Clinical impression fell into one of four categories: normal, abnormal low risk, abnormal high risk, and cancer. Histopathological diagnosis fell into one of five categories: normal, mild dysplasia, moderate dysplasia, severe dysplasia / carcinoma in situ (CIS), and invasive cancer. Any histopathologic category could also include hyperkeratosis, hyperplasia, and/or inflammation. Table 3 summarizes the clinical impression versus histopathologic diagnosis for all sites in the study. Of particular interest were sites where clinical impression and diagnosis did not match, because these indicated either clinically unsuspicious malignant lesions (false negatives) or clinically suspicious benign lesions (false positives). For example, three sites that appeared as low risk by clinical impression were found to be dysplasia or cancer by histopathology.
Table 2. Anatomic Sites of ROIs in the Dataset.
| Location | Tongue | Buccal | Fl. of Mouth | Gingiva | Lip | Palate | Total | ||
| Sites (%) | 11 (55) | 1 (5) | 3 (15) | 3 (15) | 1 (5) | 1 (5) | 20 (100) |
Table 3. Clinical Impression versus Histopathological Diagnosis for 24 Biopsy Sites.
|
Clinical Impression |
|||||
|---|---|---|---|---|---|
| Histopathological Diagnosis | Normal | Abnormal, Low Risk | Abnormal, High Risk | Cancer | Total |
| Normal | 5 | — | — | — | 5 (25) |
| Mild Dysplasia | 2 | — | — | — | 2 (10) |
| Moderate Dysplasia | — | 1 | — | — | 1 (5) |
| Severe Dysplasia/CIS | — | 1 | 1 | — | 2 (10) |
| Cancer | — | 1 | 1 | 8 | 10 (50) |
3.3 Spectral imaging results
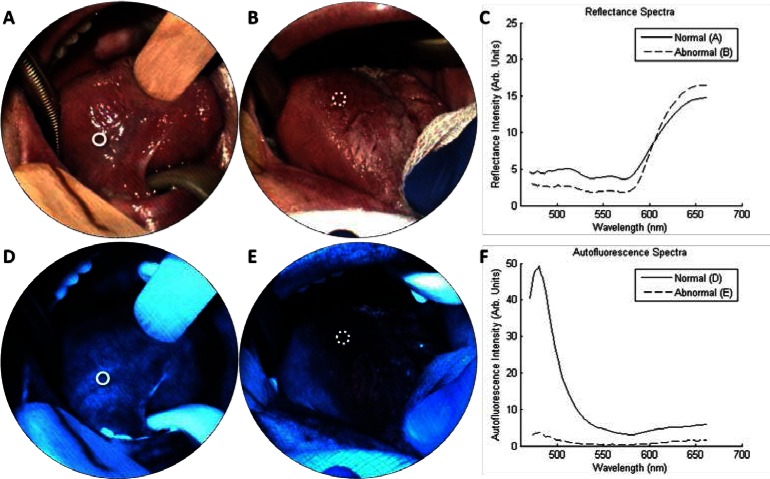
Figure 2 presents example data obtained from the multimodal imaging spectrometer. Figures 2(a) and 2(d) show true-color images obtained from the right ventral tongue, which were reconstructed from the reflectance and autofluorescence datacubes, respectively. The autofluorescence images reveal a bright blue/green emission that is consistent with the appearance of normal tissue obtained with standard widefield autofluorescence imaging [10]. Similarly, autofluorescence spectra from the site (Fig. 2(f), “normal”) exhibit a strong blue peak, which is consistent with measurements of normal tissue from point spectrometers [6,7]. Clinical impression and histology from a biopsy (white circle) confirm the normal diagnosis. Figures 2(b) and 2(e) show results from another site (dotted circle) in the same patient with clinical impression “erythroplakia, abnormal high risk” and histopathological diagnosis of “cancer.” Here the autofluorescence image and spectra reveal a distinct reduction of blue/green fluorescence (Fig. 2(f), “abnormal”). Reflectance spectra (Fig. 2(c)) contain characteristic hemoglobin features in the range 540 - 580 nm. The striping artifact in the images is caused by slight variations in the IMS’s optical train. A detailed explanation of this artifact and its effect on the measured spectra is provided in [23]. In brief, facet defocus reduces spectra resolution, but this does not affect the locations of spectral peaks.
Fig. 2.
Spectral imaging from the tongue of one patient with erythroplakia. (a, d) show the right ventral tongue in reflectance and autofluorescence modes, respectively, which had a clinical impression of “normal.” A biopsy (solid circle) indicated normal epithelium. (b, e) show an erythroplakia on the right dorsal tongue, which had a clinical impression of “abnormal high risk.” A biopsy (dotted circle) indicated squamous cell carcinoma. Reflectance spectra (c) contain characteristic oxy-hemoglobin peaks. Autofluorescence images and spectra from the biopsy region (f) show loss of blue fluorescence in the abnormal site.
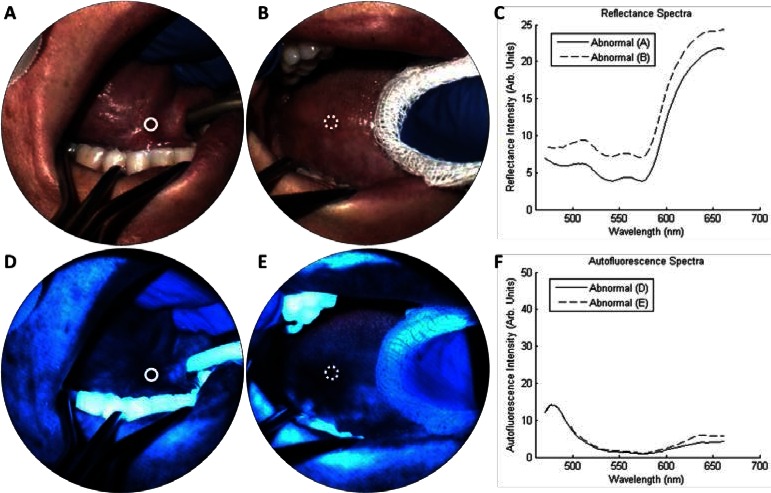
Figure 3 presents spectral imaging results from two precancerous sites in a single patient. Figures 3(a) and 3(d) show reflectance and autofluorescence results from the right anterior floor of mouth, which contains a region of erythroplakia. Autofluorescence imaging and spectra (Figs. 3(d) and 3(f)) both indicate low blue/green emission. Clinical impression of the site (solid circle) was “abnormal high risk” and graded “severe dysplasia” by histopathology. Figures 3(b) and 3(e) show images of a leukoplakia on the right lateral tongue. Autofluorescence results again indicated low blue/green emission. Clinical impression of the site (dashed circle) was “abnormal low risk,” however, histopathological diagnosis graded the site as “moderate dysplasia.”
Fig. 3.
Spectral imaging from one patient with multiple lesions. (a, d) show an erythroplakia on the right anterior floor of mouth, which had a clinical impression of “abnormal high risk.” A biopsy (solid circle) indicated severe dysplasia. (b, e) show a leukoplakia on the right lateral tongue, which had a clinical impression of “abnormal low risk.” A biopsy (dotted circle) indicated moderate dysplasia. (c, f) show the IMS reflectance and autofluorescence spectra, respectively, from the circled ROIs.
3.4 Spectral measurements
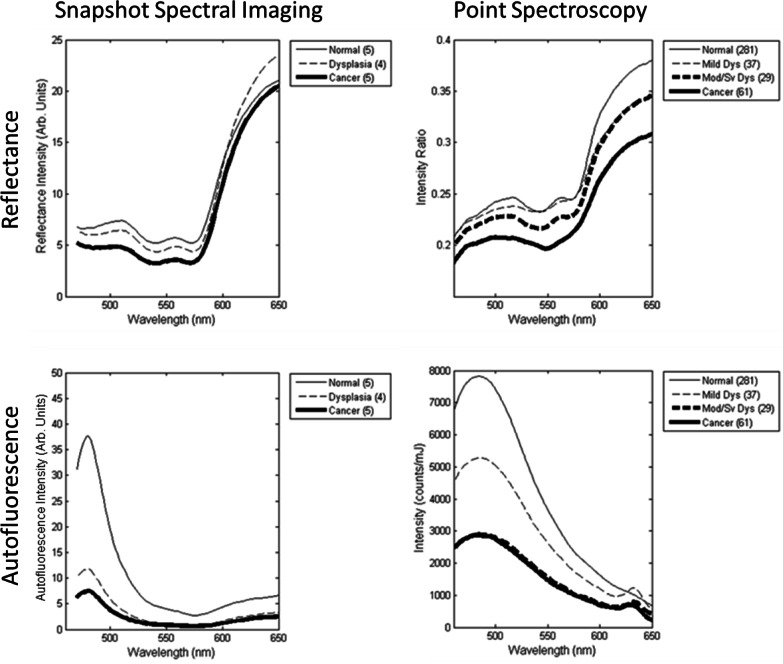
Spectral trends from IMS measurements were analyzed by categorizing spectra based on clinical impression and histopathological diagnosis. First, a region of interest for each biopsy site (i.e. white circle in Figs. 2 and 3) was selected on the reflectance true-color images by the surgeon. The average autofluorescence and reflectance spectra were then calculated for pixels contained within the biopsy region. Next, a pathologist classified each biopsy according to the worst pathological grade; in cases where a biopsy and surgical specimen were obtained, the worst pathological grade was selected. Finally, the spectra from biopsy sites of three histopathological grades (normal, dysplasia, and cancer) were averaged. Figure 4 (“Snapshot Spectral Imaging”) presents average spectra for non-keratinized biopsy sites for the three histopathological diagnoses. The average autofluorescence spectra of abnormal tissue show an overall decrease in intensity and a relative decrease in blue/green intensity. An increase in relative red intensity is also apparent. Keratinized biopsy sites show a much larger increase in red fluorescence, which is most likely caused by porphyrins in bacteria colonizing the tissue (for example, see Fig. 6(b)) [15]. Reflectance spectra show characteristic hemoglobin absorption features, and can be used for specialized classification techniques, as shown in the following section.
Fig. 4.
Comparison of average spectra for different histopathological diagnoses. Data is shown for snapshot spectral imaging (left) and point spectroscopy from a previous clinical trial of 408 sites (right). All sites were nonkeratinized.
Fig. 6.
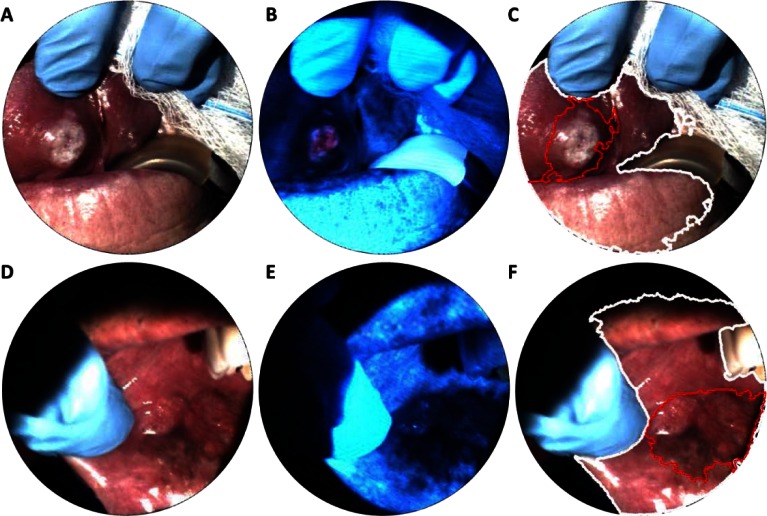
Spectral imaging from two patients with invasive carcinoma. Although the lesion in (a, d) is clearly visible, loss of autofluorescence in (b, e) shows boundaries not as apparent with traditional white light imaging. Spectral analysis (c, f) was used to determine the tissue region (white line) with areas of reduced autofluorescence highlighted (red line).
Figure 4 (“Point Spectroscopy”) shows the average autofluorescence spectra from a point spectrometer for qualitative comparison [7]; these measurements represent the average spectra obtained from 408 non-keratinized sites in a previous clinical study, categorized by histopathological diagnosis. In this data, the excitation wavelength for fluorescence measurements with the point spectrometer was 410 nm and the tissue was measured with a contact probe. By comparison, autofluorescence data from the IMS was obtained with a 405 nm LED and in a widefield imaging mode. The IMS spectra resemble spectra from the depth-sensitive point spectrometer’s deep channel more than the shallow or medium channel (not shown), which suggests the IMS acquires autofluorescence from throughout the epithelium and stroma. IMS spectra may differ from point spectrometer spectra because of the IMS’s lower spectral resolution and sampling, inherent differences in light illumination/collection geometry in each device, and different illumination wavelengths. A thorough characterization of the spectral accuracy and shape from IMS data is shown in [23].
3.5 Spectral image analysis
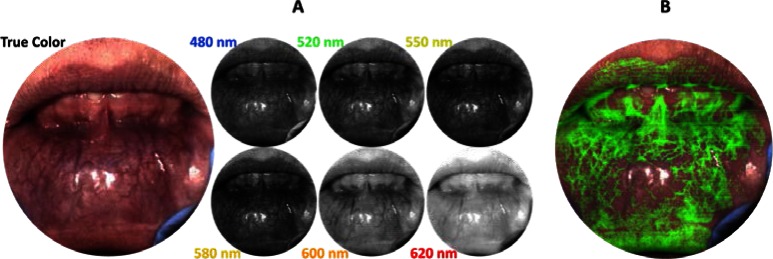
In addition to visualizing true-color images and individual spectra, the spatial-spectral datacube from the snapshot imaging spectrometer can be used for more advanced data analysis. For example, Fig. 5(a) shows reflectance spectral images from the lower lip of a normal volunteer, where vascularity patterns can be visualized at different depths corresponding to wavelength. This effect is caused by the dependence of wavelength on light penetration depth into tissue. While a similar affect was shown in [15], here the full data set is coregistered and obtained in 100 ms. Although we do not examine vascularity patterns with respect to pathological diagnosis in this manuscript, Edelstein et al. showed that oral vascular density is an important biomarker for some types of cancer [24].
Fig. 5.
(a) Spectral imaging from the lower lip of a normal volunteer. The snapshot reflectance datacube can be used to visualize vasculature of different sizes and depths. (b) Spectral unmixing can be used to increase contrast of vasculature in the image.
Another type of analysis that utilizes a spatial-spectral datacube is called spectral image processing. Standard image processing can identify texture, morphology, or RGB color features in order to determine a region of interest. In addition to these features, spectral image processing enables multi-dimensional and spectral analysis algorithms [25]. One technique, called spectral linear unmixing, can be used to computationally separate relative contributions of reference spectra in a datacube. In Fig. 5(b), an average measured spectrum for blood vessels was used with spectral linear unmixing to highlight vascularity with a green overlay. In Fig. 6, spectral image processing was used to automatically identify suspicious regions of interest in two sites of invasive carcinoma. First, an average reflectance spectrum was determined for all biopsy sites in the pilot study. Next, the linear correlation coefficient was calculated for every x-y coordinate in a given reflectance datacube with respect to the reference spectra. The result was then used to automatically highlight oral mucosa and skin. Figures 6(c) and 6(f) (white line) show the boundary of regions with a correlation coefficient > 0.98, which effectively delineates tissue regions. The algorithm performed similarly for other images in the data set. Abnormal tissue was identified by thresholding the blue region (475 – 485 nm) of normalized autofluorescence spectra. Figures 6(c) and 6(f) (red line) show the boundary of tissue identified as abnormal.
4. Discussion
The results from this study demonstrate diagnostic features obtained with a snapshot imaging spectrometer with potential clinical utility for diagnosis and management of oral cancer and precancer. In addition to acquiring color images and individual spectra, snapshot spectral imaging can enable real-time spectral analysis over an entire tissue region with high spatial resolution, extending the diagnostic potential of that reported from other optical devices used in the oral cavity [7,13,16]. Several applications in remote sensing have proved that spectral imaging can be used for more selective classification than with standard imaging alone [26]. In this study, we acquired spectral data in real-time and showed that offline spectral image analysis can be used for linear unmixing, correlation spectroscopy, and spectral thresholding [18,20,23]. Results from this pilot study also show that real-time spectral data acquisition is feasible for in vivo oral cancer imaging (Fig. 6). In the future, we plan to implement real-time spectral analysis for oral cancer diagnostics. Such analysis was not previously possible because spectral imaging devices typically suffer from low speed, low light-throughput, and/or motion artifacts. A larger clinical study will determine the most significant spectral bands in autofluorescence and reflectance for widefield disease classification, and estimate the sensitivity and specificity for lesion characterization in different clinical populations.
Snapshot spectral imaging devices will also play a vital role for emerging optical modalities that require spatial-spectral information. For example, Cuccia et al. developed a modulated imaging technique that requires several spectral samples from a reflectance image. Using the spectral images and a Monte Carlo model, the scattering and absorption coefficients in tissue can be determined in vivo [27,28]. Previously, modulated imaging was performed with scanning spectral filters or computed tomography [29], which required long exposure times or slow image reconstruction, respectively. Preliminary studies have shown that modulated imaging with our image mapping spectrometer can obtain diffuse reflectance, absorption coefficient, and reduced scattering coefficient in tissue [19]. These properties have been related to classification features for oral cancer diagnostics [8]. In the future, the combination of snapshot spectral imaging with new optical modalities could provide novel diagnostic techniques for oral cancer.
Finally, this work demonstrates that multimodal spectral imaging (i.e. reflectance and autofluorescence) can be used for combined spectral analysis in the oral cavity. As a proof of concept, we used correlation analysis of the reflectance spectra to segment tissue within the image, and then the autofluorescence spectra to highlight suspicious regions. Another type of spectral analysis, linear unmixing, was used with our imaging spectrometer to extract relative oxy/deoxy-hemoglobin concentrations and tissue oxygenation from reflectance measurements of the skin [23]. Ongoing studies aim to extract a full set of tissue properties, including: autofluorescence features (i.e. collagen breakdown and porphyrin content), reflectance features (i.e. oxy/deoxy-hemoglobin content and oxygen saturation), and diffuse features (i.e. scattering and absorption) over the entire oral cavity in vivo.
5. Conclusion
We report on the development and initial clinical testing of a novel device for point-of-care oral cancer diagnostics. The study demonstrates simultaneous acquisition of spatial-spectral tissue properties over 5 cm2 in autofluorescence or reflectance modes. In the future, clinical studies with increased patient size and in combination with additional optical modalities may enable non-invasive detection of oral malignancies with improved sensitivity and specificity.
Acknowledgments
The authors would like to thank Sharon Mondrik, Jason Dwight, and Dr. Matthew Kyrish for assistance with data collection. This work was supported by the National Institutes of Health (NIH) research grants R01CA124319 and R21EB009186.
References and links
- 1.Jemal A., Siegel R., Xu J., Ward E., “Cancer statistics, 2010,” CA Cancer J. Clin. 60(5), 277–300 (2010). 10.3322/caac.20073 [DOI] [PubMed] [Google Scholar]
- 2.Chaturvedi A. K., Engels E. A., Pfeiffer R. M., Hernandez B. Y., Xiao W., Kim E., Jiang B., Goodman M. T., Sibug-Saber M., Cozen W., Liu L., Lynch C. F., Wentzensen N., Jordan R. C., Altekruse S., Anderson W. F., Rosenberg P. S., Gillison M. L., “Human papillomavirus and rising oropharyngeal cancer incidence in the United States,” J. Clin. Oncol. 29(32), 4294–4301 (2011). 10.1200/JCO.2011.36.4596 [DOI] [PMC free article] [PubMed] [Google Scholar]
- 3.Epstein J. B., Güneri P., Boyacioglu H., Abt E., “The limitations of the clinical oral examination in detecting dysplastic oral lesions and oral squamous cell carcinoma,” J. Am. Dent. Assoc. 143(12), 1332–1342 (2012). [DOI] [PubMed] [Google Scholar]
- 4.Slaughter D. P., Southwick H. W., Smejkal W., “Field cancerization in oral stratified squamous epithelium; clinical implications of multicentric origin,” Cancer 6(5), 963–968 (1953). [DOI] [PubMed] [Google Scholar]
- 5.Pavlova I., Williams M., El-Naggar A., Richards-Kortum R., Gillenwater A., “Understanding the biological basis of autofluorescence imaging for oral cancer detection: high-resolution fluorescence microscopy in viable tissue,” Clin. Cancer Res. 14(8), 2396–2404 (2008). 10.1158/1078-0432.CCR-07-1609 [DOI] [PMC free article] [PubMed] [Google Scholar]
- 6.Schwarz R. A., Gao W., Daye D., Williams M. D., Richards-Kortum R., Gillenwater A. M., “Autofluorescence and diffuse reflectance spectroscopy of oral epithelial tissue using a depth-sensitive fiber-optic probe,” Appl. Opt. 47(6), 825–834 (2008). 10.1364/AO.47.000825 [DOI] [PMC free article] [PubMed] [Google Scholar]
- 7.Schwarz R. A., Gao W., Redden Weber C., Kurachi C., Lee J. J., El-Naggar A. K., Richards-Kortum R., Gillenwater A. M., “Noninvasive evaluation of oral lesions using depth-sensitive optical spectroscopy,” Cancer 115(8), 1669–1679 (2009). 10.1002/cncr.24177 [DOI] [PMC free article] [PubMed] [Google Scholar]
- 8.Müller M. G., Valdez T. A., Georgakoudi I., Backman V., Fuentes C., Kabani S., Laver N., Wang Z., Boone C. W., Dasari R. R., Shapshay S. M., Feld M. S., “Spectroscopic detection and evaluation of morphologic and biochemical changes in early human oral carcinoma,” Cancer 97(7), 1681–1692 (2003). 10.1002/cncr.11255 [DOI] [PubMed] [Google Scholar]
- 9.Roblyer D., Kurachi C., Stepanek V., Williams M. D., El-Naggar A. K., Lee J. J., Gillenwater A. M., Richards-Kortum R., “Objective detection and delineation of oral neoplasia using autofluorescence imaging,” Cancer Prev. Res. (Phila.) 2(5), 423–431 (2009). 10.1158/1940-6207.CAPR-08-0229 [DOI] [PMC free article] [PubMed] [Google Scholar]
- 10.Poh C. F., Zhang L., Anderson D. W., Durham J. S., Williams P. M., Priddy R. W., Berean K. W., Ng S., Tseng O. L., MacAulay C., Rosin M. P., “Fluorescence visualization detection of field alterations in tumor margins of oral cancer patients,” Clin. Cancer Res. 12(22), 6716–6722 (2006). 10.1158/1078-0432.CCR-06-1317 [DOI] [PubMed] [Google Scholar]
- 11.Poh C. F., Ng S. P., Williams P. M., Zhang L., Laronde D. M., Lane P., Macaulay C., Rosin M. P., “Direct fluorescence visualization of clinically occult high-risk oral premalignant disease using a simple hand-held device,” Head Neck 29(1), 71–76 (2007). 10.1002/hed.20468 [DOI] [PubMed] [Google Scholar]
- 12.Matsumoto K., “Detection of potentially malignant and malignant lesions of oral cavity using autofluorescence visualization device,” Kokubyo Gakkai Zasshi 78(2), 73–80 (2011). [PubMed] [Google Scholar]
- 13.Poh C. F., MacAulay C. E., Laronde D. M., Williams P. M., Zhang L., Rosin M. P., “Squamous cell carcinoma and precursor lesions: diagnosis and screening in a technical era,” Periodontol. 2000 57(1), 73–88 (2011). 10.1111/j.1600-0757.2011.00386.x [DOI] [PMC free article] [PubMed] [Google Scholar]
- 14.Zuzak K. J., Schaeberle M. D., Lewis E. N., Levin I. W., “Visible reflectance hyperspectral imaging: characterization of a noninvasive, in vivo system for determining tissue perfusion,” Anal. Chem. 74(9), 2021–2028 (2002). 10.1021/ac011275f [DOI] [PubMed] [Google Scholar]
- 15.Roblyer D., Richards-Kortum R., Sokolov K., El-Naggar A. K., Williams M. D., Kurachi C., Gillenwater A. M., “Multispectral optical imaging device for in vivo detection of oral neoplasia,” J. Biomed. Opt. 13(2), 024019 (2008). 10.1117/1.2904658 [DOI] [PMC free article] [PubMed] [Google Scholar]
- 16.Roblyer D., Kurachi C., Stepanek V., Schwarz R. A., Williams M. D., El-Naggar A. K., Lee J. J., Gillenwater A. M., Richards-Kortum R., “Comparison of multispectral wide-field optical imaging modalities to maximize image contrast for objective discrimination of oral neoplasia,” J. Biomed. Opt. 15(6), 066017 (2010). 10.1117/1.3516593 [DOI] [PMC free article] [PubMed] [Google Scholar]
- 17.Roblyer D., Kurachi C., Gillenwater A., Richards-Kortum R., “In vivo fluorescence hyperspectral imaging of oral neoplasia,” Proc. SPIE 7169, 71690J–, 71690J-10. (2009). 10.1117/12.807226 [DOI] [Google Scholar]
- 18.L. Gao, A. Elliot, R. Kester, N. Hagen, D. Piston, and T. Tkaczyk, “Real-time hyperspectral imaging of pancreatic β-cell dynamics with Image Mapping Spectrometer (IMS),” in Optics in the Life Sciences, OSA Technical Digest (CD) (Optical Society of America, 2011), paper BWC4. [Google Scholar]
- 19.Hagen N., Bedard N., Mazhar A., Konecky S., Tromberg B., Tkaczyk T., “Spectrally-resolved imaging of dynamic turbid media,” Proc. SPIE 7892, 789206–, 789206-7. (2011). 10.1117/12.875406 [DOI] [Google Scholar]
- 20.Gao L., Smith R. T., Tkaczyk T. S., “Snapshot hyperspectral retinal camera with the Image Mapping Spectrometer (IMS),” Biomed. Opt. Express 3(1), 48–54 (2012). 10.1364/BOE.3.000048 [DOI] [PMC free article] [PubMed] [Google Scholar]
- 21.Kester R. T., Bedard N., Gao L., Tkaczyk T. S., “Real-time snapshot hyperspectral imaging endoscope,” J. Biomed. Opt. 16(5), 056005 (2011). 10.1117/1.3574756 [DOI] [PMC free article] [PubMed] [Google Scholar]
- 22.Gao L., Kester R. T., Hagen N., Tkaczyk T. S., “Snapshot Image Mapping Spectrometer (IMS) with high sampling density for hyperspectral microscopy,” Opt. Express 18(14), 14330–14344 (2010). 10.1364/OE.18.014330 [DOI] [PMC free article] [PubMed] [Google Scholar]
- 23.Bedard N., Hagen N., Gao L., Tkaczyk T. S., “Image mapping spectrometry: calibration and characterization,” Opt. Eng. 51(11), 111711 (2012). 10.1117/1.OE.51.11.111711 [DOI] [PMC free article] [PubMed] [Google Scholar]
- 24.Edelstein D. L., Giardiello F. M., Basiri A., Hylind L. M., Romans K., Axilbund J. E., Cruz-Correa M., Ramella-Roman J. C., “A new phenotypic manifestation of familial adenomatous polyposis,” Fam. Cancer 10(2), 309–313 (2011). 10.1007/s10689-011-9432-3 [DOI] [PMC free article] [PubMed] [Google Scholar]
- 25.Dickinson M. E., Bearman G., Tille S., Lansford R., Fraser S. E., “Multi-spectral imaging and linear unmixing add a whole new dimension to laser scanning fluorescence microscopy,” Biotechniques 31(6), 1272–1278 (2001). [DOI] [PubMed] [Google Scholar]
- 26.Vane G., Green R., Chrien T., Enmark H., Hansen E., Porter W., “The airborne visible/infrared imaging spectrometer (AVIRIS),” Remote Sens. Environ. 44(2–3), 127–143 (1993). 10.1016/0034-4257(93)90012-M [DOI] [Google Scholar]
- 27.Cuccia D. J., Bevilacqua F., Durkin A. J., Ayers F. R., Tromberg B. J., “Quantitation and mapping of tissue optical properties using modulated imaging,” J. Biomed. Opt. 14(2), 024012 (2009). 10.1117/1.3088140 [DOI] [PMC free article] [PubMed] [Google Scholar]
- 28.Cuccia D. J., Bevilacqua F., Durkin A. J., Tromberg B. J., “Modulated imaging: quantitative analysis and tomography of turbid media in the spatial-frequency domain,” Opt. Lett. 30(11), 1354–1356 (2005). 10.1364/OL.30.001354 [DOI] [PubMed] [Google Scholar]
- 29.Weber J. R., Cuccia D. J., Johnson W. R., Bearman G. H., Durkin A. J., Hsu M., Lin A., Binder D. K., Wilson D., Tromberg B. J., “Multispectral imaging of tissue absorption and scattering using spatial frequency domain imaging and a computed-tomography imaging spectrometer,” J. Biomed. Opt. 16(1), 011015 (2011). 10.1117/1.3528628 [DOI] [PMC free article] [PubMed] [Google Scholar]


