

Abstract
Little is known about the nature of the rumen epithelial adherent (epimural) microbiome in cattle fed different diets. Using denaturing gradient gel electrophoresis (DGGE), quantitative real-time PCR (qPCR), and pyrosequencing of the V3 hypervariable coding region of 16S rRNA, epimural bacterial communities of 8 cattle were profiled during the transition from a forage to a high-concentrate diet, during acidosis, and after recovery. A total of 153,621 high-quality gene sequences were obtained, with populations exhibiting less taxonomic variability among individuals than across diets. The bacterial community composition exhibited clustering (P < 0.03) by diet, with only 14 genera, representing >1% of the rumen epimural population, differing (P ≤ 0.05) among diets. During acidosis, levels of Atopobium, Desulfocurvus, Fervidicola, Lactobacillus, and Olsenella increased, while during the recovery, Desulfocurvus, Lactobacillus, and Olsenella reverted to levels similar to those with the high-grain diet and Sharpea and Succinivibrio reverted to levels similar to those with the forage diet. The relative abundances of bacterial populations changed during diet transition for all qPCR targets except Streptococcus spp. Less than 5% of total operational taxonomic units (OTUs) identified exhibited significant variability across diets. Based on DGGE, the community structures of epithelial populations differed (P ≤ 0.10); segregation was most prominent for the mixed forage diet versus the grain, acidotic challenge, and recovery diets. Atopobium, cc142, Lactobacillus, Olsenella, RC39, Sharpea, Solobacterium, Succiniclasticum, and Syntrophococcus were particularly prevalent during acidosis. Determining the metabolic roles of these key genera in the rumens of cattle fed high-grain diets could define a clinical microbial profile associated with ruminal acidosis.
INTRODUCTION
The rumen epithelial adherent (epimural) bacterial community performs a variety of functions necessary for host health, including the hydrolysis of urea, the scavenging of oxygen, and the recycling of epithelial tissue (1–3). Early studies, using electron microscopy and culture-dependent methods, clearly showed that bacterial populations adherent to the rumen wall were distinct from those associated with rumen contents (1, 4). Rumen epimural communities were found to comprise predominantly Gram-positive species, including members of the genera Micrococcus, Staphylococcus, Streptococcus, Corynebacterium, Lactobacillus, and Propionibacterium (1). However, these culture-based techniques possibly underestimate the biodiversity of the epimural biofilm, because it can be difficult to distinguish between species that are closely related, and many members of this community are likely unculturable. As a result, numerous members of the rumen epimural community remain unidentified (5).
More-recent publications based on cloning and sequencing of the 16S rRNA gene corroborate the finding that the rumen epithelial bacterial populations differ from those associated with rumen contents (6, 7). Molecular techniques have clearly shown that the epimural bacterial community is far more diverse than originally surmised on the basis of electron microscopy (6). However, variables that may influence the species composition of epithelial biofilms, such as pH, aerotolerance, nutrient absorption, epithelial cell turnover, the passage of digesta, and host communication, remain largely undefined. While diet is a major factor influencing the structure and function of rumen content-associated microbial populations (8, 9), it is not known whether diet has a similar effect on the composition of the epimural bacterial community (10).
Recent advances in sequencing technologies have led to the wider use of metagenomic analysis for studying complex intestinal ecosystems such as the rumen (6). The popularity of this approach has been based on the assumption that genome sequences of abundant species will be well represented in a set of random reads, whereas species of lower abundance will have lower representation. When this approach is used, taxonomic classification is usually restricted to the level of genera, and mismatches may occur because reference databases contain sequences of bacterial populations from many sources, including the intestinal tracts of humans, pigs, and rodents. However, despite these limitations, the application of this technique to the rumen microbiome can provide valuable insight into the diversity, richness, and relative abundance of organisms.
The objective of this research was to characterize the composition of the adherent epithelial bacterial community during dietary adaptation from a forage-based to a grain-based diet. Changes in epithelial bacterial communities were further monitored during and after recovery from an induced episode of ruminal acidosis, with the objective of defining epithelial bacterial populations indicative of acidosis.
MATERIALS AND METHODS
Animals and sampling.
This study derived data from an experiment that investigated the impact of an acidotic challenge on rumen function (T. Schwaiger et al., unpublished data). The present study used eight ruminally cannulated Angus heifers in accordance with the guidelines of the Canadian Council on Animal Care (11). Ruminally cannulated heifers (average body weight [BW] ± standard deviation [SD], 308 ± 35 kg) never fed grain prior to this experiment were randomly assigned to one of four blocks and received a progression of 5 dietary treatments consisting of 3 basal diets (Table 1) over 11 weeks. Heifers were fed grass hay (forage) with a mineral supplement (Table 1) for a minimum of 3 weeks before being sampled (experimental day 1). They then transitioned, in a single step, to a mixed forage-concentrate (mixed forage) diet. Heifers received the mixed forage diet for 2 weeks prior to the second sampling and then transitioned over 20 days to a high-grain diet. After the transition, they were fed this diet for 34 days in order to allow the rumen microflora to stabilize before the third sample was collected (day 69). One week later, the heifers were subjected to an acidotic challenge on day 76. The challenge model involved restricting feed intake to 50% of the average ad libitum as-fed intake, based on a percentage of body weight for each individual heifer. Average intake was determined for each heifer by using the individual feed intake (as-fed) 31 days prior to the challenge. Body weight was recorded on the first day of the high-grain period, 4 days before challenge, and weekly thereafter. After 24 h of feed restriction, a single dose of ground dry-rolled barley grain ground through a 4.5-mm screen was introduced directly through the rumen cannula. To simulate both clinical and subclinical acidosis, heifers in block 1 received a dose of 20% average as-fed intake, whereas heifers in blocks 2 to 4 received a dose of 10% average as-fed intake. The pH of strained ruminal fluid from the ventral sac was measured at the beginning of the challenge, at 2-h intervals for the first 12 h, and at 4-h intervals for the next 12 h by using a portable pH meter (Accumet 25; Fisher Scientific). If the ruminal pH was below 4.2, an additional pH measurement was taken 1 h later, and if the pH was still ≤4.2, the heifers were dosed with 250 g of sodium bicarbonate in accordance with animal care guidelines. Only heifers 7 and 41 received the bicarbonate intervention. Heifers were then offered a quantity of feed (high grain) equivalent to their previous ad libitum intake (based on intake during the week prior to the challenge) 1 h after the challenge. Rumen epithelial samples were also collected 1 week postchallenge (challenge recovery) in order to gauge the degree of recovery after the challenge while the heifers continued to receive the high-grain diet.
Table 1.
Ingredient composition of treatment diets
| Ingredient | % (dry matter) in the following diet: |
||
|---|---|---|---|
| Forage | Mixed forage | High grain | |
| Grass hay | 95.0 | ||
| Barley silage | 60.0 | 9.0 | |
| Barley grain | 30.0 | 81.0 | |
| Supplementa | 5.0 | 10.0 | 10.0 |
The supplement was composed of canola meal (33.0%), beet pulp (50.0%), calcium carbonate (12.0%), salt (1.6%), Lethbridge Research Centre premix (0.5%), urea (2.5%), melengestrol acetate 100 (200 mg/kg of body weight; Pfizer Canada Inc., Kirkland, Quebec, Canada) (0.3%), and dry molasses (0.1%). Percentages are given on a dry-matter basis.
Rumen sampling.
Rumen epithelial biopsy specimens, and rumen fluid for volatile fatty acid (VFA) and lactic acid analysis, were collected, through rumen cannulae, from each heifer 4 h postfeeding. The indwelling ruminal pH was recorded on the day of sample collection (every minute) starting at 0800 h. The pH was continuously measured using the Lethbridge Research Centre ruminal pH measurement system (LRCpH; Dascor, Escondido, CA). The daily ruminal pH data were summarized as the minimum pH, mean pH, and maximum pH, and as the duration and area under the curve below the benchmarks of pH 5.8, 5.5, and 5.2, as described previously (12).
Epithelial biopsy.
Ruminal biopsy specimens were collected from the ventral sac of the rumen, approximately 25 cm below the cannula, after partial content evacuation. The ventral sac was manually externalized, and a 4- by 4-cm area around and including the biopsy site was rinsed using a syringe with 10 ml of sterile physiological saline to remove attached feed particles, loosely adherent bacteria, and any residual rumen fluid. The biopsy specimen was then taken by removing a small portion (1 cm2) of the epithelium, as close to the rumen wall as possible, without removing the base of the papillae. Dissection was performed using Kelly forceps and curved dissection scissors (Fisher Scientific Ltd., Nepean, Ontario, Canada). Ruminal papillae were excised, weighed, flash-frozen in liquid nitrogen, and stored at −80°C until DNA extraction.
Bacterial DNA extraction and pyrosequencing.
Genomic DNA was extracted as described by Kong et al. (13). Each sample of rumen epithelial tissue (∼200 mg) was manually ground to a fine powder in liquid nitrogen using a mortar and pestle, combined with proteinase K (1 mg/ml; Sigma-Aldrich Canada Ltd., Oakville, Ontario, Canada), and further ground in liquid nitrogen using a Retsch RM100 grinder (Retsch GmbH, Haan, Germany). Samples were mixed with ∼100 ml of liquid nitrogen, transferred to a 200-ml wide-mouth centrifuge bottle, and incubated for 40 min in a 50°C water bath to thaw. After incubation, 15 ml of sample was transferred to a 50-ml polycarbonate tube (SS34; Fisher Scientific Ltd., Nepean, Ontario, Canada) containing 1.5 ml of 20% (vol/vol) SDS (Sigma-Aldrich Canada Ltd., Oakville, Ontario, Canada). The resultant mixture was then incubated for 45 min at 65°C in a water bath. After incubation, samples were centrifuged at 10,000 × g for 10 min, and the supernatant was combined with a preheated (65°C) 2% agarose mixture (Sigma-Aldrich Canada Ltd., Oakville, Ontario, Canada). The suspension was transferred to petri dishes (height, 15 mm; Fisher Scientific Ltd., Nepean, Ontario, Canada). Once set (1 h), agarose samples were washed in 10 volumes of TE buffer (10:2 of 1 M Tris-HCl to 0.5 M EDTA) for 16 h. Agar (200 mg) containing cleaned sample DNA was placed in 1.5-ml snap cap tubes (Fisher Scientific Ltd., Nepean, Ontario, Canada) at −80°C for 1 h. Frozen samples were “freeze-squeezed” (14) by centrifuging at 10,000 × g for 10 min; the resulting supernatant was refrozen and was centrifuged once more to extract the DNA fragments. All samples were stored at 4°C prior to analysis. The DNA from each sample was quantified using fluorometric double-stranded DNA (dsDNA) with PicoGreen dye (Invitrogen, Life Technologies Inc., Burlington, Ontario, Canada) and was measured with a Synergy HT plate reader (BioTek U.S. Ltd., Winooski, VT). Not all samples yielded sufficient DNA for analysis (there were 5 samples for forage, 8 for the mixed forage diet, 7 for the high-grain diet, 8 for acidotic challenge, and 8 for challenge recovery). Subsequently, individual genomic DNA samples for all treatments were diluted to a concentration of 20 ng μl−1 in TE buffer. One 20-μl aliquot of each sample, for a total of 36 genomic DNA samples, was sent to the Research and Testing Laboratory (Lubbock, TX) for pyrosequencing using a 454 GS FLX Titanium sequencing system (454 Life Sciences, a Roche company, Branford, CT). Pyrosequencing targeted the V1-to-V3 hypervariable region of the 16S rRNA gene as described by Dowd et al. (15).
PCR-DGGE analysis.
Extracted, diluted DNA (3 μl; 20 ng μl−1) from each sample was added as the template to amplify the V3 region of the 16S rRNA gene for PCR-denaturing gradient gel electrophoresis (DGGE) analysis in a 25-μl reaction mixture. Amplification was performed using a Qiagen HotStar Plus Master Mix kit (Qiagen) and 500 nM forward and reverse primers (341f with GC clamp [CGCCCGCCGCGCGCGGCGGGCGGGGCGGGGGCACGGGGGGCCTACGGGAGGCAGCAG] and 534r [ATTACCGCGGCTGCTGG]) as reported previously (8). PCR conditions were as follows: 20 cycles of 95°C for 5 min, 94°C for 30 s, a temperature gradient decreasing from 65°C to 55°C by 0.5°C each cycle for 30 s, and 72°C for 1 min, followed by 10 cycles of 94°C for 30 s, 56°C for 30 s, and 72°C for 1 min, and a final elongation at 72°C for 10 min. Amplified DNA was assessed for quality using gel electrophoresis and was quantified using fluorospectrophotometry by measuring the A260/A280 (ND-3300 fluorospectrometer; NanoDrop, Wilmington, DE). Amplified DNA was then normalized to 100 ng μl−1, and 4 μl DNA, along with 4 μl of 2× loaded dye (0.05% bromophenol blue, 0.05% xylene cyanol, 70% glycerol [wt/vol] in H2O [pH 8.0]), was put into each lane on 8% acrylamide gels with a 45-to-60% denaturing gradient of urea and formamide. Electrophoresis was performed at 60°C and 40 V for 20 h. Three lanes on each gel were loaded with DGGE Marker II (Wako, Nippon Gene, Japan) to provide both an internal and an external marker. Gels were stained with SYBR gold nucleic acid gel stain (Invitrogen, Life Technologies Corp., Carlsbad, CA) according to the manufacturer's instructions and were photographed by UV transillumination.
Real-time PCR.
Quantitative analysis of the relative abundances of the 16S rRNA genes of seven bacterial species as percentages of total bacterial 16S rRNA was performed with the ABI Prism 7700 sequence detection system (Applied Biosystems, Life Technologies Corp.) using the primers shown in Table 2. Amplification products were verified by horizontal gel electrophoresis of a 5-μl aliquot in a 1% agarose gel in Tris-acetate-EDTA (40 mM Tris acetate, 1 mM EDTA [pH 8.5]), followed by ethidium bromide staining and visualization under UV light. A 1-kb ladder (Quick-Load; New England Biolabs Ltd., Pickering, Ontario, Canada) was included on each gel to confirm amplicon sizes.
Table 2.
Species- and genus-specific primers for the quantification of rumen bacteria using real-time PCR assay.
| Target taxon or strain | Primer sequence (5′ to 3′)a | Tm (°C)b | Amplicon length (bp) | Reference(s) |
|---|---|---|---|---|
| General bacteria | F, GTGSTGCAYGGYTGTCGTCA | 61 | 150 | 44 |
| R, ACGTCRTCCMCACCTTCCTC | ||||
| Ruminococcus genus | F, GAGTGAAGTAGAGGTAAGCGGAATTC | 60 | 75 | 45 |
| R, GCCGTACTCCCCAGGTGG | ||||
| Selenomonas ruminantium | F, CAATAAGCATTCCGCCTGGG | 61 | 82 | 16, 46 |
| R, TTCACTCAATGTCAAGCCCTGG | ||||
| Streptococcus bovis | F, CTAATACCGCATAACAGCAT | 57 | 869 | 9 |
| R, AGAAACTTCCTATCTCTAGG | ||||
| Fibrobacter succinogenes S85 | F, GCGGGTAGCAAACAGGATTAGA | 59 | 77 | 16, 46 |
| R, CCCCCGGACACCCAGTAT | ||||
| Megasphaera elsdenii | F, AGATGGGGACAACAGCTGGA | 59 | 79 | 16 |
| R, CGAAAGCTCCGAAGAGCCT | ||||
| Prevotella genus | F, GGTTCTGAGAGGAAGGTCCCC | 61 | 121 | 16 |
| R, TCCTGCACGCTACTTGGCTG |
F, forward; R, reverse.
Tm, melting temperature.
For each targeted taxon in rumen contents, DNA was quantified with a QuantiFast kit (Qiagen) using SYBR green chemistry. Standards and samples were assayed in a 25-μl reaction mixture containing 15 μl of QuantiFast SYBR green master mix, 8 μl of nuclease-free water, and 2 μl of the DNA template. Amplifications were performed under the following conditions: 95°C for 5 min, 95°C for 10 s, and a 30-s annealing/elongation (at the temperatures shown in Table 2 based on each primer pair) for 40 cycles. The melting curves of PCR products were monitored by slow heating with an increment of 0.1°C s−1 from 60 to 95°C, with fluorescence collection at 0.1°C intervals to confirm the specificity of amplification. A standard curve for each bacterial species was constructed by using plasmid DNA containing 16S rRNA inserts of DNA purified from a pure culture of the target species (16). Ruminococcus plasmid DNA was used as a standard template for universal bacterial primers. Plasmid DNA was quantified and was then subjected to seven sequential 10-fold dilutions, each analyzed in duplicate. A linear relationship was observed between the threshold cycle (CT) and the log of the DNA concentration when each primer pair was tested against purified DNA from its target taxon (r2, 0.97 to 0.99). Each sample was run in triplicate, and the PCR cycle at which the reaction exceeded the fluorescence threshold was identified as the CT. Amplification efficiencies ranged from 91.6 to 98.4%. The copy numbers of total bacteria and each enumerated taxon, in 20 ng DNA, were determined by relating the CT values to standard curves.
The proportion of each species was estimated by dividing the copy numbers of the 16S rRNA genes of targeted species by those of the 16S rRNA genes amplified with a reference primer set (16). A nondegenerate, domain-level primer set that amplified all bacterial species was used as the reference primer set (Table 2).
Pyrosequencing analysis.
Pyrosequencing analysis of the V1-to-V3 region of 16S rRNA yielded an average of 5,079 raw reads per sample. Using the Mothur platform, reads with average quality scores of <35, homopolymers of >8 bases, and sequences with 1 or more ambiguous bases were removed from the data set. Sequences were then aligned against the SILVA database for 16S rRNA genes to define operational taxonomic units (OTUs) (17). Sequences that did not span the longest alignment region were also removed from the data set. Sequences were trimmed so that reads overlapped in the same alignment space, producing read lengths ranging from 167 to 349 bp. Pyrosequencing noise due to base call errors was minimized in the data set by using the precluster algorithm in Mothur (18), whereby rare sequences highly similar to abundant sequences were reclassified as their abundant homologues. Chimeras were removed from the samples by using the sequence collection (UCHIME) as its own reference database (19). A distance matrix was constructed using the average neighbor algorithm at phylogenetic distances of 0.03 (equivalent to species), 0.05 (genus), and 0.25 (phylum). Pairwise distances between aligned sequences were calculated at a 0.97% similarity cutoff and were then clustered into unique OTUs. In total, there were 153,612 high-quality reads, with an average 4,267 ± 1,419 reads and 149 ± 28 unique OTUs per individual sample. Mothur was also used to generate rarefaction curves, to determine species richness using Chao1 and abundance-based coverage estimation (ACE), to determine species diversity with the Shannon-Wiener and Simpson indices, and to create a dendrogram based on treatment differences using the Jaccard index (Fig. 1; see also Table S1 in the supplemental material). Calculations of percentages of sequences within taxonomic classifications at the genus and species levels were performed using a custom summation script.
Fig 1.
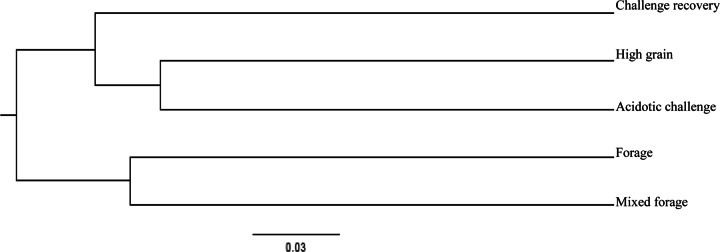
Cluster analysis of dietary treatments created using Jaccard analysis to show dissimilarity between epithelial populations based on unique OTUs for each treatment. OTUs are estimated at a 10% difference level.
Statistical analysis.
PCR-DGGE band patterns were analyzed by using Bionumerics software (version 5.1; Applied Maths, Inc., Austin, TX) to create similarity matrices so as to identify community population differences among treatments and individual animals. Bands were selected visually on the basis of peak height. Using an average Dice similarity coefficient (Dsc) index, with an optimization of 1.0% and a tolerance of 1.0%, clustering was carried out by the unweighted-pair group method with arithmetic means (UPGMA). Read number, sample coverage, unique OTUs, sample richness (Chao1 and ACE), and sample diversity (Shannon-Wiener and Simpson indices) were compared by one-way analysis of variance (ANOVA) using Proc Mixed in SAS (version 9.1.3; SAS Institute Inc., Cary, NC). Using the same procedure, the relative abundances of bacterial populations quantified by quantitative real-time PCR (qPCR) and rumen fermentation variables, including VFA and pH, were analyzed for effects of dietary treatment, with animals considered as blocks. Taxonomic data, expressed as percentages, were similarly analyzed after being log-transformed (20). Means were separated using Tukey's honestly significant difference (HSD) test. All pH variables were additionally analyzed in a pairwise correlation to all unique OTUs. Significance was declared at a P value of ≤0.05, and trends were indicated by a P value of ≤0.10.
RESULTS
PCR-DGGE and quantitative real-time PCR.
The total number of bands per sample from PCR-DGGE ranged from 8 to 31, with an average of 21 bands, based on Bionumerics peak analysis with visual adjustments (Fig. 2). Heifer 143 showed the highest clustering, with 89% Dice similarity between the high-grain and acidotic samples, while mixed forage samples were 87% similar to these. Of the six bacterial species screened for, only two, Ruminococcus and Prevotella spp. were detected in all heifers regardless of diet (Tables 3 and 4). Quantities of prominent ruminal bacteria, expressed as percentages of total enumerated bacteria, ranged from 0.0 to 6.74% among diets (Table 4) and from 0.0 to 8.52% among individual heifers (Table 3). Heifers 7 and 41 possessed no detectable Fibrobacter succinogenes, whereas heifer 156 had the highest (P = 0.01) relative abundance of this bacterium (1.42%) (Table 3). Only F. succinogenes exhibited different abundances (P = 0.007) across diets, with the highest proportion (1.25%) occurring in cattle fed the forage diet and none detected in those fed the high-grain diet. Levels of Selenomonas ruminantium tended to be higher (P = 0.09) during the acidotic challenge and the recovery period than when heifers received other diets (Table 4).
Fig 2.

Dendrogram of PCR-DGGE analysis of rumen epithelial samples from cattle fed a progression of dietary treatments (forage, mixed forage, high grain, acidotic challenge, and challenge recovery). Results were clustered with the Dice similarity coefficient (optimization, 1.0%; tolerance, 1.0%) and UPGMA.
Table 3.
Effects of individual animals (block effect) on the relative abundances of dominant rumen epithelial bacterial species determined by quantitative real-time PCR
| Bacterium | % of total enumerated bacterial 16S rRNA genesa in the following individual animal: |
SEM | P | |||||||
|---|---|---|---|---|---|---|---|---|---|---|
| 7 | 41 | 43 | 143 | 153 | 156 | 315 | 346 | |||
| Ruminococcus spp. | 2.60 | 4.50 | 2.12 | 7.28 | 1.36 | 8.52 | 6.85 | 1.74 | 2.309 | 0.197 |
| Fibrobacter succinogenes | 0.00a | 0.00a | 0.41ab | 0.82ab | 0.19a | 1.42b | 0.48ab | 0.51ab | 0.269 | 0.011 |
| Prevotella spp. | 1.53 | 3.93 | 2.02 | 4.62 | 1.32 | 4.25 | 6.23 | 1.16 | 1.664 | 0.370 |
| Selenomonas ruminantium | 1.11 | 5.32 | 0.85 | 3.49 | 0.00 | 3.26 | 6.84 | 0.69 | 2.331 | 0.372 |
| Megasphaera elsdenii | 0.56 | 2.57 | 0.02 | 0.20 | 6.23 | 0.20 | 0.16 | 0.18 | 1.069 | 0.602 |
| Streptococcus bovis | 0.66 | 0.57 | 0.75 | 4.24 | 0.00 | 0.01 | 0.00 | 0.00 | 1.423 | 0.404 |
Values followed by the same letter in the same row are not significantly different from each other.
Table 4.
Effects of dietary treatment on the relative abundances of dominant rumen epithelial bacterial species determined by quantitative real-time PCR
| Bacterium | % of total enumerated bacterial 16S rRNA genesa with the following dietary treatment: |
SEM | P | ||||
|---|---|---|---|---|---|---|---|
| Forage | Mixed forage | High grain | Acidotic challenge | Challenge recovery | |||
| Ruminococcus spp. | 5.48 | 4.46 | 2.19 | 2.99 | 6.74 | 1.829 | 0.369 |
| Fibrobacter succinogenes | 1.25b | 0.63ab | 0.00a | 0.88a | 0.45a | 0.214 | 0.007 |
| Prevotella spp. | 1.93 | 1.34 | 2.83 | 3.32 | 6.24 | 1.318 | 0.086 |
| Selenomonas ruminantium | 2.42 | 0.38 | 0.92 | 4.73 | 4.11 | 1.851 | 0.362 |
| Megasphaera elsdenii | 0.24 | 0.00 | 0.27 | 2.25 | 0.84 | 0.847 | 0.252 |
| Streptococcus bovis | 0.28 | 0.00 | 0.00 | 3.33 | 0.29 | 1.127 | 0.157 |
Values followed by the same letter in the same row are not significantly different from each other.
Sequence diversity and richness analysis.
All treatments showed similar rarefaction curves, with levels tending to plateau after about 15,000 sequences (see Fig. S1 in the supplemental material). This indicates that the observed level of richness was sufficient to accurately describe the ecology of the rumen epimural microbiome across sampling periods. ACE and the Chao1 estimate were calculated to compare species richness by estimating the minimum number of unique OTUs for each sample (see Table S1 in the supplemental material). The number of OTUs that were unique to each treatment ranged from 144 to 161. Chao1 and ACE values both showed species richness to be numerically highest during the forage and acidotic challenge periods; however, there was no statistical difference among diets. Similarly, the Shannon-Wiener and Simpson indices (21) both showed that the epimural community exhibited considerable diversity, but with no differences among diets (see Table S1).
Sequence cluster analysis.
A Jaccard cluster analysis of sequence data showed that each epithelial population possessed unique OTUs (P ≤ 0.05) across all samples, independent of the host (Fig. 1). Samples grouped according to diet composition; samples collected when diets contained high levels of forage (forage, mixed forage) were more closely related than those collected when heifers were fed high-grain diets prior to, during, and after the acidotic challenge. Subclustering of samples collected during the high-grain and acidotic challenge periods compared to the challenge recovery was also evident (Fig. 1). The epithelial samples collected during the high-grain and acidotic challenge periods showed the highest species similarities; however, even with these similarities, these two treatments were associated with distinct populations that differed from each other as well as from those for the other diets.
Estimates of percentages of abundance of sequences of different taxa.
Butyrivibrio was more (P < 0.001) abundant in samples taken when heifers were fed forage and mixed forage diets than in samples collected during the acidotic challenge (Table 5). Prevotella levels tended (P = 0.08) to be higher in the high-grain, acidotic challenge, and recovery samples than in the forage and mixed samples. A total of 38 different genera were influenced (P ≤ 0.05) by dietary treatment; 14 of these were most abundant in samples collected during the acidotic challenge. These included both cultured and uncultured genera: Adhufec269, Atopobium, Desulfocurvus, Fervidicola, cTPY-17 adhufec52 incertae sedis, Eubacterium cellulosolvens incertae sedis, Lactobacillus, Olsenella, RC39, Roseburia, Sharpea, Solobacterium, Succiniclasticum, and Succinivibrio. Desulfocurvus was exclusive to the acidotic challenge, where it accounted for nearly 1% of total rumen epithelial bacteria. Eleven distinct genera differed (P ≤ 0.05) among individual heifers (see Table S2 in the supplemental material). The genera Atopobacter, F24-B10, and U29-B03 were found in only 1 of the 8 heifers regardless of the period during which ruminal samples were collected (see Table S2). A correlation analysis of all pH variables with all identifiable epithelial genera was performed, and 43 genera were correlated with one or more pH variables (see Table S3 in the supplemental material). Thermodesulfobium was the only genus that correlated with all pH variables, with a decrease in total numbers at low pHs (see Table S3). All genera that decreased in total abundance with the minimum daily pH also decreased in total abundance as the pH duration and area under all pH benchmarks increased. Other genera and species that responded to decreasing pHs with decreased abundance included Azonexus, Butyrivibrio fibrisolvens, Carboxydibrachium, Eubacterium brachy, Fervidicola, Fusobacterium, Clostridium viride incertae sedis, Marvinbryantia, RC1-13, RF21, RF38, RFN8-YE57, Ruminococcus group 1, Saccharofermentans, and vadinHS42. Additionally, those genera that were determined to be part of an “uncultured/unclassified” grouping showed similar sensitivity to low pHs. Conversely, the percentages of abundance of 16 genera increased with more acidic rumen conditions: Anaerophaga, Atopobium, cc142, B. fibrisolvens H15 incertae sedis, cTPY-17 adhufec52 incertae sedis, Ruminococcus gnavus incertae sedis, Lactobacillus, Megasphaera, Mitsuokella, Olsenella, RC39, Selenomonas, Solobacterium, Streptococcus, Succiniclasticum, and Succinivibrio (see Table S3). All genera whose levels increased with lower daily pHs also showed increases as the duration and the area under pH benchmarks 5.8, 5.5, and 5.2 increased. Firmicutes, Bacteroidetes, and Proteobacteria were the most abundant phyla, and their percentages of abundance remained relatively constant despite changes in diet over the duration of the experiment (see Table S4 in the supplemental material). Forage and mixed forage diets exhibited increased (P ≤ 0.05) levels of Candidate division TM7, Fusobacterium, and Tenericutes. Comparatively, samples from heifers fed the high-grain diet showed the highest levels (P = 0.05) of Synergistetes, whereas levels of Actinobacteria were highest (P < 0.001) in heifers during the acidotic challenge period. All epithelial phyla were also used in a correlation analysis with all pH variables, and 5 phyla were correlated with one or more pH variables (see Table S5 in the supplemental material). Actinobacteria and Candidate division TM7 correlated with all pH variables except the maximum pH. However, Actinobacteria were negatively correlated with the lowest daily pH and mean pH but positively correlated with the duration and area under all pH benchmarks. Candidate division TM7, Planctomycetes, and Tenericutes were positively correlated with the pH nadir and mean pH but negatively correlated with all other pH measures (see Table S5).
Table 5.
Contributions of genus-level taxa to rumen epithelial microbial populations with different dietary treatmentsa
| Genus or speciesb | % in the populationc with the following treatment: |
SEM | P | ||||
|---|---|---|---|---|---|---|---|
| Forage | Mixed forage | High grain | Acidotic challenge | Challenge recovery | |||
| Adhufec269 | 0.00a | 0.07a | 0.56b | 0.76b | 0.69b | 0.07 | 0.06 |
| Anaerovorax | 0.49ab | 0.99b | 0.14a | 0.07a | 0.27ab | 0.07 | 0.01 |
| Atopobium | 0.00a | 0.00a | 0.93bc | 1.51c | 0.44ab | 0.10 | <0.001 |
| Azonexus | 0.51b | 0.61b | 0.00a | 0.00a | 0.09a | 0.04 | 0.01 |
| Butyrivibrio fibrisolvens | 8.63bc | 9.66c | 5.14ab | 2.42ab | 2.40a | 0.90 | <0.001 |
| cc142 | 0.57a | 0.74a | 2.34b | 2.50b | 2.55b | 0.30 | 0.04 |
| Coprobacillus | 0.44b | 0.00a | 0.00a | 0.00a | 0.00a | 0.01 | 0.01 |
| Desulfocurvus | 0.00a | 0.00a | 0.00a | 0.74b | 0.00a | 0.03 | 0.01 |
| Faecalibacterium | 0.36b | 0.00a | 0.00a | 0.00a | 0.00a | 0.01 | <0.001 |
| Fervidicola | 0.00a | 0.00a | 0.00a | 0.33b | 0.08a | 0.02 | 0.05 |
| Filifactor | 0.57b | 0.00a | 0.00a | 0.00a | 0.00a | 0.01 | 0.01 |
| Fusobacterium | 1.06b | 0.00a | 0.00a | 0.00a | 0.00a | 0.03 | <0.001 |
| cTPY-17_adhufec52 incertae sedis | 0.00a | 0.00a | 0.32b | 0.54b | 0.11b | 0.03 | 0.03 |
| Eubacterium cellulosolvens incertae sedis | 0.00a | 0.00a | 0.16b | 0.30b | 0.19b | 0.02 | 0.07 |
| Lactobacillus | 0.00a | 0.00a | 0.00a | 4.48b | 0.00a | 0.17 | 0.07 |
| Marvinbryantia | 0.16b | 0.40b | 0.00a | 0.00a | 0.00a | 0.02 | 0.02 |
| Mogibacterium | 3.36a | 6.43b | 8.07b | 4.61ab | 4.65ab | 0.92 | 0.07 |
| Olsenella | 0.00a | 0.00a | 0.09a | 1.60b | 0.14a | 0.07 | <0.001 |
| Oxobacter | 1.35b | 0.36a | 0.67ab | 0.21a | 0.83ab | 0.10 | 0.04 |
| Porphyromonas | 0.76b | 0.00a | 0.00a | 0.00a | 0.00a | 0.02 | <0.001 |
| Prevotella | 2.62a | 1.86a | 4.21b | 4.19b | 6.74b | 0.67 | 0.08 |
| Proteiniborus | 0.36b | 0.00a | 0.00a | 0.06b | 0.00a | 0.01 | 0.02 |
| RC1-13 | 0.53ab | 1.26b | 0.67ab | 0.34a | 0.48a | 0.11 | 0.01 |
| RC25 | 0.46b | 0.28b | 0.00a | 0.00a | 0.00a | 0.02 | 0.03 |
| RC39 | 0.00a | 0.00a | 1.50b | 2.93c | 0.83ab | 0.19 | <0.001 |
| RF21 | 1.20a | 3.13b | 1.86ab | 0.91a | 1.43ab | 0.29 | 0.01 |
| RF38 | 0.49b | 0.26ab | 0.00a | 0.00a | 0.00a | 0.02 | <0.001 |
| Roseburia | 0.00a | 0.00a | 0.88b | 0.98b | 0.92b | 0.10 | 0.03 |
| Saccharofermentans | 1.25b | 1.19b | 0.22a | 0.00a | 0.09a | 0.08 | <0.001 |
| Sharpea | 0.00a | 0.00a | 0.20b | 1.00b | 0.00a | 0.04 | 0.06 |
| Solobacterium | 0.12a | 0.23a | 1.68ab | 3.48b | 2.08ab | 0.27 | <0.001 |
| Sporobacter | 0.62b | 0.07a | 0.43ab | 0.20ab | 0.61b | 0.06 | 0.07 |
| Succiniclasticum | 0.44a | 0.39a | 3.20c | 2.71bc | 1.26ab | 0.28 | <0.001 |
| Succinivibrio | 0.00a | 0.00a | 0.39b | 0.56b | 0.00a | 0.03 | 0.03 |
| Syntrophococcus | 0.29a | 0.69ab | 0.98ab | 1.16b | 1.20b | 0.15 | 0.02 |
| Thermodesulfobium | 0.60ab | 1.13b | 0.34ab | 0.09a | 0.10a | 0.07 | 0.01 |
| Thermohalobacter | 0.62b | 0.07a | 0.00a | 0.07a | 0.00a | 0.02 | <0.001 |
| Uncultured | 1.98bc | 2.14b | 1.14ab | 0.68a | 0.73a | 0.21 | <0.001 |
Data for the remaining genera are not shown due to nonsignificant differences between treatments.
The following genera showed a significant effect of the animal block: RC1-13 (P = 0.02), Eubacterium cellulosolvens incertae sedis (P = 0.03), and Succinivibrio (P = 0.03).
Values followed by the same letter in the same row are not significantly different from each other.
Core rumen epithelial microbiome.
The core bacterial community shared by all heifers was analyzed by examining the distribution of each OTU across all samples. Figure 3 shows the average percentages of abundance of taxa shared by all samples at each taxonomic level. This analysis revealed that 21% of the OTUs were present in all samples. A comparison of the unique OTUs associated with each of the diets was also completed (data not shown). Six percent of OTUs, including Atopobium (2%), Campylobacter (2%), and cc142 (2%), were found to be unique to the acidotic challenge period. The genus Wet75 was found exclusively in heifers fed forage (1%), while the genus RC1-13 was found to be a member (1%) of the core microbiome in heifers fed mixed forage. Succiniclasticum (3%) was detected only in the core microbiome of heifers fed a high-grain diet, whereas during the recovery period no unique OTUs were identified. At the family level, the OTUs with the highest representation included Lachnospiraceae (average percentage of abundance, 34%), Family XIII incertae sedis (13%), and Ruminococcaceae (11%), all members of the class Clostridia (67%).
Fig 3.

Graphical representation of the phylogenetic tree of the rumen epithelial core microbiome. Any OTU present in all samples, for all animals on all treatments, was considered part of the core microbiome. Average percentages of abundance are given in parentheses.
Acidotic challenge.
The responses of individual heifers to the acidotic challenge are shown in Table 6. Heifers 7 and 41 exhibited the lowest daily pHs (4.00 and 3.93, respectively) and the highest areas under the curve for a pH benchmark of 5.2. However, heifers 41, 43, and 315 had the longest duration of time below pH 5.2. Based on the area under pH 5.2, heifers 7 and 41 were defined as experiencing subclinical acidosis, and heifers 143 and 153 were defined as clinically acidotic (Fig. 4). The increase in rumen pH in heifer 7 at 0430 h reflected the administration of sodium bicarbonate as per animal care guidelines. Lactobacillus levels were 15% higher in heifers that exhibited clinical acidosis than in those with subclinical acidosis (Fig. 5). Additionally, levels of the genera Acetitomaculum, Megasphaera, Olsenella, RC39, and Streptococcus were increased by 2.5 to 4.5% in clinically acidotic animals. The abundances of the species Eubacterium nodatum and Eubacterium minutum and the genera Comamonas, Desulfobulbus, and Sporobacterium were all 1 to 4% lower in heifers with clinical acidosis than in those with subclinical acidosis.
Table 6.
Individual-animal pH responses to acidotic challenge, measured continuously over a 24-h period
| Animal | pHa |
Response for a benchmark pH of: |
|||||||
|---|---|---|---|---|---|---|---|---|---|
| <5.8 |
<5.5 |
<5.2 |
|||||||
| Min | Mean | Max | Durationb | Areac | Duration | Area | Duration | Area | |
| 7 | 4.00 | 5.47 | 6.92 | 1,224 | 1,259 | 1,107 | 913 | 857 | 619 |
| 41 | 3.93 | 4.31 | 7.15 | 1,319 | 1,896 | 1,282 | 1,505 | 1,235 | 1,127 |
| 43 | 4.75 | 5.21 | 6.87 | 1,303 | 1,020 | 1,261 | 634 | 1,015 | 284 |
| 143 | 5.12 | 6.04 | 6.96 | 666 | 242 | 413 | 85 | 92 | 2 |
| 153 | 5.05 | 6.01 | 6.83 | 893 | 431 | 761 | 178 | 259 | 12 |
| 156 | 4.81 | 5.86 | 7.09 | 935 | 432 | 615 | 208 | 348 | 56 |
| 315 | 4.68 | 5.33 | 7.07 | 655 | 555 | 631 | 361 | 1,179 | 357 |
| 346 | 4.50 | 5.53 | 7.06 | 1,186 | 830 | 969 | 514 | 730 | 248 |
Min, minimum; max, maximum.
Duration of time (minutes) spent below the benchmark pH.
Area (calculated as pH × minutes) under the benchmark pH.
Fig 4.
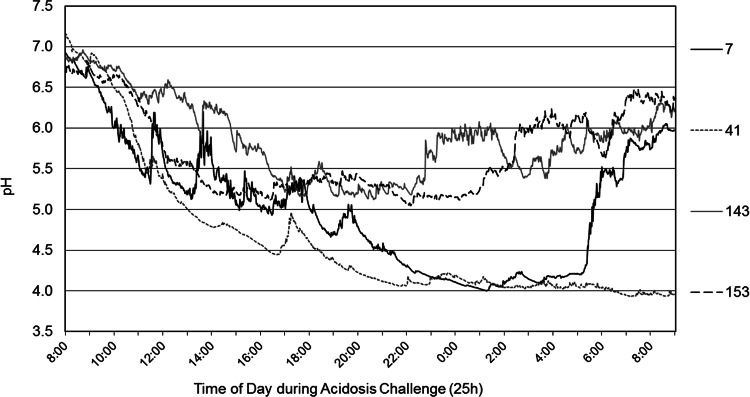
Daily monitored pHs in highly acidotic (animals 7 and 41) and minimally acidotic (animals 143 and 153) heifers. The time of the grain challenge was 0900, and the time of feeding was 1 h postchallenge.
Fig 5.

Differences in relative abundances (expressed as percentages) of epithelial bacterial genus populations in clinically acidotic heifers (animals 7 and 41) compared to subclinically acidotic heifers (animals 143 and 153). Acidotic ranking was determined by the area under the curve for a pH of <5.2, adjusted for the dry-matter intake of the animal. IS, incertae sedis.
DISCUSSION
Ruminants depend on the rumen microbial community to convert otherwise indigestible feedstuffs into volatile fatty acids and microbial protein (1). A detailed understanding of the rumen microbiome under conditions of disequilibrium, such as during diet transition or under clinical conditions such as acidosis, is pivotal to advancing the science of rumen function. The aim of this study was to characterize the epimural bacterial community in heifers fed forage, mixed forage-grain, and high-grain diets, as well as during an acidotic challenge and after recovery.
Original work, using light and electron microscopy, described the adherent population of bacteria on the rumen epithelium as sparse and taxonomically heterogeneous (1, 3, 7). Within the past 10 years, the use of molecular biology has enabled more-detailed classification of microbial phyla inhabiting the rumen. However, only a few studies have used these methods to analyze the rumen epithelial community.
In the current study, three different molecular methods were used to describe the bacterial epimural communities of heifers fed 5 different dietary treatments, including an acidosis challenge. These included PCR-DGGE, qPCR, and next-generation sequencing. Data analysis showed a number of similarities between data obtained using qPCR and DGGE and data obtained from pyrosequencing. Of the 6 species- or genus-specific qPCR primer sets used, Prevotella spp., Fibrobacter succinogenes, Megasphaera elsdenii, and Streptococcus bovis all produced treatment averages similar to what was seen in the percentages of abundance determined by the analysis of pyrosequencing data. Although the values were not exact, the trends in treatment differences were the same, indicating that qPCR is a useful tool for identifying specific populations in a complex community. In this experiment, in agreement with the pyrosequencing results, DGGE profiles were found not to differ significantly among diets in terms of either species diversity (Shannon and Simpson indices) or richness (Chao1 and ACE). Similar results have been observed for sheep when the epimural community was examined with similar dietary regimes (22). These results indicate that the bacterial community attached to the rumen wall of individual heifers was relatively stable in spite of a transition from a forage-based diet to a high-grain diet.
Deep sequencing covering 98.8 to 99.0% of the rumen epimural community was able to provide a novel and detailed view of the impact of dietary change. The use of pyrosequencing for the rumen epithelial bacterial community has only recently been applied to preruminant calves (23). Prior to this, all sequencing of the rumen epithelial community was carried out using clone libraries (6, 24, 25). Li et al. (23) used pyrosequencing to study calves up to the age of 49 days and determined that many of the taxa comprising the epimural community in preruminant calves were similar to those found previously in cloning studies using DNA isolated from the rumen epithelium (8, 22); of these similar taxa, many were the same as those identified in the current study. Our research identified 166 distinct species with the 5 dietary treatments examined; the majority of these species have not been identified previously in culture-based analysis of the rumen epithelial tissue and therefore could not be identified beyond the genus level. Some genera not described previously with regard to this ecosystem include Adhufec269, Azonexus, cc142, Filifactor, Marvinbryantia, Sharpea, Solobacterium, Thermodesulfobium, and Thermohalobacter. Adhufec269 and cc142 are both considered uncultured genera; however, both have been isolated from the hind guts of other mammals previously (26). Azonexus is a member of the family Rhodocyclaceae of the phylum Proteobacteria and comprises mainly denitrifying bacteria with versatile metabolic capabilities (6). Filifactor is a diverse genus within the class Clostridia which likely utilizes acetate and butyrate but can potentially use a large number of other VFAs as substrates (27). Thermdesulfobium and Thermohalobacter are both members of the class Clostridia and are obligate anaerobes. While members of Clostridia have been reported previously to be associated with the rumen epithelium (6, 23), the abundance and diversity of this class are not fully understood. Previously, Thermohalobacter has been identified as a close relative of Proteiniclasticum ruminis, a strictly anaerobic proteolytic bacterium isolated from the rumen of a yak (28). Sharpea and Solobacterium, of the order Erysipelotrichales, have only recently been described as members of a distinct class within the Firmicutes. This class, order, and family have been described as part of the gut microbiome in mammals (29) and were determined to be part of the core microbiome of the rumen epimural community in this study, although their metabolic role is unknown.
The concept of a core microbiome in the human gastrointestinal tract has been researched extensively, especially in relation to an individual's risk for a number of intestinal diseases, including inflammatory bowel disease (29). While the unique responses of individual cattle to perturbations such as acidosis have long been documented (30, 31), the degree to which this individuality of response is due to the uniqueness of the gut microbiota has not been elucidated. For humans, the key aim of the majority of gut microbiota research has been to understand if there are a number of essential species or strains that define a “core microbiome” (32). Such work could then be used to define a “healthy state” and to detect deviations from this core population that may be indicative of disease (32). Owing to their close association with the host, those bacteria firmly adherent to the rumen epithelium could have a significant impact on host health and therefore may be most appropriate for defining a core rumen microbiome. While the thorough rinsing of the epithelium prior to sampling in this trial ensured that samples taken represented only those bacteria adherent to the rumen epithelium, it is unlikely that in this dynamic ecosystem any bacterial niche (i.e., solid, liquid, or epithelium adherent) is truly independent. Although a number of the dominant epimural bacteria detected at the class and family level in this work are the same as those reported in the rumen solid- and liquid-associated core microbiome (33), at the genus level many of the OTUs were not affiliated with rumen content-associated bacterial taxa, and several genera were distinct. This research was able to clearly define a rumen core microbiome regardless of diet and despite the continual sloughing of the epithelia (Fig. 3). This core microbiome was consistent for 21% of the enumerable population, regardless of animal variability, clearly indicating that the rumen epimural bacterial community is extremely stable.
Diet is one of the major factors influencing the structure and function of the microbial community in the rumen (8, 9, 22). The nature of feed and the physicochemical changes induced by its fermentation are known to favor the development of certain microbial ecotypes in the ruminal solid and liquid phases (34). Previous research has shown that in lambs, the epimural community was less influenced by diet than microbiota associated with rumen contents (10, 22). This stability may be due to the tissue-specific metabolic activities of adherent populations and may reflect the fact that this population relies less on digesta for function (10).
Experimental data describing detailed changes in rumen epithelial populations under conditions of severe pH change, as exemplified during subclinical and clinical acidosis, are lacking. In this experiment, the rumen bacterial phyla most significantly impacted by diet and pH were not among the three major phyla represented in the rumen adherent populations but instead were members of the Actinobacteria, Candidate division TM7, Fusobacteriia, Synergistetes, and Tenericutes. Additionally, all of these phyla except Actinobacteria showed decreased abundance with low pH and were at the highest abundance with either a forage or a mixed forage diet. At the genus level, 61 key genera were identified, including 2 that were still phylogenetically labeled as unknown and unclassified. In the classical work performed by Cheng and Wallace (7), all of the rumen epithelial genera belonging to the phylum Actinobacteria differed from what we identified in the current study. This classical work identified populations of Micrococcus, Corynebacterium, and Propionibacterium, whereas in the present study, only Atopobium and Olsenella were identified. Atopobium and Olsenella are closely related and have recently been described as members of the epimural community of the rumen (6, 23). Classically, these bacteria were considered unculturable, and since they are Gram-positive rods similar to Micrococcus, Corynebacterium, and Propionibacterium, it is likely that they were misidentified in earlier rumen epithelial studies (7).
To our knowledge, no previous research has investigated the long-term impact of an acidotic challenge on the rumen epithelial community. Atopobium, Desulfocurvus, Fervidicola, Lactobacillus, Olsenella, Proteiniborus, RC39, Sharpea, and Succinivibrio were all more prevalent during the acidotic challenge than at other times. During the recovery period, all genera except Sharpea and Succinivibrio returned to levels observed during the high-grain treatment; these other two genera reverted to forage treatment levels. The physiological roles of Sharpea and Succinivibrio within the epimural bacterial community are unknown. However, Sharpea, of the order Erysipelotrichales, has only recently been established as a member of a distinct class within the phylum Firmicutes. This class, order, and family have been described as part of the gut microbiome in horses, pigs, mice, and humans (34). Succinivibrio, of the phylum Proteobacteria and the class Gammaproteobacteria, has long been recognized as part of the rumen ecosystem but has not been extensively studied due to low abundance within the rumen.
Ruminal pHs differed considerably among challenged cattle (Fig. 5), and this variability is apparent even in commercial beef cattle (30, 31). To date, analysis of rumen populations under acidotic conditions has been limited mainly to rumen contents and has not extended to the epimural community (35). In rumen contents, some bacteria are negatively impacted by low pHs, while others, such as Lactobacillus, Megasphaera, Streptococcus, Succinivibrio, and Escherichia, proliferate (35, 36). Research regarding Lactobacillus spp. within the rumen and specifically those adherent to the epithelial wall is comparatively limited (37), and the most recent publications using molecularly based methods (6, 25) have not been able to detect Lactobacillus in cattle fed high-grain diets. However, in our study, high levels of Lactobacillus were found adherent to the rumen epithelium in 6 out of the 8 heifers during the acidotic challenge. This was not completely unexpected, because Lactobacillus has long been associated with the commensal luminal and adherent populations in the gastrointestinal tracts of many mammals, including humans (38). However, in this study, the presence of lactobacilli with the acidotic challenge treatment only and at levels 16% higher in heifers that were clinically acidotic (heifers 7 and 41) than in those that were subclinically acidotic (heifers 143 and 153) was not anticipated. Furthermore, the clinically acidotic heifers were also the only animals with detectable Streptococcus populations, and both of these individuals experienced the most severe responses (pH minimum, ≤4.0) to the acidotic challenge (Fig. 5). This extreme acidotic environment in these heifers was indicative of acute acidosis, in contrast to the responses of the other heifers in this study, as reflected by the minimum pH and the duration of a pH under 5.2 (see Table S6 in the supplemental material). The presence of these two genera at increased levels in heifers 7 and 41 indicates a clear correlation between the growth of Lactobacillus and Streptococcus, on the one hand, and an increased severity of response to the acidotic challenge in the host, on the other. Whether these two bacterial groups are causative agents or products of acidotic conditions is unclear. The proliferation of the same groups has been found by others in rumen digesta under acidotic conditions (35, 39). However, neither classical nor molecular methods have been able to clearly and consistently show the correlation between Streptococcus and acidosis in either the solid, liquid, or epithelial fraction of the rumen (6, 39, 40). The lack of a consistent bacterial response across studies might be due to the conditions associated with each feeding regime. Previous research has also indicated that individual animal variability has hindered accurate description of the rumen microflora by masking the effects of treatment on these populations (6, 41). Potentially, the stability of the rumen epithelial community can be truly disrupted only by an extreme change in environmental conditions, as is the case with clinical acidosis, supporting the contention that this community is highly stable. It has been observed previously that some of the variability in host response to low pHs is related to differences in VFA absorption (42). In clinical acidosis, the buffering capacity is overwhelmed by the high levels of VFAs produced in a short time. However, animals that exhibit higher VFA absorption on the apical surfaces of rumen epithelial cells have a greater ability to mediate the effects of increased VFA production than those with less uptake capacity (42). Although we did not ascertain the metabolic activity of the epimural community in this study, further use of metatranscriptomics or proteomics could reveal that this population also contributes to variability in host susceptibility to acidosis.
Molecular techniques have shown that the rumen microbial community is far more complex than originally believed on the basis of traditional culture techniques. This study represents the largest bovine epimural pyrosequencing effort to date in terms of both the number of individual samples and the depth of sequencing (average of 4,267 reads per sample). The added value of characterizing low-abundance community members is clearly illustrated by the increased ability to detect rumen bacteria affected by dietary treatment. Limitations in reference databases inhibit complete and accurate descriptions of ecosystems such as the rumen, where most bacteria are fastidious. The development of the “Hungate1000,” a catalogue of 1,000 reference microbial genomes from the rumen (http://www.hungate1000.org.nz/), should advance the relevance of high-throughput sequencing techniques to the rumen microbiome. Until such a database is fully developed, understanding of the rumen ecosystem requires amplified pyrotag deep-sequencing analysis to provide a comprehensive assessment of an ecosystem's response to dietary change (43). Many of the bacterial genera identified in this experiment as impacted by diet represented less than 5% of the total epimural population. Alterations in these subpopulations may be the key to identifying key indicators that reflect the relative susceptibility of a host to developing subclinical or clinical acidosis.
Supplementary Material
ACKNOWLEDGMENTS
We acknowledge the contributions of L. Paterson, P. Lussier, B. Farr, W. Smart, K. Andrews, and other supporting staff at the Agriculture and Agri-Food Canada Research Centre.
Funding by the Agricultural By-products Program of Agriculture and Agri-Food Canada and the Alberta Crop Industry Development Fund is also gratefully appreciated.
Footnotes
Published ahead of print 12 April 2013
Supplemental material for this article may be found at http://dx.doi.org/10.1128/AEM.03983-12.
REFERENCES
- 1. Cheng K-J, Wallace RJ. 1979. The mechanism of passage of endogenous urea through the rumen wall and the role of ureolytic epithelial bacteria in the urea flux. Br. J. Nutr. 42:553–557 [DOI] [PubMed] [Google Scholar]
- 2. Dinsdale D, Cheng KJ, Wallace RJ, Goodlad RA. 1980. Digestion of epithelial tissue of the rumen wall by adherent bacteria in infused and conventionally fed sheep. Appl. Environ. Microbiol. 39:1059–1066 [DOI] [PMC free article] [PubMed] [Google Scholar]
- 3. McCowan RP, Cheng KJ, Bailey CB, Costerton JW. 1978. Adhesion of bacteria to epithelial cell surfaces within the reticulo-rumen of cattle. Appl. Environ. Microbiol. 35:149–155 [DOI] [PMC free article] [PubMed] [Google Scholar]
- 4. McCowan RP, Cheng KJ, Costerton JW. 1980. Adherent bacterial populations on the bovine rumen wall: distribution patterns of adherent bacteria. Appl. Environ. Microbiol. 39:233–241 [DOI] [PMC free article] [PubMed] [Google Scholar]
- 5. Kobayashi Y. 2006. Inclusion of novel bacteria in rumen microbiology: need for basic and applied science. Anim. Sci. J. 77:375–385 [Google Scholar]
- 6. Chen Y, Penner GB, Li M, Oba M, Guan LL. 2011. Changes in bacterial diversity associated with epithelial tissue in the beef cow rumen during the transition to a high-grain diet. Appl. Environ. Microbiol. 77:5770–5781 [DOI] [PMC free article] [PubMed] [Google Scholar]
- 7. Cheng K-J, Fay JP, Howarth RE, Costerton JW. 1980. Sequence of events in the digestion of fresh legume leaves by rumen bacteria. Appl. Environ. Microbiol. 40:613–625 [DOI] [PMC free article] [PubMed] [Google Scholar]
- 8. Kocherginskaya SA, Aminov RI, White BA. 2001. Analysis of the rumen bacterial diversity under two different diet conditions using denaturing gradient gel electrophoresis, random sequencing, and statistical ecology approaches. Anaerobe 7:119–134 [Google Scholar]
- 9. Tajima K, Aminov RI, Nagamine T, Matsui H, Nakamura M, Benno Y. 2001. Diet-dependent shifts in the bacterial population of the rumen revealed with real-time PCR. Appl. Environ. Microbiol. 67:2766–2774 [DOI] [PMC free article] [PubMed] [Google Scholar]
- 10. Sadet-Bourgeteau S, Martin C, Morgavi DP. 2010. Bacterial diversity dynamics in rumen epithelium of wethers fed forage and mixed concentrate forage diets. Vet. Microbiol. 146:98–104 [DOI] [PubMed] [Google Scholar]
- 11. Olfert ED, Cross BM, McWilliam AA. 1993. Guide to the care and use of experimental animals, vol 1 Canadian Council on Animal Care, Ottawa, Ontario, Canada [Google Scholar]
- 12. Penner GB, Beauchemin KA, Mutsvangwa T. 2006. An evaluation of the accuracy and precision of a stand-alone submersible continuous ruminal pH measurement system. J. Dairy Sci. 89:2132–2140 [DOI] [PubMed] [Google Scholar]
- 13. Kong Y, Teather R, Forster R. 2010. Composition, spatial distribution, and diversity of the bacterial communities in the rumen of cows fed different forages. FEMS Microbiol. Ecol. 74:612–622 [DOI] [PubMed] [Google Scholar]
- 14. Thuring RW, Sanders JP, Borst P. 1975. A freeze-squeeze method for recovering long DNA from agarose gels. Anal. Biochem. 66:213–220 [DOI] [PubMed] [Google Scholar]
- 15. Dowd S, Callaway T, Wolcott R, Sun Y, McKeehan T, Hagevoort R, Edrington T. 2008. Evaluation of the bacterial diversity in the feces of cattle using 16S rDNA bacterial tag-encoded FLX amplicon pyrosequencing (bTEFAP). BMC Microbiol. 8:125 doi: 10.1186/1471-2180-8-125 [DOI] [PMC free article] [PubMed] [Google Scholar]
- 16. Stevenson DM, Weimer PJ. 2007. Dominance of Prevotella and low abundance of classical ruminal bacterial species in the bovine rumen revealed by relative quantification real-time PCR. Appl. Microbiol. Biotechnol. 75:165–174 [DOI] [PubMed] [Google Scholar]
- 17. Schloss PD, Westcott SL, Ryabin T, Hall JR, Hartmann M, Hollister EB, Lesniewski RA, Oakley BB, Parks DH, Robinson CJ, Sahl JW, Stres B, Thallinger GG, Van Horn DJ, Weber CF. 2009. Introducing mothur: open-source, platform-independent, community-supported software for describing and comparing microbial communities. Appl. Environ. Microbiol. 75:7537–7541 [DOI] [PMC free article] [PubMed] [Google Scholar]
- 18. Huse SM, Welch DM, Morrison HG, Sogin ML. 2010. Ironing out the wrinkles in the rare biosphere through improved OTU clustering. Environ. Microbiol. 12:1889–1898 [DOI] [PMC free article] [PubMed] [Google Scholar]
- 19. Edgar R, Haas B, Clemente J, Quince C, Knight R. 2011. UCHIME improves sensitivity and speed of chimera detection. Bioinformatics 27:2194–2200 [DOI] [PMC free article] [PubMed] [Google Scholar]
- 20. Duval SM, McEwan NR, Graham RC, Wallace RJ, Newbold CJ. 2007. Effect of a blend of essential oil compounds on the colonization of starch-rich substrates by bacteria in the rumen. J. Appl. Microbiol. 103:2132–2141 [DOI] [PubMed] [Google Scholar]
- 21. Martin AP. 2002. Phylogenetic approaches for describing and comparing the diversity of microbial communities. Appl. Environ. Microbiol. 68:3673–3682 [DOI] [PMC free article] [PubMed] [Google Scholar]
- 22. Sadet S, Martin C, Meunier B, Morgavi DP. 2007. PCR-DGGE analysis reveals a distinct diversity in the bacterial population attached to the rumen epithelium. Animal 1:939–944 [DOI] [PubMed] [Google Scholar]
- 23. Li RW, Connor EE, Li C, Baldwin RL, VI, Sparks ME. 2012. Characterization of the rumen microbiota of pre-ruminant calves using metagenomic tools. Environ. Microbiol. 14:129–139 [DOI] [PubMed] [Google Scholar]
- 24. Li RW, Wu S, Baldwin RL, VI, Li W, Li C. 2012. Perturbation dynamics of the rumen microbiota in response to exogenous butyrate. PLoS One 7:e29392 doi: 10.1371/journal.pone.0029392 [DOI] [PMC free article] [PubMed] [Google Scholar]
- 25. Cho SJ, Cho KM, Shin EC, Lim WJ, Hong SY, Choi BR, Kang JM, Lee SM, Kim YH, Kim H, Yun HD. 2006. 16S rDNA analysis of bacterial diversity in three fractions of cow rumen. J. Microbiol. Biotechnol. 16:92–101 [Google Scholar]
- 26. Pryde S, Richardson A, Stewart C, Flint H. 1999. Molecular analysis of the microbial diversity present in the colonic wall, colonic lumen, and cecal lumen of a pig. Appl. Environ. Microbiol. 65:5372–5377 [DOI] [PMC free article] [PubMed] [Google Scholar]
- 27. Boone DR, Castenholz RW, Garrity GM. (ed). 2001. Bergey's manual of systematic bacteriology, 2nd ed Springer, New York, NY [Google Scholar]
- 28. Yang L, Chen J, Cheng X, Xi D, Yang S, Deng W, Mao H. 2010. Phylogenetic analysis of 16S rRNA gene sequences reveals rumen bacterial diversity in yaks (Bos grunniens). Mol. Biol. Rep. 37:553–562 [DOI] [PubMed] [Google Scholar]
- 29. Morita H, Shiratori C, Murakami M, Takami H, Toh H, Kato Y, Nakajima F, Takagi M, Akita H, Masaoka T, Hattori M. 2008. Sharpea azabuensis gen. nov., sp. nov., a Gram-positive, strictly anaerobic bacterium isolated from the faeces of thoroughbred horses. Int. J. Syst. Evol. Microbiol. 58:2682–2686 [DOI] [PubMed] [Google Scholar]
- 30. Bevans DW, Beauchemin KA, Schwartzkopf-Genswein KS, McKinnon JJ, McAllister TA. 2005. Effect of rapid or gradual grain adaptation on subacute acidosis and feed intake by feedlot cattle. J. Anim. Sci. 83:1116–1132 [DOI] [PubMed] [Google Scholar]
- 31. Schwartzkopf-Genswein KS, Beauchemin KA, McAllister TA, Gibb DJ, Streeter M, Kennedy AD. 2004. Effect of feed delivery fluctuations and feeding time on ruminal acidosis, growth performance, and feeding behavior of feedlot cattle. J. Anim. Sci. 82:3357–3365 [DOI] [PubMed] [Google Scholar]
- 32. DuPont AW, DuPont HL. 2011. The intestinal microbiota and chronic disorders of the gut. Nat. Rev. Gastroenterol. Hepatol. 8:523–531 [DOI] [PubMed] [Google Scholar]
- 33. Jami E, Mizrahi I. 2012. Composition and similarity of bovine rumen microbiota across individual animals. PLoS One 7:e33306 doi: 10.1371/journal.pone.0033306 [DOI] [PMC free article] [PubMed] [Google Scholar]
- 34. Kim M, Morrison M, Yu Z. 2011. Status of the phylogenetic diversity census of ruminal microbiomes. FEMS Microbiol. Ecol. 76:49–63 [DOI] [PubMed] [Google Scholar]
- 35. Khafipour E, Li S, Plaizier JC, Krause DO. 2009. Rumen microbiome composition determined using two nutritional models of subacute ruminal acidosis. Appl. Environ. Microbiol. 75:7115–7124 [DOI] [PMC free article] [PubMed] [Google Scholar]
- 36. Nagaraja TG, Titgemeyer EC. 2007. Ruminal acidosis in beef cattle: the current microbiological and nutritional outlook. J. Dairy Sci. 90:E17–E38 [DOI] [PubMed] [Google Scholar]
- 37. Costerton JW, Cheng KJ, Geesey GG, Ladd TI, Nickel JC, Dasgupta M, Marrie TJ. 1987. Bacterial biofilms in nature and disease. Annu. Rev. Microbiol. 41:435–464 [DOI] [PubMed] [Google Scholar]
- 38. Heilig HGHJ, Zoetendal EG, Vaughan EE, Marteau P, Akkermans ADL, de Vos WM. 2002. Molecular diversity of Lactobacillus spp. and other lactic acid bacteria in the human intestine as determined by specific amplification of 16S ribosomal DNA. Appl. Environ. Microbiol. 68:114–123 [DOI] [PMC free article] [PubMed] [Google Scholar]
- 39. Tajima K, Arai S, Ogata K, Nagamine T, Matsui H, Nakamura M, Aminov RI, Benno Y. 2000. Rumen bacterial community transition during adaptation to high-grain diet. Anaerobe 6:273–284 [Google Scholar]
- 40. Goad DW, Goad CL, Nagaraja TG. 1998. Ruminal microbial and fermentative changes associated with experimentally induced subacute acidosis in steers. J. Anim. Sci. 76:234–241 [DOI] [PubMed] [Google Scholar]
- 41. Petri RM, Forster RJ, Yang W, McKinnon JJ, McAllister TA. 2012. Characterization of rumen bacterial diversity and fermentation parameters in concentrate fed cattle with and without forage. J. Appl. Microbiol. 112:1152–1162 [DOI] [PubMed] [Google Scholar]
- 42. Penner GB, Aschenbach JR, Gäbel G, Rackwitz R, Oba M. 2009. Epithelial capacity for apical uptake of short chain fatty acids is a key determinant for intraruminal pH and the susceptibility to subacute ruminal acidosis in sheep. J. Nutr. 139:1714–1720 [DOI] [PubMed] [Google Scholar]
- 43. Deng W, Xi D, Mao H, Wanapat M. 2008. The use of molecular techniques based on ribosomal RNA and DNA for rumen microbial ecosystem studies: a review. Mol. Biol. Rep. 35:265–274 [DOI] [PubMed] [Google Scholar]
- 44. Maeda H, Fujimoto C, Haruki Y, Maeda T, Kokeguchi S, Petelin M, Arai H, Tanimoto I. 2003. Quantitative real-time PCR using TaqMan and SYBR green for Actinobacillus actinomycetemcomitans, Porphyromonas gingivalis, Prevotella intermedia, tetQ gene and total bacteria. FEMS Immunol. Med. Microbiol. 39:81–86 [DOI] [PubMed] [Google Scholar]
- 45. Weimer PJ, Stevenson DM, Mertens DR, Thomas EE. 2008. Effect of monensin feeding and withdrawal on populations of individual bacterial species in the rumen of lactating dairy cows fed high-starch rations. Appl. Microbiol. Biotechnol. 80:135–145 [DOI] [PubMed] [Google Scholar]
- 46. Li M, Penner GB, Hernandez‐Sanabria E, Oba M, Guan LL. 2009. Effects of sampling location and time, and host animal on assessment of bacterial diversity and fermentation parameters in the bovine rumen. J. Appl. Microbiol. 107:1924–1934 [DOI] [PubMed] [Google Scholar]
Associated Data
This section collects any data citations, data availability statements, or supplementary materials included in this article.