

Abstract
Tannerella forsythia is a Gram-negative anaerobic organism that inhabits subgingival plaque biofilms and is covered with a so far unique surface layer composed of two glycoproteins. It belongs to the so-called “red complex” of bacteria comprising species that are associated with periodontal disease. While the surface layer glycoprotein glycan structure had been elucidated recently and found to be a virulence factor, no structural data on the lipopolysaccharide (LPS) of this organism were available. In this study, the T. forsythia LPS structure was partially elucidated by a combined mass spectrometry (MS) and nuclear magnetic resonance spectroscopy (NMR) approach and initial experiments to characterize its immunostimulatory potential were performed. The T. forsythia LPS is a complex, rough-type LPS with a core region composed of one 3-deoxy-d-manno-oct-2-ulosonic acid (Kdo) residue, three mannose residues, and two glucosamine residues. MS analyses of O-deacylated LPS proved that, in addition, one phosphoethanolamine residue and most likely one galactose-phosphate residue were present, however, their positions could not be identified. Stimulation of human macrophages with T. forsythia LPS resulted in the production of the proinflammatory cytokines interleukin-1 (IL-1), IL-6, and tumor necrosis factor alpha in a dose-dependent manner. The response to T. forsythia LPS was observed only upon stimulation in the presence of fetal calf serum (FCS), whereas no cytokine production was observed in the absence of FCS. This finding suggests that the presence of certain additional cofactors is crucial for the immune response induced by T. forsythia LPS.
INTRODUCTION
The Gram-negative obligate anaerobic bacterium Tannerella forsythia is considered one of the most potent bacterial mediators of periodontitis, a multifactorial inflammatory disease that leads to the destruction of tooth-supporting tissue through the formation of periodontal pockets and the adsorption of alveolar bone (1, 2). Together with the two other Gram-negative species Porphyromonas gingivalis and Treponema denticola, this organism forms a consortium of periodontopathogens termed the “red complex,” which has not only been associated with the chronic form of periodontitis (3) but also exerts a potential impact on systemic health (4, 5). The host response to periodontopathogens and especially to their cell surface structures as the immediate contact zone with the environment, as well against their products, is a critical determinant that modulates the progression of periodontitis toward tissue destruction and healing (6, 7).
T. forsythia virulence factors are beginning to be adequately identified and characterized (8), including the surface antigen BspA (9), a hemagglutinin (10), cell envelope lipoproteins (11), cell surface proteolytic enzymes (12, 13), glycosidases (14, 15), and the cell surface (S) layer (16–18). The latter is glycosylated at multiple sites with a complex O-glycan (19), constituents of which have been shown to suppress T-helper 17 responses in dendritic cells and increase periodontal bone loss in mice (20).
Besides that, LPS, which is present in the outer membrane of most Gram-negative bacteria for both its structural and functional integrity, is a well-known immunostimulatory agent serving as one of the primary targets of the innate arm of the mammalian immune system. Recognition of the presence of LPS by immune cells such as monocytes and macrophages has evolved to provide the mammalian host with a rapid recognition of and reactions to Gram-negative infection (21). This innate response to LPS typically involves the release of a range of proinflammatory mediators, such as TNF-α, IL-6, and IL-1α, which prime the immune system to eliminate the invading bacterium. A few reports in the literature are available that deal with the immune response elicited by the LPSs of periodontopathogens; these include also, in a comparative manner, information on the immunological potential of the T. forsythia LPS, however, without the use of a purified preparation. Whole cells of P. gingivalis, T. denticola, and T. forsythia, as well as their LPS, alone and in combination, were analyzed for the secretion of IL-6 and IL-8 in an ex vivo whole-blood model (22). Using this model, T. forsythia LPS could, for instance, be correlated with the upregulation of these proinflammatory cytokines and it was shown to induce their production by human macrophages, with the IL-8 secretion level of T. forsythia LPS being about 1.5 times the effect of P. gingivalis LPS (22). As it is conceivable that much of the pathophysiological potential of T. forsythia derives directly from the structure of the LPS it expresses, it is surprising that this has not been investigated so far.
Smooth (S)-type LPS usually comprises three functional regions (23), namely, (i) a lipid portion (lipid A) that, in the case of toxic LPS, represents its endotoxic moiety; (ii) a polysaccharide, comprising a nonrepetitive OS (the core region); and (iii) the O-specific polysaccharide (O antigen) usually consisting of repeating units of various sugars. In contrast, rough (R)-type LPS naturally lacks the O antigen and has been identified in a variety of organisms, such as Helicobacter pylori (24) and Salmonella spp. (25).
Because of the lack of knowledge of the T. forsythia LPS, structure-function studies do not yet exist but are considered essential to further understand the pathogen's general lifestyle, its way of interfering with the surrounding environment, and its potential contribution to disease development. Here, we report the first structural analysis of the LPS from T. forsythia along with immunological data showing its potency to stimulate inflammatory responses in an in vitro cell culture model.
MATERIALS AND METHODS
Abbreviations.
The following abbreviations are used in this work: S, smooth; R, rough; 1D and 2D, one- and two-dimensional, respectively; COSY, 2D homonuclear correlation spectroscopy; ESI FT-ICR MS, electrospray Fourier-transformed ion cyclotron resonance mass spectrometry; Hex, hexose; HexN, hexosamine; HMBC; heteronuclear multiple bond correlation; HSQC, heteronuclear (1H-13C) single quantum correlation-distortionless enhancement by polarization transfer; Kdo, 3-deoxy-d-manno-oct-2-ulosonic acid; IL-1, interleukin-1; NMR, nuclear magnetic resonance spectroscopy; TNF-α, tumor necrosis factor alpha; TOCSY, total correlation spectroscopy; ROESY, rotating frame Overhauser enhancement spectroscopy; PEtN, phosphoethanolamine; Manp, mannose; GlcpN, glucosamine; FCS, fetal calf serum; LPS, lipopolysaccharide; GLC, gas-liquid chromatography; FID, flame ionization detector; OS, oligosaccharide; GAPDH, glyceraldehyde 3-phosphate dehydrogenase; qPCR, quantitative PCR; CT, cycle threshold; ELISA, enzyme-linked immunosorbent assay; SD, standard deviation; Gal, galactose; EtN, 2-aminoethanol; NOE, nuclear Overhauser effect; TLR4, Toll-like receptor 4.
Bacterial strain and LPS isolation.
T. forsythia ATCC 43037 was grown anaerobically in tryptic soy broth (30 g/liter; Gerbu) supplemented with yeast extract (5 g/liter; Becton, Dickinson), phytone peptone (5 g/liter; Becton, Dickinson), cysteine (0.2 g/liter; Sigma-Aldrich), horse serum (50 ml/liter; PAA), hemin (2.5 μg/ml, Sigma-Aldrich), menadione (2 μg/ml, Sigma-Aldrich), and N-acetylmuramic acid (10 μg/ml; Sigma-Aldrich). Following incubation at 37°C for 5 days, cells were harvested by centrifugation (6,000 × g, 15 min) and freeze-dried.
Freeze-dried bacteria from a 10-liter batch culture were washed with ethanol and acetone once each, resuspended in diethyl ether, and dried again. The resulting dry mass was treated with RNase (Sigma-Aldrich), DNase (Roche), and finally proteinase K (Roche) at 60 μg/ml each at 22°C for 12 h in 0.1 M Tris-HCl containing 0.01 M MgCl2 and 0.05 M NaCl. LPS was subsequently extracted by applying the phenol-chloroform/light petroleum (PCP; 2:5:8 [vol/vol/vol]) extraction protocol (26). After three washes with acetone (10 ml each), the LPS was lyophilized, aliquoted, and stored until use.
General analytical methods.
The T. forsythia LPS preparation was analyzed by standard SDS-PAGE on 12% slab gels (27) using a Protean II electrophoresis apparatus (Bio-Rad). Protein bands were detected with Coomassie brilliant blue G-250 staining reagent, and LPS was visualized by silver staining for carbohydrates (28). As standards, the PageRuler Plus prestained protein ladder (Thermo Fisher Scientific) and Salmonella enterica LT2 LPS were used, respectively.
The T. forsythia LPS preparation was analyzed for its muramic acid and amino acid contents after the hydrolysis of a 1-mg sample with 200 μl of 4 N HCl for 4 h at 110°C. Dried samples were resuspended in 200 μl of 0.2 M sodium citrate buffer (pH 2.2; Biochrom) and analyzed on a Biochrom 30 amino acid analyzer (Biochrom).
Compositional analyses.
The composition of the LPS was determined by methanolysis (2 N HCl-methanol, 85°C, 2 h), followed by acetylation (85°C, 10 min) and analysis by GLC-MS (Hewlett-Packard HP 5890 series II gas chromatograph equipped with a fused-silica SPB-5 column [Supelco; 30 m by 0.25 mm by 0.25 μm {film thickness}], an FID, and an MS 5989A mass spectrometer with a 59827A vacuum gauge controller). The temperature program was 150°C for 3 min and then a 5°C/min increase to 330°C. Neutral sugars were identified as their alditol acetates after hydrolysis (0.1 M HCl, 100°C, 48 h), reduction (NaBH4, 20 to 22°C, 16 h in the dark), and acetylation (85°C for 10 min) (29) by GLC (HP 5890 series II gas chromatograph with an FID, a polysilican SPD-5 column [Agilent Technologies; 30 m by 2.5 mm by 0.25 μm]), and helium as the carrier gas (70 kPa). The temperature program was 3 min at 150°C and then 3°C/min to 320°C. Amino sugars were identified by automated amino acid analysis after hydrolysis (4 N HCl, 100°C, 18 h). The determination of the absolute configuration of the sugars was performed as described previously (30), as was fatty acid analysis (31). The contents of Kdo and organic phosphate were determined photometrically (31). Methylation was carried out as described elsewhere (32).
Isolation of saccharides.
LPS (5.3 mg) was treated with 1% acetic acid for 6 h at 100°C, and the OS fraction was separated by ultracentrifugation (138,700 × g, 4°C, 3 h) and then lyophilized (2.3 mg, 43.4% of the LPS). In another experiment, the LPS (34 mg) was O deacylated with absolute hydrazine (33) (23.3 mg, 68% of the LPS), which was then dephosphorylated (48% aqueous hydrofluoric acid, 48 h, 4°C), reduced (NaBH4, 20 to 22°C, 16 h in the dark, 16.4 mg, 48% of the LPS), and finally N deacylated with hot 4 M KOH (5.15 mg, 15% of the LPS) (33).
MS.
ESI FT-ICR MS was performed in the negative-ion mode with an APEX Qe instrument (Bruker Daltonics) equipped with a 7-T magnet and a dual Apollo ion source. Mass spectra were acquired in broad-band modes. The samples (∼10 ng/μl) were dissolved in a 50:50:0.001 (vol/vol/vol) mixture of 2-propanol, water, and triethylamine. The samples were sprayed at a flow rate of 2 μl/min. The capillary entrance voltage was set to 3.8 kV, and the drying gas temperature was 150°C. Mass spectra were charge deconvoluted, and the mass values reported were referred to the monoisotopic masses of neutral molecules.
NMR spectroscopy.
NMR experiments were carried out after H-2H exchange of the samples using 99.9% 2H2O. All 1D (1H-13C) and 2D homonuclear (1H-1H) COSY, TOCSY, ROESY, and HSQC experiments were recorded at 298 K with a Bruker DRX Avance 700-MHz spectrometer (operating frequencies, 700.75 MHz for 1H NMR and 176.2 MHz for 13C NMR) equipped with a 5-mm CPQCI multinuclear-inverse cryo-probehead with a z gradient, and standard Bruker software was used. Chemical shifts were reported relative to an internal standard of acetone (δH, 2.225; δC, 31.45).
Cell line and LPS stimulation.
The U937 monocytic cell line was purchased from ATCC and maintained in RPMI 1640 medium supplemented with 10% FCS, 100 μg/ml penicillin, and 100 μg/ml streptomycin in a humidified atmosphere containing 5% CO2. This cell line was chosen because of its improved stability compared to that of an oral cell line. Differentiation into adherent macrophages was performed by the addition of 0.2 μg of phorbol 12-myristate 13-acetate (Sigma)/ml of freshly seeded cells (106 cells/ml) for 72 h.
For stimulation assays, adherent U937 macrophages were seeded into the wells of a 24-well plate at 105 per well containing 0.5 ml of RPMI 1640 medium without or with FCS (2%). Cells were stimulated with T. forsythia LPS at final concentrations ranging from 0.01 to 10 μg/ml for 24 h. Cells stimulated with P. gingivalis LPS (1 μg/ml; Life Technologies) and Escherichia coli O111:B4 LPS (100 ng/ml; Life Technologies) were taken as positive controls, and nonstimulated cells were taken as a negative control. Each experimental group included three wells. After 24 h, the cellular IL-1, IL-6, and TNF-α mRNA expression levels and the contents of corresponding proteins in the conditioned medium were determined.
qPCR and cytokine determination.
The IL-1, IL-6, and TNF-α mRNA expression levels were determined by qPCR (34) with the GAPDH-encoding gene as an internal reference. Isolation of mRNA from 105 cells each and transcription into cDNA were performed with the TaqMan Gene Expression Cells-to-CT kit (Ambion/Applied Biosystems). qPCR was performed on an ABI Prism SDS 7000 device (Applied Biosystems) in paired reactions with TaqMan gene expression assays with the following identification numbers (all from Applied Biosystems): IL-1, Hs01555413_m1; TNF-α, Hs99999043_m1; IL-6, Hs00985641_m1. qPCRs were performed in triplicate under the following thermocycling conditions: 95°C for 10 min and 40 cycles of 15 s at 95°C and 2 min at 60°C. The point at which the PCR product was first detected above a fixed threshold (CT) was determined for each sample. Changes in the expression of target genes were calculated by the 2−ΔΔCT method, where ΔΔCT = (CTtarget − CTGAPDH)sample − (CTtarget − CTGAPDH)control, with an untreated sample as a control.
The levels of IL-1, IL-6, and TNF-α in the conditioned medium were determined by ELISA with Ready-SET-Go kits (eBioscience). For measurements, all cytokines were diluted 1:10. The detection limit was 2 pg/ml.
Statistical analysis.
The statistical significance of differences was analyzed in SPSS 17.0 by analysis of variance, and paired comparisons were performed by Tukey's post hoc test. Data are expressed as means ± SDs. Differences were considered to be statistically significant at a P of <0.05.
RESULTS
Isolation of LPS and compositional analyses.
T. forsythia ATCC 43037 LPS was extracted from delipidated and enzymatically treated, freeze-dried T. forsythia biomass at a yield of 3.7% (192 mg LPS obtained from 5.1 g of original dry mass). LPS silver staining was indicative of the presence of an R-type LPS, lacking the typical banding pattern in the SDS-PAGE gel that is commonly observed for O-antigen repeats in S-type LPS and as evidenced by the LPS of S. enterica LT2, which was used as a reference (Fig. 1). SDS-PAGE and Coomassie blue staining of the T. forsythia LPS, in combination with amino acid analysis, confirmed that the preparation was essentially free of contaminating proteins (data not shown). The presence of peptidoglycan was ruled out, since muramic acid, which was taken as a trace component of peptidoglycan, could not be detected in the sample.
Fig 1.

Silver-stained SDS-PAGE of the T. forsythia LPS extracted by the PCP protocol. Lanes: M, PageRuler Plus prestained protein molecular size ladder (Thermo Fisher Scientific); 1, T. forsythia wild-type biomass; 2, S. enterica LT2 LPS; 3, T. forsythia LPS (1.5 μg). S. enterica LT2 produces an S-type LPS, which is indicated by a ladder-like banding pattern covering the entire molecular size range. In comparison, the isolated T. forsythia LPS shows different migration behavior, with signals visible mainly in the low-molecular-mass region. This is characteristic of the presence of an R-type LPS.
In qualitative compositional analyses of the methanolyzed and acetylated sample by GLC-MS, the main fatty acids 15:0, 16:0(3-OH), and 17:0(3-OH), together with minor amounts of 18:0, 14:0(3-OH), 15:0(3-OH), Hex, and HexN and small amounts of Kdo phosphate, were identified. In addition, the disaccharide HexN-Hex was found. Quantitative compositional analyses revealed the presence of Manp (172 nmol/mg), Gal (132 nmol/mg), GlcpN (699 nmol/mg), EtN, (192 nmol/mg), 15:0 (421 nmol/mg), 16:0(3-OH) (912 nmol/mg), and 17:0(3-OH) (150 nmol/mg), as well as other fatty acids (see above) in small amounts. Kdo was identified at a very low level only (11 nmol/mg), probably because of its replacement with phosphate, whereas organic bound phosphate was clearly present (452 nmol/mg). It should be noted that, as shown below, the level of Manp determined was much too low because of the quite acid-stable replacement of two Manp residues with GlcpN.
MS analysis.
The structure of O-deacylated LPS was analyzed by high-resolution ESI FT-ICR MS in the negative-ion mode (Fig. 2A). Under normal, soft ionization conditions, a group of intensive signals in the mass range of 2,200 to 2,400 u was observed. In accordance with the results obtained by the component analysis, the most abundant peak (monoisotopic neutral mass, 2,321.9400 u) is in good agreement with a molecule consisting of four HexN residues, four Hex residues, and one Kdo residue, as well as two phosphates, one PEtN, and two 16:0(3-OH) residues (calculated mass, 2,321.9457 u). The accurate mass difference between the most prominent peak and the other peaks resulted from heterogeneity due to different fatty acid chain lengths (Δm = +14 u and −28 u) and missing P and PEtN groups (Δm = 79.96 and 123.004 u, respectively). Peaks not labeled in the figure refer to respective Na and K adduct ions.
Fig 2.

Charge-deconvoluted ESI FT-ICR mass spectrum of O-deacylated LPS obtained in the negative-ion mode. Mass values refer to the neutral monoisotopic mass. (A) ESI FT-ICR mass spectrum obtained under soft ionization conditions. (B) ESI FT-ICR mass spectrum obtained after unspecific fragmentation.
To obtain more detailed information about the LPS structure, unspecific fragmentation of the sample was induced by increasing the collision voltage of the quadrupole interface from 5 V to 30 V. Under these conditions, the labile linkage between lipid A and the core OS is cleaved (35). The mass spectrum shows an intensive Y fragment (928.561 u) with satellite peaks with Δm values of +14 u and −28 u representing the lipid A moiety consisting of two GlcpN, two OH (16:0), and one P (calculated mass, 928.564 u) (Fig. 2B). The B fragment representing the core OS has a mass of 1,393.373 u consisting of one Kdo, four Hex, two HexN, one P, and one PEtN–H2O (calculated mass, 1,393.382 u). The corresponding Y and B fragments sum up to the O-deacylated LPS shown in Fig. 2A. The other mass peaks originate from further fragmentation of the B fragment by decarboxylation of Kdo (Δm = 43.988 u), lack of PEtN (Δm = 123.004 u) and Hex (Δm = 162.05 u), and cleavage of P (Δm = 97.977 u).
Isolation and structural analysis of the LPS carbohydrate backbone.
To identify the carbohydrate backbone, the LPS was O deacylated, dephosphorylated, reduced, and N deacylated and then desalted and separated by high-performance anion-exchange chromatography, from which one major fraction (OS1) was obtained that was subsequently investigated by 1D and 2D homo- and heteronuclear NMR spectroscopy. The chemical shift assignments are listed in Table 1, combined with the information obtained from 2D 1H-1H COSY, TOCSY, and ROESY, as well as 2D 1H-13C HSQC and HMBC experiments. The 1H NMR spectrum of OS1 identified six signals in the anomeric region at δH 4.60 (residue B), 5.04 (E), 5.14 (F), 4.90 (G), 5.23 (H), and 5.15 (K). Residues A and C were identified as GlcpNol (H-1a,b δ, 3.77/3.87; H-6a,b δ, 3.82/4.16) and Kdo (H-3ax δ, 1.87; H-3eq δ, 2.13), respectively. Monosaccharides were identified on the basis of typical COSY, TOCSY, and NOE signal patterns, as well as the positions of 13C signals.
Table 1.
NMR data for OS1 obtained from T. forsythia LPSa
| Compound, residue | H/C-1 | H/C-2 | H(ax,eq)/C-3b | H/C-4 | H/C-5 | H(a,b)/C-6 | H/C-7 | H(a,b)/C-8 |
|---|---|---|---|---|---|---|---|---|
| GlcpNol, A | 3.77/3.87 | 3.53 | 4.11 | 3.95 | 3.89 | 3.82/4.16 | ||
| 60.1 | 56.5 | 67.1 | 70.5 | 71.8 | 73.0 | |||
| GlcpN, B | 4.60 | 2.88 | 3.51 | 3.49 | 3.62 | 3.59/3.62 | ||
| 102.8 | 57.3 | 75.2 | 71.2 | 75.6 | 62.9 | |||
| Kdo, C | 1.87, 2.13 | 4.16 | 4.13 | 3.70 | 3.84 | 3.66/3.96 | ||
| 175.7 | 101.0 | 36.1 | 67.1 | 76.8 | 72.8 | 70.7 | 64.7 | |
| Manp, E | 5.04 | 4.16 | 3.99 | 3.92 | 4.22 | 3.65/4.00 | ||
| 102.7 | 71.3 | 80.1 | 66.8 | 72.6 | 66.6 | |||
| Manp, F | 5.14 | 4.11 | 3.94 | 3.94 | 3.67 | 3.68/4.20 | ||
| 104.0 | 71.2 | 72.1 | 67.1 | 72.1 | 66.4 | |||
| Manp, G | 4.90 | 4.02 | 3.85 | 3.84 | 3.82 | 3.71/4.10 | ||
| 101.0 | 71.1 | 71.3 | 67.3 | 72.2 | 66.7 | |||
| GlcpN, H | 5.23 | 3.37 | 3.92 | 3.52 | 3.77 | 3.81/3.88 | ||
| 96.7 | 55.3 | 71.4 | 70.6 | 73.4 | 61.5 | |||
| GlcpN, K | 5.15 | 3.29 | 3.90 | 3.50 | 3.77 | 3.81/3.88 | ||
| 96.8 | 55.3 | 71.5 | 70.6 | 73.4 | 61.5 |
Spectra were recorded at 25°C with a solution of the sample in D2O, relative to an internal standard of acetone (δH, 2.225; δC, 31.45). The values shown are chemical shift assignments. Where two values are shown, there are two H atoms [designated H(a,b)] per C atom.
H-3ax and H-3eq are the axial and equatorial H-3 of Kdo, respectively.
The spin system with the anomeric signal B (δH, 4.60) originated from a β-d-GlcpN residue; the β configuration was established on the basis of a large J1,2 coupling constant (8 Hz). An HSQC experiment (Fig. 3) provided the direct correlation of all assigned 1H and 13C signals. Nitrogen substitution at C-2 was proven by the cross peak H-2/C-2 identifying a chemical shift of C-2 characteristic of a carbon atom bearing an amino function (δC, 57.3). A slight downfield shift of the C-6 signal (δC, 62.9) identified this position to be replaced with Kdo (36, 37).
Fig 3.
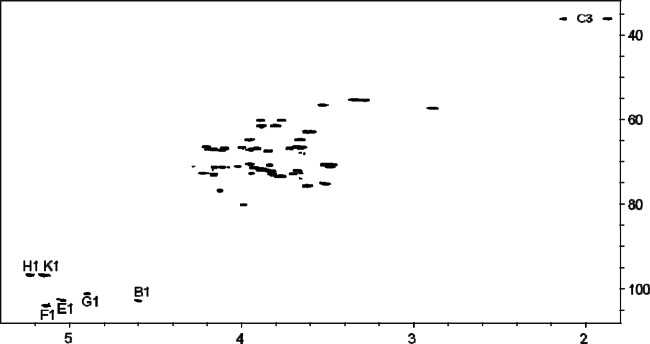
1H-13C HSQC correlation spectrum of OS1 obtained from the LPS of T. forsythia.
Residues E, F, and G were identified as α-d-Manp units. The manno configuration was suggested by small J1,2 coupling constants (<3 Hz) of the anomeric proton signals at δ 5.04, 5.14, and 4.90 and the absence of intraresidual NOEs between H-1 and H-3,5. The downfield-shifted C-3 signal (δ, 79.46) proved the replacement of B at this position.
Residues H and K are terminal α-d-GlcpN residues. The gluco configuration was suggested by an intraresidual NOE connectivity between H-2 and overlapping signals at 3.53/3.50 which originated from the H-4 protons, respectively. The α linkage was suggested by J1,2 3.5 Hz. Nitrogen substitution at C-2 was indicated by the cross-peak H-2/C-2 identifying a chemical shift of C-2 characteristic for a carbon atom bearing an amino function (δ, 55.3 in both cases).
The monosaccharide sequence of the sugars was established from the observed interresidual NOE and HMBC cross peaks, i.e., B, H-1/A, H-6; E, H-1/C, H-5; G, H-1/E, H-6; F, H-1/E, H-3; H, H-1/F, H-6; K, H-1/G, H-6.
Since MS data indicated the presence of a Hex phosphodiester group that was cleaved and separated during the preparation procedure described above, O-deacylated LPS (the mild hydrazinolysis does not cleave phosphodiester groups) was investigated by NMR spectroscopy. However, none of the solvents used, including D2O, dimethyl sulfoxide-d6, and deuterated 1,2-diheptanoyl-sn-glycero-3-phosphocholine in D2O (U. Zähringer, personal communication), resulted in good signal resolution. Still, 1H-31P correlation identified three phosphate signals, one of which was linked to an anomeric carbon (probably of GlcpN A of lipid A), the second one was replaced with EtN, and the third one correlated either with an anomeric or a nonanomeric proton (1H signals overlapped). Thus, the spin systems of the phosphodiester moiety could not be unequivocally identified. Figure 4 shows the structure of the T. forsythia LPS according to the current state of research.
Fig 4.
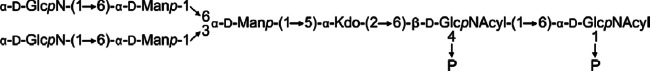
Structure of the T. forsythia O-deacylated R-type LPS as determined by NMR spectroscopy and MS [Acyl, 16:0(3-OH)]. In addition, on the basis of MS experiments, two phosphate residues, one ethanolamine residue, and one d-Gal residue are attached to the core region elsewhere.
Cytokine production of U-937 macrophages upon LPS stimulation.
In a macrophage cell culture model, the production of the proinflammatory cytokines IL-1, IL-6, and TNF-α upon stimulation with T. forsythia LPS in the presence or absence of FCS was investigated (Fig. 5). Cells stimulated with P. gingivalis LPS or E. coli LPS were used as positive controls. Cytokine production by U937 macrophages upon stimulation with T. forsythia LPS was substantially dependent on the presence of FCS. Particularly, a significant increase in cytokine production in serum-containing medium was observed. The presence of FCS during stimulation resulted in up to five times higher levels of IL-1 and TNF-α mRNA expression and an increase of up to 25-fold in that of IL-6 (P < 0.01 for all cytokines). Qualitatively similar results were obtained by ELISA showing significant differences in IL-6 and TNF-α. An increase in IL-1 was also observed, but it was not significant. A significant increase in cytokine expression upon the addition of FCS to the medium was also observed for E. coli LPS but not for P. gingivalis LPS.
Fig 5.

Cytokine expression levels upon stimulation of U937 macrophages with E. coli (0.1 μg/ml), P. gingivalis, and T. forsythia (1 μg/ml) LPS in the presence or absence of FCS. In both qPCR (A) and ELISA (B), P. gingivalis LPS did not show serum dependence for cytokine production. E. coli and T. forsythia LPS caused a substantially higher release of IL-1β, IL-6, and TNF-α in the presence of serum. The data are mean values ± SDs of three wells originating from one representative experiment. A similar tendency was observed in other experiments. *, significantly different from the control at P < 0.01; #, significantly greater cytokine release (with FCS versus without FCS) at P < 0.01.
Next, we investigated the dose-dependent cytokine response of macrophages in FCS-containing medium following stimulation with T. forsythia LPS in the range of 0.01 to 10 μg/ml (Fig. 6). All three cytokines measured showed a dose-dependent increase in mRNA expression up to a concentration of 0.5 μg/ml, whereas no further increase was observed at higher LPS concentrations. In ELISA, IL-6 release was dose dependent over the whole range of LPS concentrations applied, whereas the release of IL-1 and TNF-α reached a maximum value at 1.0 and 0.5 μg/ml, respectively.
Fig 6.

Dose-dependent cytokine expression in U937 macrophages upon stimulation with T. forsythia LPS. Macrophages were stimulated with LPS concentrations ranging from 0.01 to 10 μg/ml in medium containing 2% FCS for 24 h, and the IL-1β, IL-6, and TNF-α mRNA expression levels (A) and the contents of the corresponding proteins (B) were measured by qPCR and ELISA, respectively. The data are mean values ± SDs of three wells originating from one representative experiment. A similar tendency was observed in other experiments. *, significantly different from the control (P < 0.01). Ec, E. coli; Tf, T. forsythia; Pg, P. gingivalis.
DISCUSSION
The LPS of T. forsythia was isolated by applying the PCP protocol and demonstrated to be an R-type LPS. After deacylation, dephosphorylation, and reduction, OS1 was isolated as the major compound and its structure was determined (Fig. 4). The core region is composed of one Kdo, three Manp, and two GlcpN residues. MS analyses of O-deacylated LPS clearly proved that, in addition, one PEtN residue and most likely one galactose-phosphate residue were present. However, the positions of the latter residues could not be identified. On the one hand, this was due to cleavage under the various chemical analysis conditions used, which could be expected. On the other hand, and surprisingly, NMR signals could not be fully assigned because of bad resolution, although various solvents were used that had been successfully used with other samples earlier. Thus, the complete structure of the T. forsythia LPS backbone could not be elucidated.
According to our data, the core region of the T. forsythia LPS is free of heptose; instead, one d-Manp residue was found to replace Kdo. Several heptose-free core regions have been identified in the past, e.g., in the LPS of various Acinetobacter and Rhizobium species or in Legionella pneumophila and Ochrobactrum anthropi (38–41). Interestingly, in the cores of the latter three organisms, d-Manp was the sugar that replaced Kdo at O-4. In the L. pneumophila and O. anthropi cores, this very d-Manp residue is substituted with d-GlcpN, which possessed a free amino group in the core of the O. anthropi LPS (which was acetylated in Legionella), as found in T. forsythia. Overall, the charge of the T. forsythia core region appeared to be rather neutral because of the presence of three potentially positive charges (two GlcpN residues and one PEtN residue) and three negative charges (one putative phosphodiester built of Galp-P and another sugar [probably Kdo], one PEtN residue, and one Kdo residue). This is interesting since an overall negative charge is usually required to stabilize the Gram-negative cell envelope by ionic bridges using bivalent cations like Mg2+ or Ca2+. On the other hand, some core regions with a zwitterionic character have also been identified in certain bacterial polysaccharides earlier (42). However, it is currently unclear if and how these core region properties contribute to the virulence of T. forsythia.
The O-deacylated lipid A comprised a β(1→6)-linked GlcpN disaccharide that is substituted with two phosphate residues, assumed to be located at the O-1 and O-4′ positions, as found in many other lipid A molecules (43–45), and possessed two amide-linked (R)-16:0(3-OH) residues. Amide-linked (R)-16:0(3-OH) residues have previously been identified in various other lipid A molecules, such as those of Helicobacter pylori, Bacteroides fragilis, Burkholderia caryophylli, and Burkholderia cepacia (44, 45). For the T. forsythia LPS, however, the fatty acid distribution could not be identified since MS of the complete LPS was not successful.
T. forsythia LPS induced the production of the proinflammatory cytokines IL-1, TNF-α, and IL-6 in human U937 macrophages. Increases in the T. forsythia LPS concentration in the range of 0.01 to 1.0 μg/ml resulted in a dose-dependent release of cytokines. At higher LPS concentrations, no further increase was observed. The maximum level of cytokine production induced by T. forsythia LPS was comparable to that induced by P. gingivalis LPS and E. coli LPS (46, 47). Remarkably, Bodet and coworkers (48) investigated the inflammatory responses in a U937 macrophage-epithelial cell coculture model using T. forsythia LPS both alone and in combination with P. gingivalis or T. denticola LPS as a stimulus but were not able to measure significant IL-1, IL-6, or TNF-α secretion. Indeed, there may be a multitude of other factors influencing this observation, but it might be explained, in part, by the relatively small amount of serum used in this previous study during stimulation. In our study, the cytokine production by human U937 macrophages upon stimulation with T. forsythia LPS was shown to be strongly dependent on the presence of FCS. Especially, the expression levels of IL-6 and TNF-α were markedly higher when cells were stimulated in serum-containing medium. These data suggest that T. forsythia LPS requires serum cofactors to initiate an immune response. When these cofactors are missing, T. forsythia LPS does not have the potency to trigger significant upregulation of proinflammatory cytokines in the early stage of the immune response. Qualitatively similar results were obtained when cells were stimulated with E. coli LPS. In contrast, the levels of proinflammatory cytokines upon stimulation with P. gingivalis LPS were high even in the absence of serum and no marked increase in these levels upon the addition of serum was observed.
It is well known that E. coli LPS and P. gingivalis LPS have significant structural differences and, consequently, different functional properties (49, 50). E. coli LPS is associated with activation of TLR4, which triggers a signal transduction cascade leading to the production of proinflammatory cytokines (51). The activation of TLR4 by E. coli LPS requires several additional cofactors, like the LPS binding protein, CD14, and the adaptor molecule MD-2 (52–56). Thus, the dependence of the E. coli-induced response for TLR4 activation on the presence of serum could be explained by the requirement of all of these factors, which are usually present in FCS. In contrast, P. gingivalis LPS signaling occurs through both TLR4 and TLR2, depending on the cell type used (57). Moreover, Darveau et al. (50) showed that P. gingivalis LPS does not require MD-2 for TLR2 activation but is dependent on MD-2 for TLR4 activation. This finding could explain why the cytokine production in response to P. gingivalis LPS was observed in the presence, as well in the absence, of FCS. These data suggest that (i) the lipid A present in the T. forsythia LPS should possess a structure similar to that of the LPS from E. coli—however, detailed structural investigations of the lipid A portion could not be finished in the course of this study—and (ii) activation of cytokine production by T. forsythia LPS might require similar additional cofactors like E. coli LPS. The exact mechanisms underlying T. forsythia LPS signaling remain to be investigated in further studies.
ACKNOWLEDGMENTS
We appreciate the gift of S. enterica LT2 LPS from Mario Feldman, Alberta Glycomics Centre, Department of Biological Sciences, University of Alberta, Edmonton, AB, Canada. We thank Ulrich Zähringer (Research Center Borstel) for sharing unpublished data. The expert technical assistance of Katharina Jakob, Regina Engel (both at the Research Center Borstel), Phuong Quynh Nguyen, and Hedwig Rutschek (both at the Medical University of Vienna) is gratefully acknowledged.
Financial support came from the Austrian Science Fund FWF, projects P20605-B12 and P24317-B22 (to C.S.).
Footnotes
Published ahead of print 24 April 2013
REFERENCES
- 1. Tanner ACR, Izard J. 2006. Tannerella forsythia, a periodontal pathogen entering the genomic era. Periodontol. 2000 42:88–113 [DOI] [PubMed] [Google Scholar]
- 2. Holt SC, Ebersole JL. 2005. Porphyromonas gingivalis, Treponema denticola, and Tannerella forsythia: the “red complex,” a prototype polybacterial pathogenic consortium in periodontitis. Periodontol. 2000 38:72–122 [DOI] [PubMed] [Google Scholar]
- 3. Haffajee AD, Socransky SS. 1994. Microbial etiological agents of destructive periodontal diseases. Periodontol. 2000 5:78–111 [DOI] [PubMed] [Google Scholar]
- 4. Li X, Kolltveit KM, Tronstad L, Olsen I. 2000. Systemic diseases caused by oral infection. Clin. Microbiol. Rev. 13:547–558 [DOI] [PMC free article] [PubMed] [Google Scholar]
- 5. Leishman SJ, Do HL, Ford PJ. 2010. Cardiovascular disease and the role of oral bacteria. J. Oral Microbiol. 2:5781–5793 [DOI] [PMC free article] [PubMed] [Google Scholar]
- 6. Ebersole JL, Taubman MA. 1994. The protective nature of host responses in periodontal diseases. Periodontol. 2000 5:112–141 [DOI] [PubMed] [Google Scholar]
- 7. Madianos PN, Bobetsis YA, Kinane DF. 2005. Generation of inflammatory stimuli: how bacteria set up inflammatory responses in the gingiva. J. Clin. Periodontol. 32:57–71 [DOI] [PubMed] [Google Scholar]
- 8. Sharma A. 2010. Virulence mechanisms of Tannerella forsythia. Periodontol. 2000 54:106–116 [DOI] [PMC free article] [PubMed] [Google Scholar]
- 9. Sharma A, Sojar HT, Glurich I, Honma K, Kuramitsu HK, Genco RJ. 1998. Cloning, expression, and sequencing of a cell surface antigen containing a leucine-rich repeat motif from Bacteroides forsythus ATCC 43037. Infect. Immun. 66:5703–5710 [DOI] [PMC free article] [PubMed] [Google Scholar]
- 10. Murakami Y, Higuchi N, Nakamura H, Yoshimura F, Oppenheim FG. 2002. Bacteroides forsythus hemagglutinin is inhibited by N-acetylneuraminyllactose. Oral Microbiol. Immunol. 17:125–128 [DOI] [PubMed] [Google Scholar]
- 11. Hasebe A, Yoshimura A, Into T, Kataoka H, Hara Y, Shibata K-I. 2004. Biological activities of Bacteroides forsythus lipoproteins and their possible pathological roles in periodontal disease. Infect. Immun. 72:1318–1325 [DOI] [PMC free article] [PubMed] [Google Scholar]
- 12. Grenier D. 1995. Characterization of the trypsin-like activity of Bacteroides forsythus. Microbiology 141:921–926 [Google Scholar]
- 13. Saito T, Ishihara K, Kato T, Okuda K. 1997. Cloning, expression, and sequencing of a protease gene from Bacteroides forsythus ATCC 43037 in Escherichia coli. Infect. Immun. 65:4888–4891 [DOI] [PMC free article] [PubMed] [Google Scholar]
- 14. Hughes CV, Malki G, Loo CY, Tanner ACR, Ganeshkumar N. 2003. Cloning and expression of α-d-glucosidase and N-acetyl-β-glucosaminidase from the periodontal pathogen, Tannerella forsythensis (Bacteroides forsythus). Oral Microbiol. Immunol. 18:309–312 [DOI] [PubMed] [Google Scholar]
- 15. Thompson H, Homer KA, Rao S, Booth V, Hosie AHF. 2009. An orthologue of Bacteroides fragilis NanH is the principal sialidase in Tannerella forsythia. J. Bacteriol. 191:3623–3628 [DOI] [PMC free article] [PubMed] [Google Scholar]
- 16. Sabet M, Lee S-W, Nauman RK, Sims T, Um H-S. 2003. The surface (S-)layer is a virulence factor of Bacteroides forsythus. Microbiology 149:3617–3627 [DOI] [PubMed] [Google Scholar]
- 17. Sakakibara J, Nagano K, Murakami Y, Higuchi N, Shimozato K, Yoshimura F. 2007. Loss of adherence ability to human gingival epithelial cells in S-layer protein-deficient mutants of Tannerella forsythensis. Microbiology 153:866–876 [DOI] [PubMed] [Google Scholar]
- 18. Sekot G, Posch G, Messner P, Matejka M, Rausch-Fan X, Andrukhov O, Schäffer C. 2011. Potential of the Tannerella forsythia S-layer to delay the immune response. J. Dent. Res. 90:109–114 [DOI] [PMC free article] [PubMed] [Google Scholar]
- 19. Posch G, Pabst M, Brecker L, Altmann F, Messner P, Schäffer C. 2011. Characterization and scope of S-layer protein O-glycosylation in Tannerella forsythia. J. Biol. Chem. 286:38714–38724 [DOI] [PMC free article] [PubMed] [Google Scholar]
- 20. Settem RP, Honma K, Nakajima T, Phansopa C, Roy S, Stafford GP, Sharma A. 2013. A bacterial glycan core linked to surface (S)-layer proteins modulates host immunity through Th17 suppression. Mucosal Immunol. 6:415–426 [DOI] [PMC free article] [PubMed] [Google Scholar]
- 21. Erridge C, Bennett-Guerrero E, Poxton IR. 2002. Structure and function of lipopolysaccharides. Microbes Infect. 4:837–851 [DOI] [PubMed] [Google Scholar]
- 22. Bodet C, Grenier D. 2010. Synergistic effects of lipopolysaccharides from periodontopathic bacteria on pro-inflammatory cytokine production in an ex vivo whole blood model. Mol. Oral Microbiol. 25:102–111 [DOI] [PubMed] [Google Scholar]
- 23. Raetz CRH, Whitfield C. 2002. Lipopolysaccharide endotoxins. Annu. Rev. Biochem. 71:635–700 [DOI] [PMC free article] [PubMed] [Google Scholar]
- 24. Moran AP, Lindner B, Walsh EJ. 1997. Structural characterization of the lipid A component of Helicobacter pylori rough- and smooth-form lipopolysaccharides. J. Bacteriol. 179:6453–6463 [DOI] [PMC free article] [PubMed] [Google Scholar]
- 25. Janusch H, Brecker L, Lindner B, Alexander C, Gronow S, Heine H, Ulmer AJ, Rietschel ET, Zähringer U. 2002. Structural and biological characterization of highly purified hepta-acyl lipid A present in the lipopolysaccharide of the Salmonella enterica sv. Minnesota Re deep rough mutant strain R595. J. Endotoxin Res. 8:343–356 [DOI] [PubMed] [Google Scholar]
- 26. Galanos C, Lüderitz O, Westphal O. 1969. A new method for the extraction of R lipopolysaccharides. Eur. J. Biochem. 9:245–249 [DOI] [PubMed] [Google Scholar]
- 27. Laemmli UK. 1970. Cleavage of structural proteins during the assembly of the head of bacteriophage T4. Nature 227:680–685 [DOI] [PubMed] [Google Scholar]
- 28. Hitchcock PJ, Brown TM. 1983. Morphological heterogeneity among Salmonella lipopolysaccharide chemotypes in silver-stained polyacrylamide gels. J. Bacteriol. 154:269–277 [DOI] [PMC free article] [PubMed] [Google Scholar]
- 29. Sawardeker JS, Sloneker JH, Jeanes A. 1965. Quantitative determination of monosaccharides as their alditol acetates by gas liquid chromatography. Anal. Chem. 37:1602–1604 [Google Scholar]
- 30. Gerwig GJ, Kamerling JP, Vliegenthart JFG. 1979. Determination of the absolute configuration of monosaccharides in complex carbohydrates by capillary g.l.c. Carbohydr. Res. 77:1–7 [DOI] [PubMed] [Google Scholar]
- 31. Oertelt C, Lindner B, Skurnik M, Holst O. 2001. Isolation and structural characterization of an R-form lipopolysaccharide from Yersinia enterocolitica serotype O:8. Eur. J. Biochem. 268:554–564 [DOI] [PubMed] [Google Scholar]
- 32. Ciucanu I, Kerek F. 1984. A simple and rapid method for the permethylation of carbohydrates. Carbohydr. Res. 131:209–217 [Google Scholar]
- 33. Holst O. 2000. Deacylation of lipopolysaccharides and isolation of oligosaccharide phosphates, p 345–353 In Holst O. (ed), Bacterial toxins: methods and protocols, vol 145 Humana Press, New York, NY: [DOI] [PubMed] [Google Scholar]
- 34. Bertl K, An N, Bruckmann C, Dard M, Andrukhov O, Matejka M, Rausch-Fan X. 2009. Effects of enamel matrix derivative on proliferation/viability, migration, and expression of angiogenic factor and adhesion molecules in endothelial cells in vitro. J. Periodontol. 80:1622–1630 [DOI] [PubMed] [Google Scholar]
- 35. Kondakova A, Lindner B. 2005. Structural characterization of complex bacterial glycolipids by Fourier transform mass spectrometry. Eur. J. Mass Spectrom. 11:535–546 [DOI] [PubMed] [Google Scholar]
- 36. Holst O, Broer W, Thomas-Oates JE, Mamat U, Brade H. 1993. Structural analysis of two oligosaccharide bisphosphates isolated from the lipopolysaccharide of a recombinant strain of Escherichia coli F515 (Re chemotype) expressing the genus-specific epitope of Chlamydia lipopolysaccharide. Eur. J. Biochem. 214:703–710 [DOI] [PubMed] [Google Scholar]
- 37. Holst O, Bock K, Brade L, Brade H. 1995. The structures of oligosaccharide bisphosphates isolated from the lipopolysaccharide of a recombinant Escherichia coli strain expressing the gene gseA [3-deoxy-d-manno-octulopyranosonic acid (Kdo) transferase] of Chlamydia psittaci 6BC. Eur. J. Biochem. 229:194–200 [PubMed] [Google Scholar]
- 38. Velasco J, Moll H, Knirel YA, Sinnwell V, Moriyón I, Zähringer U. 1998. Structural studies on the lipopolysaccharide from a rough strain of Ochrobactrum anthropi containing a 2,3-diamino-2,3-dideoxy-d-glucose disaccharide lipid A backbone. Carbohydr. Res. 306:283–290 [DOI] [PubMed] [Google Scholar]
- 39. Zähringer U, Knirel YA, Lindner B, Helbig JH, Sonesson A, Marre R, Rietschel ET. 1995. The lipopolysaccharide of Legionella pneumophila serogroup 1 (strain Philadelphia 1): chemical structure and biological significance. Prog. Clin. Biol. Res. 392:113–139 [PubMed] [Google Scholar]
- 40. Forsberg LS, Carlson RW. 1998. The structures of the lipopolysaccharides from Rhizobium etli strains CE358 and CE359: the complete structure of the core region of R. etli lipopolysaccharides. J. Biol. Chem. 273:2747–2757 [DOI] [PubMed] [Google Scholar]
- 41. Vinogradov EV, Duus JØ, Brade H, Holst O. 2002. The structure of the carbohydrate backbone of the lipopolysaccharide from Acinetobacter baumannii strain ATCC 19606. Eur. J. Biochem. 269:422–430 [DOI] [PubMed] [Google Scholar]
- 42. Avci FY, Kasper DL. 2010. How bacterial carbohydrates influence the adaptive immune system. Annu. Rev. Immunol. 28:107–130 [DOI] [PubMed] [Google Scholar]
- 43. Müller-Loennies S, Holst O, Lindner B, Brade H. 1999. Isolation and structural analysis of phosphorylated oligosaccharides obtained from Escherichia coli J-5 lipopolysaccharide. Eur. J. Biochem. 260:235–249 [DOI] [PubMed] [Google Scholar]
- 44. Zähringer U, Lindner B, Rietschel ET. 1999. Chemical structure of lipid A: recent advances in structural analysis of biologically active molecules, p 93–114 In Brade H, Opal S, Vogel S, Morrison D. (ed), Endotoxin in health and disease. Marcel Dekker, New York, NY [Google Scholar]
- 45. Holst O, Molinaro A. 2009. Core region and lipid A components of lipopolysaccharides, p 29–55 In Moran AP, Holst O, Brennan PJ, von Itzstein M. (ed), Microbial glycobiology. Structures, relevance and applications. Elsevier, Amsterdam, The Netherlands [Google Scholar]
- 46. Martin M, Katz J, Vogel SN, Michalek SM. 2001. Differential induction of endotoxin tolerance by lipopolysaccharides derived from Porphyromonas gingivalis and Escherichia coli. J. Immunol. 167:5278–5285 [DOI] [PubMed] [Google Scholar]
- 47. Ogawa T, Uchida H, Amino K. 1994. Immunobiological activities of chemically defined lipid A from lipopolysaccharides of Porphyromonas gingivalis. Microbiology 140:1209–1216 [DOI] [PubMed] [Google Scholar]
- 48. Bodet C, Chandad F, Grenier D. 2006. Inflammatory responses of a macrophage/epithelial cell co-culture model to mono and mixed infections with Porphyromonas gingivalis, Treponema denticola, and Tannerella forsythia. Microbes Infect. 8:27–35 [DOI] [PubMed] [Google Scholar]
- 49. Ogawa T. 1993. Chemical structure of lipid A from Porphyromonas (Bacteroides) gingivalis lipopolysaccharide. FEBS Lett. 332:197–201 [DOI] [PubMed] [Google Scholar]
- 50. Darveau RP, Pham T-T, Lemley TK, Reife RA, Bainbridge BW, Coats SR, Howald WN, Way SS, Hajjar AM. 2004. Porphyromonas gingivalis lipopolysaccharide contains multiple lipid A species that functionally interact with both Toll-like receptors 2 and 4. Infect. Immun. 72:5041–5051 [DOI] [PMC free article] [PubMed] [Google Scholar]
- 51. Hoshino K, Takeuchi O, Kawai T, Sanjo H, Ogawa T, Takeda Y, Takeda K, Akira S. 1999. Cutting edge: Toll-like receptor 4 (TLR4)-deficient mice are hyporesponsive to lipopolysaccharide: evidence for TLR4 as the Lps gene product. J. Immunol. 162:3749–3752 [PubMed] [Google Scholar]
- 52. Raetz CRH, Ulevitch RJ, Wright SD, Sibley CH, Ding A, Nathan CF. 1991. Gram-negative endotoxin: an extraordinary lipid with profound effects on eukaryotic signal transduction. FASEB J. 5:2652–2660 [DOI] [PubMed] [Google Scholar]
- 53. Miyake K. 2004. Endotoxin recognition molecules, Toll-like receptor 4-MD-2. Semin. Immunol. 16:11–16 [DOI] [PubMed] [Google Scholar]
- 54. Wright SD, Ramos RA, Tobias PS, Ulevitch RJ, Mathison JC. 1990. CD14, a receptor for complexes of lipopolysaccharide (LPS) and LPS binding protein. Science 249:1431–1433 [DOI] [PubMed] [Google Scholar]
- 55. Shimazu R, Akashi S, Ogata H, Nagai Y, Fukudome K, Miyake K, Kimoto M. 1999. MD-2, a molecule that confers lipopolysaccharide responsiveness on Toll-like receptor 4. J. Exp. Med. 189:1777–1782 [DOI] [PMC free article] [PubMed] [Google Scholar]
- 56. Fitzgerald KA, Rowe DC, Golenbock DT. 2004. Endotoxin recognition and signal transduction by the TLR4/MD2-complex. Microbes Infect. 6:1361–1367 [DOI] [PubMed] [Google Scholar]
- 57. Kocgozlu L, Elkaim R, Tenenbaum H, Werner S. 2009. Variable cell responses to P. gingivalis lipopolysaccharide. J. Dent. Res. 88:741–745 [DOI] [PubMed] [Google Scholar]