

Abstract
Norovirus (NV) gastroenteritis is a major contributor to global morbidity and mortality, yet little is known about immune mechanisms leading to NV control. Previous studies using the murine norovirus (MNV) model have established a key role for T cells in MNV clearance. Despite these advances, important questions remain regarding the magnitude, location, and dynamics of the MNV-specific T cell response. To address these questions, we identified MNV-specific major histocompatibility complex (MHC) class I immunodominant epitopes using an overlapping peptide screen. One of these epitopes (amino acids 519 to 527 of open reading frame 2 [ORF2519-527]) was highly conserved among all NV genogroups. Using MHC class I peptide tetramers, we tracked MNV-specific CD8 T cells in lymphoid and mucosal sites during infection with two MNV strains with distinct biological behaviors, the acutely cleared strain CW3 and the persistent strain CR6. Here, we show that enteric MNV infection elicited robust T cell responses primarily in the intestinal mucosa and that MNV-specific CD8 T cells dynamically regulated the expression of surface molecules associated with activation, differentiation, and homing. Furthermore, compared to MNV-CW3 infection, chronic infection with MNV-CR6 resulted in fewer and less-functional CD8 T cells, and this difference was evident as early as day 8 postinfection. Finally, MNV-specific CD8 T cells were capable of reducing the viral load in persistently infected Rag1−/− mice, suggesting that these cells are a crucial component of NV immunity. Collectively, these data provide fundamental new insights into the adaptive immune response to two closely related NV strains with distinct biological behaviors and bring us closer to understanding the correlates of protective antiviral immunity in the intestine.
INTRODUCTION
Gastroenteritis is a major cause of morbidity and mortality globally, especially in developing countries (1). Annually, an estimated 1 billion cases of acute diarrhea occur in children under the age of 5, causing up to 2.5 million deaths (2). A significant proportion of these cases are caused by viral pathogens, particularly rotaviruses and noroviruses (NV). With the advent of a rotavirus vaccine, NV now account for the majority of nonbacterial gastrointestinal (GI) epidemics worldwide (3–5). In the United States alone, NV cause an estimated 23 million cases of acute gastroenteritis, leading to 50,000 hospitalizations and 300 deaths annually (6). In the United Kingdom, NV were the most common pathogen (36%) in stool specimens from patients with GI infections, while in India and Peru, these viruses were detected in 31% and 15%, respectively, of pediatric patients hospitalized with gastroenteritis (7–9). Norovirus outbreaks commonly occur under crowded conditions, such as in schools, hospitals, nursing homes, cruise ships, and restaurants (10, 11). The symptoms typically resolve within 48 to 72 h and are limited to abdominal pain, nausea, vomiting, and diarrhea, although life-threatening dehydration can be fatal among infants or malnourished or elderly patients. Despite the significant global burden of NV illness, currently there is no effective vaccine.
Noroviruses are 23-nanometer, nonenveloped, positive-strand RNA viruses whose 7- to 8-kbp genomes encode three or four open reading frames (ORFs). ORF1 encodes a nonstructural polyprotein that is processed posttranslationally by the viral protease; ORF2 encodes the capsid protein, the major structural component, which also mediates viral entry into target cells; ORF3 encodes a small basic protein that is associated with virions and is required for capsid assembly (12); and ORF4, which is highly conserved, was recently shown to play a role in murine norovirus pathogenesis (13). Despite the relatively brief duration of symptomatic NV illness, it is becoming increasingly clear that viral shedding can continue for weeks to months in immunocompetent individuals (14–18) and even for years in immunosuppressed patients (19–22). The immunologic and virologic basis for NV persistence, however, remains unknown.
Until recently, studies of immune responses to NV infection were hampered by the lack of cell culture systems or small-animal models. Field work and studies in human volunteers using live virus or nonreplicating virus-like particles (VLP) have documented IgG and IgA responses, although their role in the control of infection remains controversial. Early studies seemed to support the existence of short-term but not long-term immunity to NV infection (23) and even suggested a positive correlation between robust humoral responses and the development of clinical symptoms (24–27). In contrast, field studies in developing countries have shown protection from disease in children with high anti-NV titers (28, 29), and more-recent data in humans and chimpanzees infected with NV have demonstrated antibody-mediated neutralization and protection after rechallenge with the same strain (30, 31).
Three lines of evidence may help explain the conflicting results regarding the role of humoral immunity in NV clearance. First, noroviruses bind to histo-blood group antigens (HBGAs) expressed on host cell surfaces, with different NV strains exhibiting different HBGA binding affinities. Thus, HBGAs constitute genetically determined host susceptibility factors (32–37). This finding likely accounts for the observation that certain volunteers, previously assumed to clear infection rapidly, remain asymptomatic despite an absence of antibody responses. Second, similar to other RNA viruses, NV are highly diverse and evolve rapidly, and genetic shifts have been associated with severe outbreaks (10). In line with these observations, repeat NV infections are common throughout adult life despite seroprevalence against NV approaching 100% by age 9 or 10 (38–40) and, to date, no study has demonstrated cross-protective humoral immunity against challenge with heterologous norovirus strains. Third, it is clear that, in addition to humoral immunity, both CD4 and CD8 T cell responses are involved in NV control, although the relative contributions of B and T cells to the adaptive immune response remain unclear (41–43). For example, in a recent vaccine trial using inactive VLPs, the antibody responses were highly variable and, even when robust, did not consistently provide protection against rechallenge with the same strain, suggesting that humoral responses may not be sufficient to confer immunity to repeat NV infection (44). Furthermore, chronic symptomatic NV infections in immunocompromised patients with decreased lymphocyte counts and normal immunoglobulin levels have been reported, consistent with a critical role for T cells in NV control (18, 20, 45).
A major development in the field of norovirus research has been the discovery of murine noroviruses (MNV), a new genogroup of natural enteric mouse pathogens capable of growth in tissue culture (46). This new model for NV infection has allowed the use of animal studies to dissect viral pathogenesis and immunity. To date, the MNV system has established a key role for innate immunity in MNV control by showing that infection is lethal in mice deficient in type I and II interferon (IFN) signaling or STAT1, while Mda5−/− mice have higher viral loads but survive (47, 48). In addition, mouse studies have shown that adaptive immune responses are also critical for MNV control. Thus, Rag1−/− mice fail to clear MNV-CW3, while immunocompetent mice clear this same strain within 7 days. In addition, selective depletion of CD4 T cells, CD8 T cells, or B cells from wild-type mice impairs MNV clearance and leads to higher viral titers in the intestine and mesenteric lymph nodes (MLN) (49, 50). Furthermore, adoptive transfer of splenocytes from MNV immune wild-type mice was sufficient to clear the same strain from chronically infected Rag1−/− recipients (49). Collectively, these studies establish that B and T cells are important for MNV clearance, although the relative contributions of virus-specific memory and effector subsets of the adaptive immune response remain incompletely understood.
An added advantage to the MNV system is the availability of multiple MNV strains with distinct biological behaviors. Specifically, with regard to persistence, both acute (MNV-CW3) and chronic (MNV-CR6) strains have been described (51, 52). While MNV-CW3 is cleared within 7 to 10 days from the intestine of immunocompetent mice, the CR6 strain persists for at least several weeks (51). We took advantage of this natural diversity of MNV strains to test the hypothesis that acute and chronic MNV infections are associated with quantitative and/or qualitative differences in the virus-specific CD8 T cell response. To this end, we identified an immunodominant and highly conserved major histocompatibility complex (MHC) class I-restricted epitope in the viral capsid (referred to hereafter as P1519 [a 9-residue sequence beginning at position 519 of the P1 subunit of capsid]) and used MHC class I peptide tetramers to define and track P1519-specific CD8 T cells during CW3 and CR6 infection. We show here that oral infection with MNV resulted in robust T cell responses in the intestine and that MNV-specific CD8 T cells dynamically regulated the expression of a number of surface markers associated with activation, differentiation, and homing. Furthermore, both the magnitude and functionality of the CD8 T cell response elicited by MNV-CR6 were reduced compared to the response to MNV-CW3. Finally, we show that MNV-specific CD8 T cells were capable of decreasing the tissue burdens of MNV in chronically infected Rag1−/− mice. These studies will provide new avenues for understanding acute and persistent mucosal infections and could guide the future development of effective NV vaccines.
MATERIALS AND METHODS
Viral stocks and plaque assay.
Plasmids containing virion strains MNV-1.CW3 (GenBank accession number EF014462) and MNV-1.CR6 (GenBank accession number EU004676) were used to generate viral stocks as previously described (52). Briefly, all cell lines were maintained at 37°C and 5% CO2 in RPMI 1640 (Corning-Cellgro, Corning, NY) containing 10% fetal bovine serum, 2 mM l-glutamine, 100 IU/ml penicillin, and 100 μg/ml streptomycin (RPMI-CTCM). Concentrated viral stocks were produced by transfecting 293T cells (ATCC, Manassas, VA) using FuGENE-HD reagent (Promega, Madison, WI) according to the manufacturer's protocol (with a FuGENE/DNA ratio of 5:2). After 48 h, transfected 293T cells were lysed by freezing and thawing, cellular debris was removed by centrifugation (10 min at 3,000 × g and 4°C), and the supernatant was transferred onto RAW 264.7 cells (ATCC, Manassas, VA) that had been plated at 2 × 10⁶ cells/well in 6-well plates 24 h earlier. After 48 h, RAW 264.7 cells were freeze-thawed and the supernatant was purified from the cellular debris as described above.
Mice and infections.
Wild-type C57BL/6 and Rag1−/− female mice, age 6 to 8 weeks, were obtained from Jackson Laboratory, Bar Harbor, ME. Mice from Jackson Laboratory are MNV free, and this was independently confirmed by plaque assay, serology, and quantitative PCR (qPCR). Mice were maintained in our facility in designated cages, and their bedding, food, and water were changed separately from other cages in order to maintain naive controls MNV free. Intravenous (i.v.) and oral (p.o.) infections were carried out by tail vein injection and oral gavage, respectively, using a maximum volume of 300 μl per mouse containing a specified viral infectious dose. All mice were used in accordance with Institutional Animal Care and Use Committee guidelines for the University of Pennsylvania.
Tissue processing and lymphocyte isolation for flow cytometry.
Spleens, mesenteric lymph nodes, and Peyer's patches were harvested in 2 ml of cold (4°C) sterile cell culture medium and homogenized through 70-μm cell strainers. In the case of spleens, red blood cells were lysed with ammonium-chloride-potassium (ACK) lysing buffer (Life Technologies, Grand Island, NY) for 2 min and washed in cell culture medium. Small intestines were dissected free of fat and Peyer's patches, cut open longitudinally, washed clean of fecal material in phosphate-buffered saline (PBS), and placed in 10 ml of cold cell culture medium. To remove epithelial cells, intestines were incubated in stripping buffer (PBS containing 5 mM EDTA, 1 mM dithiothreitol, 5% fetal bovine serum, 100 IU/ml penicillin, and 100 μg/ml streptomycin) and shaken at 160 rpm for 10 min at 37°C. After the supernatant was discarded, intestines were incubated again in stripping buffer and shaken at 160 rpm for 20 min at 37°C. The supernatant, containing intestinal epithelial cells (IEL), was passed through a 70-μm cell strainer, washed in cell culture medium, resuspended in cell culture medium containing 40% Percol, and subjected to centrifugation at 600 × g at room temperature for 20 min (without break). Following centrifugation, the supernatant was carefully removed and the cell pellets were washed in cell culture medium. After IEL stripping, lamina propria lymphocytes (LPL) were isolated by incubating intestines in cell culture medium containing 0.5 mg/ml collagenase-dispase (Roche Diagnostics, Indianapolis, IN) and 20 μg/ml DNase I (Sigma-Aldrich, St. Louis, MO) for 20 min at 37°C with shaking at 160 rpm. LPL were passed through a 70-μm cell strainer, washed, and centrifuged in 40% Percol as described above.
In vitro stimulation and flow cytometry.
Equal numbers of cells (106) were plated in duplicate in separate flat-bottom 96-well plates in RPMI-CTCM. One plate was used for surface staining with tetramer and the antibodies indicated below; the second plate was used for stimulation assays followed by intracellular staining (ICS). For ICS, GolgiStop and GolgiPlug (BD Biosciences, San Diego, CA) and 0.4 μg/ml of peptide or phorbol myristate acetate (PMA)-ionomycin (5 ng/ml and 500 ng/ml, respectively) were added and plates were incubated at 37°C and 5% CO2 for 5 h. Cells were fixed and permeabilized using the Cytofix/Cytoperm kit (BD Biosciences, San Diego, CA) according to the manufacturer's protocol. MHC class I peptide tetramers were prepared as previously described (53). The following antibodies were used for ICS and surface stains. From eBioscience, San Diego, CA, CD4-eFluor 605 antibody (clone GK1.5), CD44-eFluor 780 antibody (clone IM7), and CD49d-fluorescein isothiocyanate (FITC) antibody (clone R1-2). From Biolegend, San Diego, CA, Ly6c-Alexa Fluor 700 antibody (clone RB6-8C5), CD11a-phycoerythrin (PE) antibody (clone 101008), CD103-Pacific blue antibody (clone 2E7), PD-1–PE–Cy7 antibody (clone RMP1-30), and tumor necrosis factor alpha (TNF-α)-Pacific blue antibody (clone MP6-XT22). From Abcam, Cambridge, MA, CD8-PE-Texas red antibody (clone 53-6.7). From BD Pharmingen, San Diego, CA, gamma interferon (IFN-γ)-Alexa Fluor 700 antibody (clone XMG1.2). From R&D Systems, Minneapolis, MN, MIP-1α–allophycocyanin (APC) antibody (clone 39624). From Invitrogen, Carlsbad, CA, granzyme B (GZM-B)–PE antibody (clone GB11). Cells were analyzed on an LSR II flow cytometer (BD Immunocytometry Systems, San Jose, CA). Data analysis was performed using FlowJo (version 7.6.4) software (TreeStar, San Carlos, CA). Dead cells were removed by gating on a LIVE/DEAD aqua kit (Invitrogen, Carlsbad, CA) versus forward scatter (FSC-H).
Peptide library screen.
A library consisting of 292 18-amino-acid-long peptides, overlapping by 9 amino acids and spanning the MNV-CR6 proteome, was synthesized by GenScript (Piscataway, NJ). All peptides were initially resuspended in dimethyl sulfoxide (DMSO) at a concentration of 40 mg/ml. The library was screened 64 peptides at a time. For a given screen, the 64 peptides were distributed into 12 pools with 16 peptides per pool according to the matrix shown in Figure 2B (so that each of the 64 peptides was represented in 3 different overlapping pools). Peptide pools were used for in vitro stimulation of splenocytes, followed by ICS and flow cytometry as described above.
Fig 2.

Identification of MNV-elicited immunodominant CD8 T cell epitopes. (A) Mice were infected i.v. (IV) with 104 PFU of MNV-CR6 or mock infected with culture medium. At day 8 p.i., lymphocytes from the spleen were isolated and stimulated in vitro with PMA-ionomycin in the presence of GolgiStop and GolgiPlug. IFN-γ production was assessed by flow cytometry after gating on live CD8 lymphocytes. (B) A peptide library consisting of 292 18-amino-acid-long peptides, overlapping by 9 amino acids and spanning ORF1 to -4 of MNV-CR6, was used to screen for MHC class I-restricted epitopes. Sixty-four peptides were screened per experiment. Peptides were grouped into 12 overlapping pools, each containing 16 peptides as shown. This resulted in a 3-D matrix where each peptide was represented in 3 separate pools. In the example shown, peptide 41 represents the intersection of pools 3, 5, and 11. (C) Mice were infected i.v. with 104 PFU of MNV-CR6 or mock infected with culture medium. Splenocytes were isolated at day 8 to 14 postinfection and stimulated in vitro with peptide pools 1 to 12 in the presence of GolgiStop and GolgiPlug. Cytokine production by CD4 and CD8 T cells was analyzed by flow cytometry. In the representative experiment whose results are shown (gated on live CD8 lymphocytes), responses above the baseline were elicited by pools 3, 5, and 11, corresponding to peptide 41 as shown in panel B. (D) Eleven candidate peptides were identified in the screen and were tested individually. The starting amino acid (AA) position and ORF for each 18-amino-acid peptide are shown. Data are representative of 3 to 5 mice and at least 2 independent experiments. Horizontal lines show the means. *, significant difference from unstimulated control by unpaired t test at P < 0.05.
Viral quantification.
Viral titers were determined by plaque assay as follows. RAW 264.7 cells were plated at a density of 2 × 10⁶ cells per well in 6-well plates. Twenty-four hours later, the medium was removed and replaced with 0.5 ml per well of serially diluted virus-containing supernatant. The plates were placed on a rocker at room temperature for 1 h. The virus-containing medium was then removed and replaced with 2 ml/well of overlay medium (RPMI 1640 containing 10 mg/ml methylcellulose, 5% fetal bovine serum, 2 mM l-glutamine, 100 IU/ml penicillin, and 100 μg/ml streptomycin), and the plates were incubated for 48 to 72 h. Plaques were visualized and counted after removing the overlay medium, washing the cells with PBS, fixing with 20% ethanol containing 0.1% crystal violet for 1 h at room temperature on a rocker, and washing with water.
For qPCR assays, fecal pellets or tissue samples were weighed, frozen, and stored at −80°C. Tissues were homogenized using steel beads and a TissueLyser II (Qiagen, Valencia, CA). RNA was extracted using the RNeasy kit (Qiagen, Valencia, CA) according to the manufacturer's instructions. cDNA was prepared from RNA samples using a high-capacity cDNA reverse transcription kit (Applied Biosystems, Carlsbad, CA) according to the manufacturer's instructions, with the following amplification settings: 10 min at 25°C, 120 min at 37°C, and 5 min at 85°C for one cycle. For TaqMan qPCR, the forward and reverse primers used were CACGCCACCGATCTGTTGTG and GCGCTGCGCCATCACTC, respectively. The MNV probe was CGCTTTGGAACAATG. qPCRs were carried out using TaqMan universal PCR master mix (Applied Biosystems, Carlsbad, CA) in 10-μl reaction mixture volumes according to the manufacturer's instructions, with the following amplification settings: 15 s at 95°C and 1 min at 60°C for 40 cycles. All samples were assessed in triplicate, and the results were standardized to total RNA per sample.
Lymphocyte adoptive transfer.
CD8 T cells from the spleen were purified by negative selection using magnetically activated cell sorting beads (Invitrogen, Carlsbad, CA) according to the manufacturer's instructions. Tetramer sorts were performed on an Aria II instrument (BD Immunocytometry Systems, San Jose, CA) by gating on live, CD8+, CD44HI, tetramer+ cells, and a purity check confirmed successful sorting (>95% purity). Cells were maintained strictly at 4°C for the entire sorting procedure. Sorted cells were transferred intravenously into recipient mice.
Phylogenetic analysis.
Ninety NV sequences representing all known genogroups were obtained from GenBank. The evolutionary history was inferred using the neighbor-joining method (54). The evolutionary distances were computed using the Kimura 2-parameter method (55). All positions containing gaps and missing data were eliminated. There were a total of 228 positions in the final data set. Evolutionary analyses were conducted in MEGA5 (56).
MHC class I peptide binding prediction.
The Immune Epitope Database (IEDB) Analysis Resource (http://tools.immuneepitope.org/main/) (57) was used to predict the binding affinities of peptides for mouse and human MHC class I molecules. This method uses a number of known prediction algorithms to estimate 50% inhibitory concentrations (IC50s) in nM, with IC50 of <50 nM considered high affinity. When multiple prediction methods are used, the results are collapsed into a single percentile ranking. Logos representing consensus epitope motifs were generated using WebLogo (http://weblogo.berkeley.edu/logo.cgi) (58).
RESULTS
Oral MNV infection induces T cell responses at mucosal sites.
Previous work has shown that CD4 and CD8 T cells are required for MNV clearance (49); however, the magnitude and timing of the cellular immune response to the virus is unknown. To begin to address this issue, we used p.o. inoculation to infect mice with MNV-CR6, a strain that establishes persistent infection in wild-type mice (52). On day 8 postinfection, lamina propria lymphocytes (LPL) of the small intestine were stimulated with PMA-ionomycin in vitro and cytokine production was assessed by flow cytometry. As shown by the results in Figure 1A, compared to naive controls, MNV infection induced populations of IFN-γ-producing CD4 and CD8 T cells in the LP. We also examined T cell responses in other gut-associated lymphoid tissues, including mesenteric lymph nodes (MLN) and Peyer's patches (PP), as well as systemic responses in the spleen. In contrast to the LP, T cell activation in all nonmucosal sites was significantly weaker (Fig. 1B and C; also data not shown). Thus, at day 8 following oral infection with MNV-CR6, IFN-γ-positive CD4 and CD8 T cells were detected mainly in the intestinal mucosa.
Fig 1.
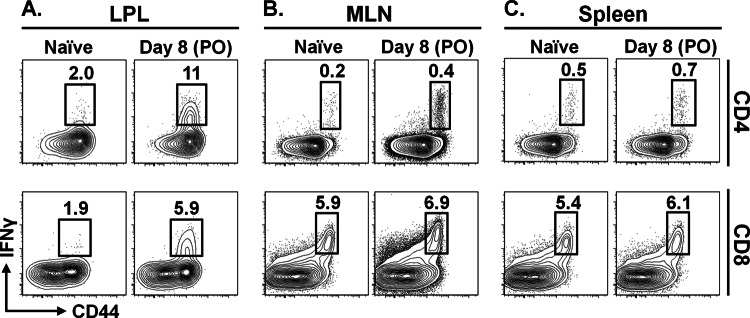
Oral MNV infection induces T cell responses at mucosal sites. Mice were infected p.o. with 104 PFU of MNV-CR6 or mock infected with culture medium. At day 8 p.i., lymphocytes from the intestinal lamina propria (LPL) (A), mesenteric lymph nodes (MLN) (B), and spleen (C) were isolated and stimulated in vitro with PMA-ionomycin in the presence of GolgiStop. IFN-γ production was assessed by flow cytometry after gating on live CD4 and CD8 lymphocytes. Data are representative of 3 to 5 mice, and each experiment was repeated at least twice.
Identification of an immunodominant MNV-specific CD8 T cell epitope.
The above-described results are consistent with an important role for mucosal T cell responses in natural MNV infection. To better define this adaptive immune response, we conducted a screen to identify virus-specific CD8 T cells. We used a peptide library consisting of 292 18-amino-acid-long peptides, overlapping by 9 amino acids and spanning ORF1 to -4 of MNV-CR6. These peptides were used to screen for MHC class I-restricted epitopes, based on their ability to elicit cytokine production (IFN-γ and TNF-α) by antigen-specific CD8 T cells.
The data shown in Figure 1 indicate that mucosal infection with MNV results in T cell activation primarily in the intestine. However, for the purposes of a large-scale peptide screen, isolating large numbers of viable LPL was technically infeasible. It has previously been reported that, although it is a natural enteric pathogen, MNV is capable of initiating infection by intracerebral, intranasal, and intraperitoneal routes (47). We hypothesized that MNV-CR6 might also be capable of establishing infection via i.v. inoculation and that this might lead to a systemic immune response, allowing us to isolate and assay large numbers of T cells from the spleen. To test this possibility, we infected mice i.v. with MNV-CR6 and used flow cytometry to detect IFN-γ production by T lymphocytes from the spleen (SPL) after in vitro stimulation with PMA-ionomycin. As shown by the results in Figure 2A, CD8 T cell activation could be detected in the spleens of infected mice on day 8 following i.v. infection. Although the magnitude of the splenic lymphocyte response was small, it was consistent and reproducible over multiple experiments (data not shown). Thus, i.v. infection with the mucosal pathogen MNV-CR6 results in activated T lymphocytes in the spleen, allowing the use of splenocytes for epitope identification.
To identify MHC class I epitopes, we divided our peptide library into a 3-dimensional (3-D) matrix of 12 overlapping peptide pools (Fig. 2B; also see Materials and Methods). Following i.v. infection with MNV-CR6, splenocytes were isolated and stimulated with peptide pools, and the production of cytokines was assessed by flow cytometry. An example of a 12-pool screen is shown in Figure 2C. The peptide candidates identified were further analyzed using the IEDB and were assigned a percentile rank based on their predicted IC50 binding of Kb or Db molecules (57). Of the 28 peptides initially identified, 11 received a percentile score of <1 and were further tested. As shown by the results in Figure 2D, one of the 11 candidate peptides that were individually tested, ORF2514-531 (amino acids 514 to 531 of ORF2), resulted in robust CD8 T cell responses as measured by IFN-γ and TNF-α production. Several other subdominant MHC class I epitopes were also identified (Fig. 2D).
Characterization of the minimal immunodominant epitope in peptide ORF2514-531.
The 18-amino-acid-long peptide (ORF2514-531) identified in our screen (Fig. 2D) was derived from the C terminus of the P1 subunit of capsid. Based on IEDB analysis, a 9-residue sequence beginning at position 519 within this peptide was predicted to be an immunodominant H-2Kb epitope (referred to herein as epitope P1519) (Fig. 3A). An examination of multiple known MNV strains showed that P1519 is highly conserved, with variation only at position 7 (corresponding to position 525 in ORF2) between tyrosine (Y) or phenylalanine (F) (Fig. 4 and Table 1). We compared the two versions of epitope P1519 to the consensus motif for H-2Kb (Fig. 3B). An aliphatic residue (Leu) in the C-terminal position 9 and an aromatic residue (Phe or Tyr) at position 7 likely act as the anchors, although H-2Kb anchor residues are classically separated by two amino acids (Fig. 3B) (59, 60). Given the noncanonical arrangement of P1519, we wanted to confirm that this 9-amino-acid peptide was capable of stimulating CD8 T cell responses and determine whether the differential usage of an aromatic residue at position 7 (F versus Y) affected T cell activation. Therefore, two strains of MNV were used that differ at position ORF2525, strain MNV-CR6 (ORF2525F) and strain MNV-CW3 (ORF2525Y). Eight days following i.v. infection with MNV-CR6 or MNV-CW3, splenocytes were isolated and stimulated in vitro with the original 18-amino-acid-long peptide or either of two 9-amino-acid derivatives (P1519F or P1519Y) (Fig. 3C). Stimulation with any of the three peptides induced cytokine production, although more-robust responses were noted when the epitope sequence matched the infecting strain of virus. Furthermore, in the case of CR6 infection, stimulation with the 18-mer resulted in a level of stimulation comparable to that of the predicted 9-amino-acid epitope, consistent with P1519 being the minimal MHC I binding sequence within ORF1514-531. Based on these data, two separate MHC class I tetramers (Kb-P1519F and Kb-P1519Y) were synthesized using 9-mers derived from MNV-CR6 and MNV-CW3.
Fig 3.

Characterization of the minimal immunodominant epitope in peptide ORF2514-531. (A) Within the 18-amino-acid peptide identified in the epitope screen, a 9-residue sequence, P1519, is predicted to constitute an MHC class I epitope. P1519 differs by a single residue among MNV strains. The binding affinities of P1519F and P1519Y for H-2Kb and H-2Db were calculated using the Immune Epitope Database (IEDB) analysis resource tool (http://tools.immuneepitope.org/analyze/html/mhc_binding.html). *, IEDB Percentile Rank: in this analysis, a number of available MHC class I binding prediction methods are used to calculate the binding affinity of a peptide to a given MHC molecule. The output is given in units of IC50 nM, where lower numbers indicate higher binding affinity. When multiple prediction methods are used for a given peptide-MHC pair, the results are collapsed into a single consensus percentile ranking. (B) Comparison of the P1519F and P1519Y sequences to the consensus binding motif for H-2Kb (59). Highlighted positions indicate anchor residues. (C) Mice were infected i.v. with 1.5 × 10⁶ PFU of MNV-CR6 (containing epitope P1519F) or MNV-CW3 (containing P1519Y). Splenocytes from naive and infected animals were harvested 8 days p.i. and stimulated with each indicated peptide in the presence of GolgiStop and GolgiPlug. Cytokine expression was analyzed by flow cytometry. Gated on live CD8 lymphocytes. Data are representative of 5 mice and at least 2 independent experiments.
Fig 4.

Epitope P1519 is highly conserved among all Norovirus genogroups. We constructed a phylogenetic tree containing members of all genogroups and genotypes (GenBank accession numbers are indicated). The evolutionary history was inferred using the neighbor-joining method (54). The optimal tree with the sum of branch length of 5.06925373 is shown. The tree is drawn to scale, with branch lengths in the same units as those of the evolutionary distances used to infer the phylogenetic tree. The evolutionary distances were computed using the Kimura 2-parameter method (55) and are in units of the number of base substitutions per site. The analysis involved 90 nucleotide sequences. All positions containing gaps and missing data were eliminated. There were a total of 228 positions in the final data set. Evolutionary analyses were conducted in MEGA5 (56). A sequence homologous to the P1519 epitope identified in this study was present in the C terminus of capsids from all sequences analyzed (see Table 1 for the precise epitope motif of each clone shown here). The 9-amino-acid consensus sequences for genogroups I, II, and V are shown. In the logos, the height of each column of letters is equal to the information content (in bits) at the given position in the epitope. The relative height of each letter within each column is proportional to the frequency of the corresponding amino acid at that position (generated using WebLogo, http://weblogo.berkeley.edu/logo.cgi) (58).
Table 1.
Epitope P1519 is highly conserved among all NV genogroupsa
| Genogroup | Host | GenBank accession no. | Epitope sequence |
|---|---|---|---|
| GI/1 | Human | AB031013 | SWVSRFYQL |
| L23828 | SWVSRFYQL | ||
| GI/2 | Human | L07418 | SWVSRFYQL |
| GI/3 | Human | U04469 | SWVSRFYQL |
| AF145709 | SWVSRFYQL | ||
| AJ277612 | SWVSRFYQL | ||
| GI/4 | Human | AJ277616 | SWVSRFYQL |
| GI/5 | AB022679 | SWVSRFYQL | |
| Human | AF414406 | SWVSRFYQL | |
| AJ277614 | SWVSRFYQL | ||
| GI/6 | Human | AF093797 | SWVSRFYQL |
| GI/7 | Human | AB021995 | Incomplete |
| AB021994 | Incomplete | ||
| AB021990 | Incomplete | ||
| AJ277609 | SWVSRYYQL | ||
| GI/8 | Human | AB081723 | SWVSRFYQL |
| AJ277615 | SWVSRFYQL | ||
| GI/9 | Human | M87661 | SWVSRFYQL |
| GI/10 | Human | AF538679 | SWVSRYYQL |
| GI/11 | Human | AB058547 | Incomplete |
| GI/12 | Human | AB058525 | Incomplete |
| GI/13 | Human | AB112132 | Incomplete |
| GI/14 | Human | AB112100 | Incomplete |
| GV | Murine | AY228235 | SWVPRLYQL |
| GV | Murine | EU004663 | SWVPRLFQL |
| GV | Murine | EU004664 | SWVPRLFQL |
| GV | Murine | EU004665 | SWVPRLFQL |
| GV | Murine | EU004666 | SWVPRLFQL |
| GV | Murine | EU004667 | SWVPRLFQL |
| GV | Murine | EU004668 | SWVPRLFQL |
| GV | Murine | EU004669 | SWVPRLFQL |
| GV | Murine | EU004670 | SWVPRLFQL |
| GV | Murine | EU004671 | SWVPRLFQL |
| GV | Murine | EU004672 | SWVPRLYQL |
| GV | Murine | EU004673 | SWVPRLFQL |
| GV | Murine | EU004674 | SWVPRLYQL |
| GV | Murine | EU004675 | SWVPRLYQL |
| GV | Murine | EU004676 | SWVPRLFQL |
| GV | Murine | EU004677 | SWVPRLYQL |
| GV | Murine | EU004678 | SWVPRLFQL |
| GV | Murine | EU004679 | SWVPRLFQL |
| GV | Murine | EU004680 | SWVPRLFQL |
| GV | Murine | EU004681 | SWVPRLYQL |
| GV | Murine | EU004682 | SWVPRLYQL |
| GV | Murine | DQ223041 | SWVPRLFQL |
| GV | Murine | DQ223042 | SWVPRLFQL |
| GV | Murine | DQ223043 | SWVPRLFQL |
| GV | Murine | DQ911368 | SWVPRLYQL |
| GII/1 | Human | AJ277606 | SWVNQFYSL |
| GII/2 | Human | X81879 | SWVNQFYSL |
| U70059 | SWVNQFYSL | ||
| GII/3 | Human | AB067542 | SWVNPFYTL |
| U46039 | SWVNPFYTL | ||
| U02030 | SWVNPFYTL | ||
| U22498 | SWVNPFYTL | ||
| AF190817 | SWVNPFYTL | ||
| GII/4 | Human | X76716 | SWVNQFYTL |
| X86557 | SWVNQFYTL | ||
| AF145896 | SWVNQFYTL | ||
| AJ004864 | SWVNQ_YTL | ||
| AF414425 | SWVNQFYTL | ||
| GII/5 | Human | AF414423 | SWVNQFYSL |
| AJ277607 | SWVNQFYSL | ||
| GII/6 | Human | AF414410 | AWVNQFYTL |
| AF414407 | AWVNQFYTL | ||
| AJ277620 | AWVNQFYTL | ||
| AB039776 | AWVNQFYTL | ||
| GII/7 | Human | AJ277608 | AWVNQFYTL |
| GII/8 | Human | AF195848 | SWVKQFYSL |
| AB067543 | AWVNQFYSL | ||
| GII/9 | Human | AY054299 | AWVNQFYSL |
| GII/10 | Human | AF427118 | SWVNQFYTL |
| GII/11 | Human | AB112221 | Incomplete |
| GII/12 | Human | AJ277618 | SWVNQFYSL |
| AB032758 | TWVNQFYSL | ||
| AB039775 | SWVNQFYSL | ||
| GII/13 | Human | AY130761 | AWVNPFYTL |
| GII/14 | Human | AB078334 | SWVNQFYSL |
| AY113106 | SWVNQFYSL | ||
| GII/15 | Human | AB058582 | Incomplete |
| GII/16 | Human | AB112260 | Incomplete |
| GII/17 | Human | AF414426 | SWVSSFYIL |
| AF414427 | SWVSSFYIL | ||
| AF195847 | SWVSSFYIL | ||
| GIII | Bovine | AF32025 | SWVSFYYQL |
| GIII | Bovine | AJ011099 | SWVSLYYQL |
| GIV | Lion | EF450827 | SWVSAFYVL |
| GIV | Human | FM865412 | SWVSSFYIL |
| GIV | Dog | EU224456 | SWVNAFYVL |
The sequence homologous to epitope P1519 for NV strains from Figure 4 is shown.
Epitope P1519 is highly conserved among all norovirus genogroups.
We next examined whether a sequence homologous to epitope P1519 might be present in noroviruses that infect other species, including humans. Based on capsid sequence analysis, noroviruses have been divided into 5 genogroups, with human strains occupying groups I and II and murine viruses in group V (61, 62). Genogroups I and II, in turn, are subdivided into 14 and 17 subtypes, respectively. We picked NV strains representing all genogroups and subtypes and constructed a phylogenetic tree to examine diversity in ORF2, which contains P1519 (Fig. 4). Consistent with previous phylogenetic studies, our analysis demonstrated that noroviruses are a highly heterogeneous family (61). Strikingly, an alignment of the P1 sequence of all species from our phylogenetic analysis revealed the presence of a sequence homologous to epitope P1519 in all five genogroups, including human noroviruses (Fig. 4 and Table 1). Within GI and GII, four of the nine residues, including the putative anchor residues, were completely conserved among all human norovirus strains examined (positions 2, 3, 7, and 9), and an even higher degree of conservation was observed within individual human genogroups (Table 1).
We used the IEDB Analysis Resource to predict the affinities of common human HLAs for the P1519 epitopes from genogroups I and II. Table 2 summarizes the results of this query for HLAs that received a percentile rank score of <1.5, as well as showing the consensus binding motifs for each of these molecules. Most HLAs shown in Table 2 have a Leu (or other aliphatic amino acid) in the C-terminal anchor position. A Tyr at position 2 often serves as the second anchor point; however, in epitope P1519, this position is occupied by Trp, another aromatic residue. Collectively, these computational and phylogenetic analyses suggest that the P1519 epitope is conserved across multiple NV genogroups. Combined with the immunogenicity of this epitope in the murine model, these findings provide a potential target for future vaccination strategies aimed at eliciting a strong cellular immune response.
Table 2.
Common human HLAs predicted to bind epitope P1519a
| NV epitope or human class I HLA | Consensus sequence |
IEDD rank |
|||||||||
|---|---|---|---|---|---|---|---|---|---|---|---|
| 1 | 2 | 3 | 4 | 5 | 6 | 7 | 8 | 9 | GI | GII | |
| Norovirus GI | S | W | V | S | R | F | Y | Q | L | NA | NA |
| Norovirus GII | S | W | V | N | Q | F | Y | S,T | L | NA | NA |
| HLA-A*23:01 | Y | W, I | 0.45 | 0.7 | |||||||
| HLA-A*24:02 | Y | N, E, L, M, P,G | D, P | I, V | F | Q, N | E,K | I, L, F | 0.55 | 1.10 | |
| HLA-B*08:01 | G, L, I | K, R | E, Q, D, H, L, S, T, R, G, K | K, R | N, Q, H, I, L, Y, V, E, M, S, T, F | E, H, M, N, D, Q, S, T, Y | E, Q, H, S,L, V, D, T | L, F, M | 0.50 | 2.30 | |
| HLA-B*37:01 | K, Q | D, E, H, P, G, S, L | V, I, T, R, A, D, G, H, M | Q, K, Y, L | F, M, L, T, E, N, D, Q, G, H | I, L | 1.4 | 3.0 | |||
| HLA-C*04:01 | Y, P, F | D, H | D, E, P | A, H, M, T, R | V, I, L | A | K, S, H | L, F, M | 0.1 | 0.3 | |
| HLA-C*06:02 | I, F, K, Y | P, R | P, I, G, F, Y, K, N, A | P, E, D, Q, L | I, L, F, M, K | V, I, L, A, T, S | R, K, Q, N | Y, E, Q, N, R, G, T, S, K | L, I, V, Y | 0.4 | 0.9 |
| HLA-C*07:02 | Y, P, R, D | P, G, A | D, E, V, Q, P, S, G | V, Y, I, L, F, M, T | V, I, L, M A, R | Y, M, N, R, V, F, E | H, A, F, D, K | Y, F, L | 0.2 | 0.7 | |
The consensus sequence for each epitope and HLA binding preference are shown. Underlined residues denote preferred anchors at the given position (63). The Immune Epitope Database (IEDB) Analysis Resource was used to predict the binding affinity of human class I HLAs for epitope P1519 from NV genogroups I and II. The table lists HLAs that returned a percentile rank of <1.5. NA, not applicable.
Robust epitope P1519-specific T cell responses following MNV infection.
To determine whether P1519-specific CD8 T cells were generated in the setting of physiological enteric infection, mice were infected p.o. with MNV-CR6 or MNV-CW3. Consistent with previous data (51, 52), strain CR6 established persistent infection in immunocompetent mice, while CW3 was cleared by day 7 p.i. (Fig. 5A). On days 8, 15, and 29 p.i., LPL, intraepithelial lymphocytes (IEL), MLN, and SPL were isolated and analyzed by flow cytometry using tetramer staining (Fig. 5B). Note that for these analyses, we used the Kb-P1519 tetramer matched to the sequence of the virus (i.e., Kb-P1519Y and Kb-P1519F for MNV-CW3 and MNV-CR6, respectively). Consistent with data from the experiments whose results are shown in Figure 1, the P1519 CD8 T cell response was most robust in the intestine (Fig. 5B). This observation was particularly striking in the case of MNV-CW3, where up to 30% of CD8 LPLs were specific for P1519Y (Fig. 5C). In contrast, while the responses to MNV-CR6 were also most pronounced in the LP, the magnitude of the responses were 3- to 4-fold lower than observed for MNV-CW3 (Fig. 5C and D). Of note, the absolute numbers of LPL and IEL were not significantly different between naive mice and mice infected with either MNV strain (data not shown).
Fig 5.

Robust epitope P1519-specific T cell responses following MNV infection. Mice were infected p.o. with 1.5 × 10⁶ PFU of MNV-CW3 or MNV-CR6. (A) Viral load in the terminal ileum (TI) was assessed on day 8 p.i. with MNV-CW3 or MNV-CR6. Dotted line indicates limit of detection. (B) Epitope-specific CD8 T cells in the indicated tissues were detected by tetramer staining on day 8 p.i. The data are representative of 8 mice per group. (C) Fractions of epitope-specific CD8 T cells in the IEL and LPL. The average absolute numbers of Tet+ IEL on day 8 were 1 × 10⁵ for MNV-CW3 and 1.5 × 10⁴ for MNV-CR6. (D) Total numbers of Tet+ CD8 T cells in spleen and MLN at day 8 p.i. In panels A, C, and D, horizontal lines show the means. (E) The epitope-specific CD8 T cell response in the LP was tracked for 29 days p.i. (F) Graph shows longitudinal summary data for the percentages of CD8 T cells staining with the respective MNV tetramer for MNV-CW3 versus MNV-CR6 infection. Note that MNV-CW3 and MNV-CR6 differ by a single amino acid in epitope P1519, and therefore, tetramers matching the appropriate strain were used in these experiments. In the experiment whose results are shown in panel A, naive cells were from the spleen; in the experiment whose results are shown in panel E, naive cells were from the LP. Naive cells from MLN and IEL showed similar backgrounds of tetramer staining (data not shown). *, differences between groups by the unpaired t test were statistically significant (P < 0.05).
In the case of MNV-CW3, time course analysis of Kb-P1519Y staining revealed a classic kinetic response curve, with expansion, contraction, and maintenance of antigen-specific CD8 T cells in the lamina propria. In contrast, infection with MNV-CR6 resulted in a blunted initial P1519F-specific response that failed to show a clear peak at day 8 p.i. (Fig. 5E and F). However, at days 15 and 29 p.i., the responses to CW3 and CR6 were similar in magnitude. Together, these data show that we are able to track MNV-specific intestinal CD8 T cells and that the magnitude and kinetics of the CD8 responses differ between two viruses with distinct biological behaviors.
Antigen-specific CD8 T cell responses to an acute and a persistent strain of MNV are phenotypically distinct.
During effector and memory T cell differentiation, the dynamic expression of cell-surface molecules is critical for tissue-specific localization and can be tracked by flow cytometry. Changes in these and other surface markers also reflect integration of signals received during activation and, thus, can provide insights into the differentiation program of the cells. To begin to define the temporal expression of key surface markers on antigen-specific T cells responding to mucosal MNV-CR6 and MNV-CW3 infection, we focused on LFA-1 (CD11a), VLA-1 (CD49d), and αEβ7 (CD103), as these integrins are expressed differentially on mucosal versus peripheral epitope-specific CD8 T cell subsets during lymphocytic choriomeningitis virus (LCMV) or Sendai virus infection (64, 65). Since MNV-CW3 and MNV-CR6 differ in their ability to persist, we further examined the expression of PD-1, a marker associated with T cell exhaustion in a number of chronic infections (66). Our analyses focused on LPL, where the largest MNV-specific CD8 T cell responses were found (Fig. 5B to D). As shown in Figure 6A, infection with either strain of MNV resulted in upregulation of LFA-1 α-chain, CD11a, on day 8 p.i. compared to its level in naive T cells. High expression of CD11a was maintained on CW3-specific T cells for at least 1 month following infection; in contrast, CD11a was gradually downregulated on CR6-specific CD8 T cells and by day 29 p.i. had returned to baseline. Like CD11a, CD49d (the α-chain of VLA-1) was upregulated on day 8 p.i. regardless of the infecting MNV strain (Fig. 6B). By day 15, both CW3- and CR6-specific lymphocytes had significantly downregulated CD49d expression, although in the case of CW3, expression remained above baseline even at day 29. Finally, as previously reported, intestinal lymphocytes in naive mice expressed high levels of CD103, the α subunit of the gut-homing integrin αEβ7 (67). In contrast, the presence of a CD103LO population (approximately half of MNV-specific LPL at day 8 p.i.) suggests that these cells were being recruited to the intestine from nonmucosal sites (Fig. 6C). By day 29, nearly all CR6-specific T lymphocytes had transitioned to a CD103HI phenotype; in contrast, the distribution of CD103 on CW3-specific LPL remained bimodal.
Fig 6.

Antigen-specific CD8 T cell responses to an acute and persistent strain of MNV are phenotypically distinct. (A to D) P1519-specific CD8 T cells from the LP of mice infected p.o. with MNV-CW3 and MNV-CR6 were analyzed for the expression of CD11a (A), CD49d (B), CD103 (C), and PD-1 (D) on days 8, 15, and 29 p.i. Mean fluorescence intensity is noted on the plots. The gating for the colored histogram plots was on live, tetramer-positive CD8 T lymphocytes; gray histograms denote CD44LO naive CD8 T cells. (E) Mean fluorescence intensity (MFI) for each surface marker is summarized for the histograms in panels A to D, except for CD103, where the fraction of CD103HI cells is shown. For all comparisons, groups of 8 mice were used. *, differences between groups by the unpaired t test were statistically significant (P < 0.05).
As expected, PD-1 was upregulated at day 8 p.i. on both CR6- and CW3-specific T cells, consistent with the expression of this molecule during early T cell activation (Fig. 6D). High expression of PD-1 on antigen-specific CD8 T cells has also been associated with T cell exhaustion and dysfunction in the setting of certain chronic infections (66). While the mechanism by which MNV-CR6 establishes persistent infection in wild-type mice is currently unknown, we hypothesized that CR6-specific but not CW3-specific LPL might maintain high levels of PD-1 expression at late time points. Contrary to our prediction, PD-1 expression was higher on CD8 T cells responding to MNV-CW3 than on those cells responding to MNV-CR6 infection at all time points examined. Collectively, these data show that, in addition to the difference in magnitude of the antigen-specific responses elicited by MNV-CW3 and MNV-CR6, these two strains result in P1519-specific CD8 T cell populations with distinct immunologic profiles. In the case of MNV-CR6, the pattern of integrin expression at late time points is consistent with virus-specific cells residing in the intestine. In contrast, the expression of these same molecules on CW3-specific CD8 T cells suggests that these cells either downregulate integrin expression over time or are continuously recruited from peripheral sites. While our experiments do not directly test these possibilities, immune surveillance by continuous recruitment of peripherally primed CD8 T cells to sites of infection has previously been demonstrated (68). Finally, the finding that infection with MNV-CR6 is not associated with PD-1 upregulation at late time points suggests that, in contrast to other chronic pathogens, MNV persistence is not associated with a previously described phenotype of classic CD8 T cell exhaustion.
Persistent MNV infection is associated with decreased functionality of virus-specific CD8 T cells.
A number of persistent viral infections have been associated with dysfunctional T cell responses (53, 66). Although PD-1 was not upregulated during chronic MNV-CR6 infection (Fig. 6D), we wanted to examine whether, compared to MNV-CW3, MNV-CR6 leads to CD8 T cells with altered functionality. To test this possibility, we infected mice with MNV-CW3 or MNV-CR6 p.o. and analyzed epitope-specific CD8 T cells in two ways, (i) by tetramer staining with Kb-P1519Y or Kb-P1519F or (ii) by in vitro stimulation with peptide P1519Y or P1519F (Fig. 7A). Consistent with our earlier results, after infection with MNV-CW3 or MNV-CR6, approximately 3.2% and 0.3%, respectively, of CD8 T cells in the spleen stained positive for the corresponding tetramer at day 8 p.i. (Fig. 7A). In a parallel analysis, in vitro stimulation with peptide P1519Y or P1519F resulted in IFN-γ production by 1.8% and 0.16% of CD8 T cells, respectively (Fig. 7B, 1st column). Thus, approximately one half of tetramer-positive CD8 T cells from either CW3- or CR6-infected animals are capable of producing IFN-γ at day 8 p.i. (Fig. 7B, 1st column, numbers in black). Similarly, approximately one-third of tetramer-positive splenocytes produced TNF-α after infection with either MNV-CW3 or MNV-CR6 (Fig. 7B, 2nd column). In contrast, a greater fraction of the total MNV-CR6- than of the MNV-CW3-specific CD8 T cell population produced MIP-1α or granzyme B (GZM-B) (Fig. 7B, 3rd and 4th columns). This difference in the fractions of MIP-1α- and GZM-B-producing cells could reflect improved functionality of CD8 T cells specific for MNV-CR6; alternatively, it could be due to skewing of the MNV-CR6 response toward MIP-1α and/or GZM-B production at the expense of other cytokines. To begin to address this issue, we compared cytokine, chemokine, and GZM-B coproduction in the setting of MNV-CW3 or MNV-CR6 infection (Fig. 7C). This analysis showed that, compared to the results for MNV-CR6, a significantly greater fraction of CW3-specific CD8 T cells in the spleen were polyfunctional, as measured by the ability to coproduce two effector functions in various combinations. These observations were also true for IEL in the intestine (Fig. 7D).
Fig 7.

Persistent MNV infection is associated with decreased functionality of virus-specific CD8 T cells. Mice were infected p.o. with 1.5 × 10⁶ PFU of MNV-CW3 or MNV-CR6. On day 8 p.i., equal numbers of splenocytes were stained with tetramer or stimulated in vitro with the appropriate P1519 peptide in the presence of GolgiStop and GolgiPlug. Cytokine, chemokine, or GZM-B production by stimulated cells was analyzed by flow cytometry. (A) Surface stain for CD8 and tetramer. Gated on live lymphocytes. The numbers above each gate (in red or blue) indicate the percentage of CD8 T cells that stained positive for the tetramer. (B) ICS stain after stimulation with the appropriate peptide. Gated on live lymphocytes. Functional cells are expressed as the fraction of CD8 T cells (above gate in color), as well as the fraction of the Tet+ population in the 1st column (black numbers at bottom of each plot). Naive background was subtracted from infected samples. *, note that GZM-B staining occasionally can exceed 100% of the tetramer-positive population, which could reflect GZM-B expression directly ex vivo in cells of different specificities. (C, D) Gated on live CD8 T lymphocytes. Numbers in color indicate cells that perform both functions as a percentage of all CD8 T cells. Naive background was subtracted from infected samples for each quadrant. (E) Patterns of expression of 4 functions by splenic CD8 T cells from infected mice. The y axis indicates the percentage of all CD8 T cells that produce any of the 4 functions. *, difference by nonpaired t test (P < 0.05) between MNV-CW3 and MNV-CR6 for a given combination of functions was statistically significant. (F, G) Pie charts showing cumulative fractions of CD8 T cells producing any combination of 4 (spleen) or 3 (IEL) cytokines. These experiments represent averages from 8 mice per infection and were repeated at least twice. Note that analysis for GZM-B was omitted from IEL samples due to the high background expression of this molecule in naive intestinal lymphocytes.
Next, we profiled CD8 T cells from MNV-CW3- and MNV-CR6-infected mice with respect to their ability to coproduce various combinations of four functions (IFN-γ, TNF-α, MIP-1α, and GZM-B) in response to stimulation with peptide P1519. This analysis confirmed the existence of a significant fraction of CD8 T cells producing only GZM-B and MIP-1α during MNV-CR6 infection and, also, revealed a greater frequency of MNV-specific CD8 T cells producing all four cytokines in response to MNV-CW3 (Fig. 7E). Figure 7F shows a summary of the functional profiles of splenic CD8 T cells from MNV-CW3- and MNV-CR6-infected mice in terms of total number of functions performed. Particularly striking in this analysis is the finding that the majority (69%) of CD8 T cells responding to MNV-CR6 performed only one of the four functions analyzed. When this analysis was applied to IEL, similarly diminished functionality was observed (Fig. 7G). Since our analysis is limited to IFN-γ, TNF-α, GZM-B, and MIP-1α, we cannot rule out the possibility that MNV-CR6-specific CD8 T cells remain polyfunctional with respect to other cytokines or functions. However, these data suggest that persistent infection with MNV is associated with inefficient acquisition and/or maintenance of polyfunctional capability with respect to cytokines, chemokines, or cytotoxic potential.
P1519-specific CD8 T cells can decrease MNV replication and shedding in persistently infected Rag1−/− mice.
While MNV-CR6 establishes persistent infection in wild-type mice, MNV-CW3 is cleared from the terminal ileum (TI) by day 8 p.i. (Fig. 5A) (49). Unlike wild-type animals, Rag1−/− mice fail to clear infection from the TI and become persistently infected with MNV-CW3 (49). Chachu et al. have shown that virus levels in persistently infected Rag1−/− mice can be reduced by adoptive transfer of total splenocytes from CW3 immune donors. Furthermore, viral control in these studies required the presence of all three components of the adaptive response, i.e., B cells and CD4 and CD8 T cells, as selective depletion of any one of these subsets prior to transfer led to incomplete viral clearance (49, 50). The relative importance of specific B or T cell subsets individually to MNV clearance, however, has not been examined. We used the Rag1−/− model of persistent MNV infection to assess the antiviral capacity of P1519-specific CD8 T cells in vivo (Fig. 8A). Rag1−/− mice were infected p.o. with MNV-CW3, and persistent viral shedding over 27 days was confirmed by qPCR (data not shown). To generate a robust population of antigen-specific CD8 T cells, wild-type C57BL/6 mice were infected p.o. with MNV-CW3. Spleens from these donor mice were isolated on day 8 p.i., and P1519Y-specific CD8 T lymphocytes were sorted and adoptively transferred to persistently infected Rag1−/− mice (Fig. 8A and B). To test whether the magnitude of the CD8 T cell response has a functional effect on the viral burden, Rag1−/− mice received 50,000 (1× group), 150,000 (3× group), or 450,000 (9× group) sorted Tet+ CD8 T cells on day 15 p.i. In addition, a control group of infected Rag1−/− mice did not receive any cells (0× group), and a second control group of Rag1−/− mice received cells but were kept MNV free (naive group).
Fig 8.

P1519Y-specific CD8 T cells decrease viral titer in persistently infected Rag1−/− mice. (A) Rag1−/− mice were infected p.o. with MNV-CW3. On day 7, wild-type C57BL/6 donors were infected by the same route and with the same dose of virus. (B) Tet+ CD8 T cells from donor spleens were sorted on day 15 (day-8 donor cells) for adoptive transfer to persistently infected Rag1−/− recipients in the numbers indicated in panel A. (C) Viral shedding in stool before and after adoptive transfer of Tet+ cells was monitored by qPCR. (D to G) Recipient mice were sacrificed 27 days p.i. (day 12 after adoptive transfer) and analyzed by flow cytometry for donor cells (D, E) and by plaque assay (F) and quantitative reverse transcription-PCR (G) for viral titer. Dotted lines indicate limit of detection. Error bars show standard deviations. *, differences between groups by the unpaired t test were statistically significant (P < 0.05).
Viral shedding was followed longitudinally during the experiment by measuring genome copy number in fecal pellets. By day 27, a similar overall decrease in viral shedding was observed among all groups that received Tet+ cells (data not shown). However, the rate of decline during the first 7 days following adoptive transfer was proportional to the number of transferred cells, although this trend did not achieve statistical significance (Fig. 8C).
Rag1−/− mice were sacrificed 12 days after adoptive transfer (day 27 p.i.), and tissues were analyzed for the presence of donor lymphocytes and MNV titers. As shown by the results in Figure 8D, CD8+ lymphocytes were readily detectable in the spleen and LP of Rag1−/− mice that received adoptively transferred cells, although there were no significant differences in the frequencies or total numbers of Tet+ cells in tissues of mice from the 1×, 3×, or 9× groups (Fig. 8E). As expected, no CD8 lymphocytes were detected in the 0× group (Fig. 8D). In addition, Tet+ cells did not expand in naive recipients (Fig. 8D), indicating that the expansion of these effector cells was in response to MNV infection rather than homeostatic proliferation, consistent with previously published data for adoptive immunotherapy of LCMV carrier mice (69). As expected, CD2+ CD8+ lymphocytes in recipient mice stained positive for tetramer and produced IFN-γ upon in vitro stimulation with P1519Y (data not shown). Furthermore, there were no differences in CD11a, CD103, or PD-1 staining between the three groups of infected recipients (data not shown).
To test whether transfer of MNV-specific Tet+ cells affected the viral burden in a dose-dependent manner, plaque assays and genome copy number counts in multiple tissues were used to monitor viral load. At day 27, viral loads were reduced by approximately 10-fold in all three groups of infected recipients (Fig. 8F and G). The greatest decrease in viral titer was seen in the terminal ileum, where virus was undetectable by plaque assay in the 3× and 9× groups (Fig. 8F). At this late time point (12 days after transfer), we did not observe significant differences between the 1×, 3×, and 9× groups, likely due to the fact that an equilibrium between viral reinfection and Tet+ CD8 T cell responses had been reached. Thus, these data suggest that CW3-specific CD8 T cells contribute to viral control in multiple tissues independently of other arms of the adaptive immune system.
DISCUSSION
Human noroviruses are estimated to cause 267 million infections and 200,000 deaths per year (70). While the burden of this disease is highest in developing countries, recent data from the CDC suggest that mortality from NV gastroenteritis is rising in the United States (71). Vaccine efforts to date have focused on eliciting antibodies that neutralize the binding of the P2 region of ORF2 to cell surface HBGAs (72). Due to the rapid emergence of novel P2 variants in response to herd immunity (particularly among members of genocluster GII.4, which account for >80% of human infections), developing a broadly neutralizing vaccine has been challenging (70, 72). Furthermore, despite recent progress in mapping antibody epitopes and elucidating cross-blockade patterns among NV genogroups, the existence of long-term protective humoral immunity remains controversial (70).
In contrast to humoral immunity, cellular responses to human NV infection have been largely uncharacterized, despite the fact that CD4 and CD8 T cell responses have been demonstrated in both infected and control volunteers (41, 73). Indeed, T cells are critical for the control of a number of other mucosal pathogens, including influenza virus and HIV (74, 75). The importance of defining the T cell component of NV immunity is further highlighted by a growing recognition that noroviruses are capable of establishing chronic mucosal infection in both immunocompromised and immunocompetent hosts (14–18).
In the present study, we use the murine model of NV infection to build upon previous work by Chachu et al., which established a critical role for CD8 T cells in the control of MNV infection (49). Our results demonstrate that (i) mucosal MNV infection elicits a robust CD8 T cell response specific for epitope P1519, (ii) this epitope is highly conserved in the P1 region of capsid proteins from all NV genogroups and seems to account for the majority of the CD8 T cell response, (iii) the magnitude and quality of the epitope-specific CD8 T cell responses differ dramatically for strains that cause acute versus chronic infection, with persistent MNV infection being associated with fewer and less-functional CD8 T cells at mucosal sites, and (iv) sufficient numbers of functional P1519-specific CD8 T cells are capable of reducing fecal viral shedding and tissue viral loads during persistent infection even in the absence of other components of adaptive immunity. We believe that these findings have the potential to affect future NV vaccine development and, more broadly, can serve as a starting point for understanding chronic mucosal infections.
The findings presented here could inform future vaccine development in two ways. First, we have established that virus-specific CD8 T cells are not only critical for control of MNV infection but are also sufficient for decreasing titers in chronically infected Rag1−/− animals. Thus, while antibodies clearly contribute to the control of natural NV infection, harnessing the T cell response might be another important goal for future vaccine designs. Second, we have identified a conserved immunodominant MHC class I epitope that could serve as a specific target in future vaccination strategies aimed at eliciting broadly neutralizing protective T cell immunity. Before our findings in the MNV system can be translated into useful clinical applications, they must first be validated in humans. Recent work by Lindesmith et al. has demonstrated that CD4+ and CD8+ peripheral blood mononuclear cells (PBMCs) from infected volunteers are capable of producing IFN-γ upon restimulation with VLPs in vitro (41, 73). Furthermore, subsets of both acutely infected individuals and control subjects showed T cell responses after stimulation with heterotypic VLPs, suggesting the existence of T cell memory and/or cross-stimulation of the T cell receptor (TCR) by closely related epitopes. It would be interesting to test whether such T cell responses could be elicited by stimulation with peptide P1519 and/or to map other immunodominant MHC class I epitopes from human NV. A related question is whether, compared to infection with live virus, vaccination with nonreplicating VLPs elicits CD8 T cell responses of comparable magnitude and diversity. This issue is particularly relevant in light of the facts that VLPs have been used in virtually all NV vaccination trials to date and that, in a recent study by LoBue et al., adoptively transferred CD4 or CD8 splenocytes from mice vaccinated with MNV-CW3 VLPs failed to protect recipients against challenge with the live virus (76). Finally, an important factor to consider when designing T cell-based vaccines is the optimal site of T cell priming. Specifically, while oral vaccination with VLPs might seem logical, it is not clear whether the generation of long-lasting protective immunity requires T cell priming at mucosal or peripheral sites. For example, MNV-CW3, which is successfully cleared, can be detected in spleens from immunocompetent mice at early time points, while the persistent CR6 strain is limited to mucosal sites (data not shown). Consistent with these observations, our data on the phenotype and differentiation state of responding CD8 T cells suggests a model whereby successful clearance of MNV-CW3 infection is associated with CD8 T cells that are continuously recruited to the mucosa from peripheral sites (Fig. 6). The MNV system provides a unique opportunity to address these questions, since MNV is capable of establishing infection via both mucosal and peripheral routes.
While persistent NV infection in immunocompromised patients has been well-documented, it is also clear that even immunocompetent individuals can be asymptomatic carriers and shed virus for many weeks (14–18). These observations have important implications for both vaccine design and public health measures. Here, we begin to address the question of NV persistence by taking advantage of two closely related MNV strains with different biological behaviors. Our results indicate that persistent MNV-CR6 infection is associated with fewer and less-functional virus-specific CD8 T cells than is MNV-CW3 infection. Contrary to our expectations, we did not observe upregulation of PD-1 on MNV-CR6-specific CD8 T cells (Fig. 6D), suggesting that a mechanism other than T cell exhaustion might be at play.
It is possible that weak CD8 T cell responses to MNV-CR6 reflect a high viral mutation rate driven by host immune pressure. Indeed, the constant emergence of new NV strains has been well documented and, as mentioned earlier, the most variable regions of the capsid gene encode antibody binding sites (10, 31). In the case of MNV-CR6, however, it is unlikely that viral escape via antigenic variation accounts for the blunted CD8 T cell response, for two reasons. First, one would expect similar mutation rates for MNV-CR6 and MNV-CW3, the latter of which is cleared rapidly. Second, our phylogenetic analysis indicates that epitope P1519 is highly conserved, making it an unlikely target for selection. The basis for the high conservation of P1519 is currently not known, but existing structural data provide some clues. The norovirus capsid molecule consists of three domains, termed S, P1, and P2, and exists in one of three quasiequivalent positions (A, B, and C) (63). The P domains mediate interactions between individual capsid molecules, leading to the formation of two distinct dimeric forms, A/B and C/C. The S domain, on the other hand, is involved in bringing together a total of 90 A/B and C/C dimers to form the icosahedral viral shell. X-ray crystallographic analysis of Norwalk virus (the prototypic member of genogroup I) has shown that, compared to the C/C dimer, the A/B dimer has a slightly bent conformation that is critical for capsid assembly. The bent conformation of A/B dimers is maintained via hydrogen bond interactions between two Ser residues in the S domain and a conserved Ser and Trp in the C terminus of P1 (77). Interestingly, the Ser and Trp amino acids involved in this interaction correspond to positions 1 and 2 in epitope P1519, providing a potential biological explanation for the sequence conservation in this region (Fig. 4 and Table 1). While future studies should examine MNV mutational escape from T cell responses, it is unlikely that the P1519 epitope is capable of substantial variation due to structural constraints. Therefore, epitope mutation is unlikely to account for the phenotypic and functional differences between responses to MNV-CW3 and MNV-CR6.
A number of viral pathogens establish persistent infection through various strategies of immune evasion. In the case of human papillomavirus, for example, subversion of interferon signaling by the E6 and E7 early genes is one such mechanism (78). Interestingly, the accessory MNV protein encoded by ORF4 was recently shown to downregulate IFN-β signaling, and viral clones with truncated ORF4 had decreased virulence in STAT1−/− mice (13). Future studies will have to determine whether this protein plays a role in MNV persistence by blunting innate immune responses. Another strategy for immune evasion by HPV relies on decreased processing and presentation of viral antigens through mechanisms such as biased codon usage, nuclear localization of early genes, preferential replication in cells that do not present antigen, and shedding from terminally differentiated keratinocytes to avoid systemic detection (78). At present, we do not know whether certain strains of MNV, such as MNV-CR6, might employ similar strategies to avoid or minimize detection by T cells. Previous studies have shown that MNV can infect and replicate in macrophages and dendritic cells in vivo; however, these experiments were carried out with a CW3 clone in STAT1−/− animals (79). It would be important to determine whether MNV-CR6 relies exclusively on myeloid cells for persistence in wild-type hosts or whether it has tropism for other cell lineages, such as terminally differentiated intestinal epithelial cells. This question is particularly relevant given the observation that, unlike MNV-CW3, MNV-CR6 is not detected in nonmucosal tissues.
Finally, the difference of a single amino acid in the P1519 epitope between MNV-CW3 and MNV-CR6 is intriguing, considering the differences in CD8 T cell responses directed against this determinant. This mismatch prevented us from directly testing the functionality of CR6-specific CD8 T cells in our Rag1−/− system, which is based on persistent CW3 infection. The data we present here suggest that cells from CR6-infected donors would fail to control infection in CW3-infected Rag1−/− recipients due to intrinsically impaired T cell functionality; however, such a failure could also be attributed to suboptimal binding between the donor TCR and a noncognate epitope. Interestingly, according to IEDB analysis, both peptides bind to Kb with equal affinity (Fig. 3A). In addition, stimulation of CD8 T cells from MNV-CR6-infected mice with the CW3 peptide P1519Y did not result in increased numbers of responders (Fig. 3C), suggesting a degree of cross-recognition of the P1519Y and P1519F epitopes. Nevertheless, definitively testing the functionality of CR6-specific CD8 T cells in the context of CW3 infection will require using the molecular genetics afforded by the MNV system to construct MNV-CR6P1-519F→Y and MNV-CW3P1-519Y→F mutant strains.
In this study, we begin to address the immunologic mechanisms underlying NV clearance and persistence. It is likely that insights gained from the MNV model will be applicable to other important human pathogens, such as HIV, influenza, and HPV. Mucosal surfaces not only provide an entry point for these viruses but often serve as reservoirs of persistence. The MNV model allows us to directly compare natural enteric pathogens that, although closely related, result in dramatically different immunologic outcomes. Understanding how adaptive cellular immunity efficiently clears MNV-CW3 and yet allows MNV-CR6 to persist will likely have an impact on the broader field of mucosal immunology.
ACKNOWLEDGMENTS
We thank Andy Johnson, Erietta Stelekati, and Pam Odorizzi for helpful discussions and for critically reading the manuscript. We thank Michael Paley, Michael Abt, Mohammed-Alkhatim Ali, Mario Noti, and Paul Giacomin for technical assistance. We thank Chris Hoffmann for technical help with the phylogenetic analysis. We also thank the Abramson Cancer Center Flow Cytometry and Cell Sorting Resource Laboratory for technical advice and support. The ACC Flow Cytometry and Cell Sorting Shared Resource are partially supported by an NCI Comprehensive Cancer Center Support Grant (number 2-P30 CA016520).
This work was supported by the following grants: NIH/NIDDK grant T32-DK007066, Training Program in Gastrointestinal Sciences; NIH/NIDDK grant P30DK050306, Center for Molecular Studies in Digestive and Liver Diseases (and its Molecular Pathology and Imaging, Molecular Biology, Cell Culture, and Mouse Core Facilities); NIH grant U01-AI-095608-02 to E.J.W. and D.A.; NIH/NIDDK grant K08-DK097301 to V.T.T.; Irvington Institute postdoctoral fellowship of the Cancer Research Institute to L.C.O.; and grant R01 AI054483 to H.W.V. Washington University and H.W.V. receive income based on licenses for MNV technology.
Footnotes
Published ahead of print 17 April 2013
REFERENCES
- 1. Glass RI, Bresee J, Jiang B, Gentsch J, Ando T, Fankhauser R, Noel J, Parashar U, Rosen B, Monroe SS. 2001. Gastroenteritis viruses: an overview. Novartis Found. Symp. 238:5–19, discussion 19–25 [DOI] [PubMed] [Google Scholar]
- 2. O'Ryan M, Prado V, Pickering LK. 2005. A millennium update on pediatric diarrheal illness in the developing world. Semin. Pediatr. Infect. Dis. 16:125–136 [DOI] [PubMed] [Google Scholar]
- 3. Fankhauser RL, Noel JS, Monroe SS, Ando T, Glass RI. 1998. Molecular epidemiology of “Norwalk-like viruses” in outbreaks of gastroenteritis in the United States. J. Infect. Dis. 178:1571–1578 [DOI] [PubMed] [Google Scholar]
- 4. Hutson AM, Atmar RL, Estes MK. 2004. Norovirus disease: changing epidemiology and host susceptibility factors. Trends Microbiol. 12:279–287 [DOI] [PMC free article] [PubMed] [Google Scholar]
- 5. Lopman BA, Brown DW, Koopmans M. 2002. Human caliciviruses in Europe. J. Clin. Virol. 24:137–160 [DOI] [PubMed] [Google Scholar]
- 6. Mead PS, Slutsker L, Dietz V, McCaig LF, Bresee JS, Shapiro C, Griffin PM, Tauxe RV. 1999. Food-related illness and death in the United States. Emerg. Infect. Dis. 5:607–625 [DOI] [PMC free article] [PubMed] [Google Scholar]
- 7. Amar CF, East CL, Gray J, Iturriza-Gomara M, Maclure EA, McLauchlin J. 2007. Detection by PCR of eight groups of enteric pathogens in 4,627 faecal samples: re-examination of the English case-control Infectious Intestinal Disease Study (1993-1996). Eur. J. Clin. Microbiol. Infect. Dis. 26:311–323 [DOI] [PubMed] [Google Scholar]
- 8. Monica B, Ramani S, Banerjee I, Primrose B, Iturriza-Gomara M, Gallimore CI, Brown DW, M F, Moses PD, Gray JJ, Kang G. 2007. Human caliciviruses in symptomatic and asymptomatic infections in children in Vellore, South India. J. Med. Virol. 79:544–551 [DOI] [PMC free article] [PubMed] [Google Scholar]
- 9. Parashar UD, Li JF, Cama R, DeZalia M, Monroe SS, Taylor DN, Figueroa D, Gilman RH, Glass RI. 2004. Human caliciviruses as a cause of severe gastroenteritis in Peruvian children. J. Infect. Dis. 190:1088–1092 [DOI] [PubMed] [Google Scholar]
- 10. Glass RI, Parashar UD, Estes MK. 2009. Norovirus gastroenteritis. N. Engl. J. Med. 361:1776–1785 [DOI] [PMC free article] [PubMed] [Google Scholar]
- 11. Malek M, Barzilay E, Kramer A, Camp B, Jaykus LA, Escudero-Abarca B, Derrick G, White P, Gerba C, Higgins C, Vinje J, Glass R, Lynch M, Widdowson MA. 2009. Outbreak of norovirus infection among river rafters associated with packaged delicatessen meat, Grand Canyon, 2005. Clin. Infect. Dis. 48:31–37 [DOI] [PubMed] [Google Scholar]
- 12. Glass PJ, Zeng CQ, Estes MK. 2003. Two nonoverlapping domains on the Norwalk virus open reading frame 3 (ORF3) protein are involved in the formation of the phosphorylated 35K protein and in ORF3-capsid protein interactions. J. Virol. 77:3569–3577 [DOI] [PMC free article] [PubMed] [Google Scholar]
- 13. McFadden N, Bailey D, Carrara G, Benson A, Chaudhry Y, Shortland A, Heeney J, Yarovinsky F, Simmonds P, Macdonald A, Goodfellow I. 2011. Norovirus regulation of the innate immune response and apoptosis occurs via the product of the alternative open reading frame 4. PLoS Pathog. 7:e1002413 doi: 10.1371/journal.ppat.1002413 [DOI] [PMC free article] [PubMed] [Google Scholar]
- 14. Atmar RL, Opekun AR, Gilger MA, Estes MK, Crawford SE, Neill FH, Graham DY. 2008. Norwalk virus shedding after experimental human infection. Emerg. Infect. Dis. 14:1553–1557 [DOI] [PMC free article] [PubMed] [Google Scholar]
- 15. Murata T, Katsushima N, Mizuta K, Muraki Y, Hongo S, Matsuzaki Y. 2007. Prolonged norovirus shedding in infants <=6 months of age with gastroenteritis. Pediatr. Infect. Dis. J. 26:46–49 [DOI] [PubMed] [Google Scholar]
- 16. Pang XL, Joensuu J, Vesikari T. 1999. Human calicivirus-associated sporadic gastroenteritis in Finnish children less than two years of age followed prospectively during a rotavirus vaccine trial. Pediatr. Infect. Dis. J. 18:420–426 [DOI] [PubMed] [Google Scholar]
- 17. Rockx B, De Wit M, Vennema H, Vinje J, De Bruin E, Van Duynhoven Y, Koopmans M. 2002. Natural history of human calicivirus infection: a prospective cohort study. Clin. Infect. Dis. 35:246–253 [DOI] [PubMed] [Google Scholar]
- 18. Siebenga JJ, Beersma MF, Vennema H, van Biezen P, Hartwig NJ, Koopmans M. 2008. High prevalence of prolonged norovirus shedding and illness among hospitalized patients: a model for in vivo molecular evolution. J. Infect. Dis. 198:994–1001 [DOI] [PubMed] [Google Scholar]
- 19. Hoffmann D, Hutzenthaler M, Seebach J, Panning M, Umgelter A, Menzel H, Protzer U, Metzler D. 2012. Norovirus GII.4 and GII.7 capsid sequences undergo positive selection in chronically infected patients. Infect. Genet. Evol. 12:461–466 [DOI] [PubMed] [Google Scholar]
- 20. Nilsson M, Hedlund KO, Thorhagen M, Larson G, Johansen K, Ekspong A, Svensson L. 2003. Evolution of human calicivirus RNA in vivo: accumulation of mutations in the protruding P2 domain of the capsid leads to structural changes and possibly a new phenotype. J. Virol. 77:13117–13124 [DOI] [PMC free article] [PubMed] [Google Scholar]
- 21. Saif MA, Bonney DK, Bigger B, Forsythe L, Williams N, Page J, Babiker ZO, Guiver M, Turner AJ, Hughes S, Wynn RF. 2011. Chronic norovirus infection in pediatric hematopoietic stem cell transplant recipients: a cause of prolonged intestinal failure requiring intensive nutritional support. Pediatr. Transplant. 15:505–509 [DOI] [PubMed] [Google Scholar]
- 22. Sukhrie FH, Siebenga JJ, Beersma MF, Koopmans M. 2010. Chronic shedders as reservoir for nosocomial transmission of norovirus. J. Clin. Microbiol. 48:4303–4305 [DOI] [PMC free article] [PubMed] [Google Scholar]
- 23. Parrino TA, Schreiber DS, Trier JS, Kapikian AZ, Blacklow NR. 1977. Clinical immunity in acute gastroenteritis caused by Norwalk agent. N. Engl. J. Med. 297:86–89 [DOI] [PubMed] [Google Scholar]
- 24. Blacklow NR, Cukor G, Bedigian MK, Echeverria P, Greenberg HB, Schreiber DS, Trier JS. 1979. Immune response and prevalence of antibody to Norwalk enteritis virus as determined by radioimmunoassay. J. Clin. Microbiol. 10:903–909 [DOI] [PMC free article] [PubMed] [Google Scholar]
- 25. Johnson PC, Hoy J, Mathewson JJ, Ericsson CD, DuPont HL. 1990. Occurrence of Norwalk virus infections among adults in Mexico. J. Infect. Dis. 162:389–393 [DOI] [PubMed] [Google Scholar]
- 26. Johnson PC, Mathewson JJ, DuPont HL, Greenberg HB. 1990. Multiple-challenge study of host susceptibility to Norwalk gastroenteritis in US adults. J. Infect. Dis. 161:18–21 [DOI] [PubMed] [Google Scholar]
- 27. Okhuysen PC, Jiang X, Ye L, Johnson PC, Estes MK. 1995. Viral shedding and fecal IgA response after Norwalk virus infection. J. Infect. Dis. 171:566–569 [DOI] [PubMed] [Google Scholar]
- 28. Black RE, Greenberg HB, Kapikian AZ, Brown KH, Becker S. 1982. Acquisition of serum antibody to Norwalk virus and rotavirus and relation to diarrhea in a longitudinal study of young children in rural Bangladesh. J. Infect. Dis. 145:483–489 [DOI] [PubMed] [Google Scholar]
- 29. Ryder RW, Singh N, Reeves WC, Kapikian AZ, Greenberg HB, Sack RB. 1985. Evidence of immunity induced by naturally acquired rotavirus and Norwalk virus infection on two remote Panamanian islands. J. Infect. Dis. 151:99–105 [DOI] [PubMed] [Google Scholar]
- 30. Bok K, Parra GI, Mitra T, Abente E, Shaver CK, Boon D, Engle R, Yu C, Kapikian AZ, Sosnovtsev SV, Purcell RH, Green KY. 2011. Chimpanzees as an animal model for human norovirus infection and vaccine development. Proc. Natl. Acad. Sci. U. S. A. 108:325–330 [DOI] [PMC free article] [PubMed] [Google Scholar]
- 31. Reeck A, Kavanagh O, Estes MK, Opekun AR, Gilger MA, Graham DY, Atmar RL. 2010. Serological correlate of protection against norovirus-induced gastroenteritis. J. Infect. Dis. 202:1212–1218 [DOI] [PMC free article] [PubMed] [Google Scholar]
- 32. Huang P, Farkas T, Marionneau S, Zhong W, Ruvoen-Clouet N, Morrow AL, Altaye M, Pickering LK, Newburg DS, LePendu J, Jiang X. 2003. Noroviruses bind to human ABO, Lewis, and secretor histo-blood group antigens: identification of 4 distinct strain-specific patterns. J. Infect. Dis. 188:19–31 [DOI] [PubMed] [Google Scholar]
- 33. Hutson AM, Airaud F, LePendu J, Estes MK, Atmar RL. 2005. Norwalk virus infection associates with secretor status genotyped from sera. J. Med. Virol. 77:116–120 [DOI] [PubMed] [Google Scholar]
- 34. Hutson AM, Atmar RL, Graham DY, Estes MK. 2002. Norwalk virus infection and disease is associated with ABO histo-blood group type. J. Infect. Dis. 185:1335–1337 [DOI] [PubMed] [Google Scholar]
- 35. Lindesmith L, Moe C, Marionneau S, Ruvoen N, Jiang X, Lindblad L, Stewart P, LePendu J, Baric R. 2003. Human susceptibility and resistance to Norwalk virus infection. Nat. Med. 9:548–553 [DOI] [PubMed] [Google Scholar]
- 36. Marionneau S, Ruvoen N, Le Moullac-Vaidye B, Clement M, Cailleau-Thomas A, Ruiz-Palacois G, Huang P, Jiang X, Le Pendu J. 2002. Norwalk virus binds to histo-blood group antigens present on gastroduodenal epithelial cells of secretor individuals. Gastroenterology 122:1967–1977 [DOI] [PMC free article] [PubMed] [Google Scholar]
- 37. Tan M, Jiang X. 2005. Norovirus and its histo-blood group antigen receptors: an answer to a historical puzzle. Trends Microbiol. 13:285–293 [DOI] [PubMed] [Google Scholar]
- 38. Jing Y, Qian Y, Huo Y, Wang LP, Jiang X. 2000. Seroprevalence against Norwalk-like human caliciviruses in Beijing, China. J. Med. Virol. 60:97–101 [DOI] [PubMed] [Google Scholar]
- 39. Parker SP, Cubitt WD, Jiang X. 1995. Enzyme immunoassay using baculovirus-expressed human calicivirus (Mexico) for the measurement of IgG responses and determining its seroprevalence in London, UK. J. Med. Virol. 46:194–200 [DOI] [PubMed] [Google Scholar]
- 40. Smit TK, Steele AD, Peenze I, Jiang X, Estes MK. 1997. Study of Norwalk virus and Mexico virus infections at Ga-Rankuwa Hospital, Ga-Rankuwa, South Africa. J. Clin. Microbiol. 35:2381–2385 [DOI] [PMC free article] [PubMed] [Google Scholar]
- 41. Lindesmith L, Moe C, Lependu J, Frelinger JA, Treanor J, Baric RS. 2005. Cellular and humoral immunity following Snow Mountain virus challenge. J. Virol. 79:2900–2909 [DOI] [PMC free article] [PubMed] [Google Scholar]
- 42. LoBue AD, Lindesmith LC, Baric RS. 2010. Identification of cross-reactive norovirus CD4+ T cell epitopes. J. Virol. 84:8530–8538 [DOI] [PMC free article] [PubMed] [Google Scholar]
- 43. Tacket CO, Sztein MB, Losonsky GA, Wasserman SS, Estes MK. 2003. Humoral, mucosal, and cellular immune responses to oral Norwalk virus-like particles in volunteers. Clin. Immunol. 108:241–247 [DOI] [PubMed] [Google Scholar]
- 44. Atmar RL, Bernstein DI, Harro CD, Al-Ibrahim MS, Chen WH, Ferreira J, Estes MK, Graham DY, Opekun AR, Richardson C, Mendelman PM. 2011. Norovirus vaccine against experimental human Norwalk virus illness. N. Engl. J. Med. 365:2178–2187 [DOI] [PMC free article] [PubMed] [Google Scholar]
- 45. Gallimore CI, Lewis D, Taylor C, Cant A, Gennery A, Gray JJ. 2004. Chronic excretion of a norovirus in a child with cartilage hair hypoplasia (CHH). J. Clin. Virol. 30:196–204 [DOI] [PubMed] [Google Scholar]
- 46. Wobus CE, Thackray LB, Virgin HW., IV 2006. Murine norovirus: a model system to study norovirus biology and pathogenesis. J. Virol. 80:5104–5112 [DOI] [PMC free article] [PubMed] [Google Scholar]
- 47. Karst SM, Wobus CE, Lay M, Davidson J, Virgin HW., IV 2003. STAT1-dependent innate immunity to a Norwalk-like virus. Science 299:1575–1578 [DOI] [PubMed] [Google Scholar]
- 48. McCartney SA, Thackray LB, Gitlin L, Gilfillan S, Virgin HW, Colonna M. 2008. MDA-5 recognition of a murine norovirus. PLoS Pathog. 4:e1000108 doi: 10.1371/journal.ppat.1000108 [DOI] [PMC free article] [PubMed] [Google Scholar]
- 49. Chachu KA, LoBue AD, Strong DW, Baric RS, Virgin HW. 2008. Immune mechanisms responsible for vaccination against and clearance of mucosal and lymphatic norovirus infection. PLoS Pathog. 4:e1000236 doi: 10.1371/journal.ppat.1000236 [DOI] [PMC free article] [PubMed] [Google Scholar]
- 50. Chachu KA, Strong DW, LoBue AD, Wobus CE, Baric RS, Virgin HW., IV 2008. Antibody is critical for the clearance of murine norovirus infection. J. Virol. 82:6610–6617 [DOI] [PMC free article] [PubMed] [Google Scholar]
- 51. Cadwell K, Patel KK, Maloney NS, Liu TC, Ng AC, Storer CE, Head RD, Xavier R, Stappenbeck TS, Virgin HW. 2010. Virus-plus-susceptibility gene interaction determines Crohn's disease gene Atg16L1 phenotypes in intestine. Cell 141:1135–1145 [DOI] [PMC free article] [PubMed] [Google Scholar]
- 52. Thackray LB, Wobus CE, Chachu KA, Liu B, Alegre ER, Henderson KS, Kelley ST, Virgin HW., IV 2007. Murine noroviruses comprising a single genogroup exhibit biological diversity despite limited sequence divergence. J. Virol. 81:10460–10473 [DOI] [PMC free article] [PubMed] [Google Scholar]
- 53. Wherry EJ, Blattman JN, Murali-Krishna K, van der Most R, Ahmed R. 2003. Viral persistence alters CD8 T-cell immunodominance and tissue distribution and results in distinct stages of functional impairment. J. Virol. 77:4911–4927 [DOI] [PMC free article] [PubMed] [Google Scholar]
- 54. Saitou N, Nei M. 1987. The neighbor-joining method: a new method for reconstructing phylogenetic trees. Mol. Biol. Evol. 4:406–425 [DOI] [PubMed] [Google Scholar]
- 55. Kimura M. 1980. A simple method for estimating evolutionary rates of base substitutions through comparative studies of nucleotide sequences. J. Mol. Evol. 16:111–120 [DOI] [PubMed] [Google Scholar]
- 56. Tamura K, Peterson D, Peterson N, Stecher G, Nei M, Kumar S. 2011. MEGA5: Molecular Evolutionary Genetics Analysis using maximum likelihood, evolutionary distance, and maximum parsimony methods. Mol. Biol. Evol. 28:2731–2739 [DOI] [PMC free article] [PubMed] [Google Scholar]
- 57. Vita R, Zarebski L, Greenbaum JA, Emami H, Hoof I, Salimi N, Damle R, Sette A, Peters B. 2010. The immune epitope database 2.0. Nucleic Acids Res. 38:D854–D862 [DOI] [PMC free article] [PubMed] [Google Scholar]
- 58. Crooks GE, Hon G, Chandonia JM, Brenner SE. 2004. WebLogo: a sequence logo generator. Genome Res. 14:1188–1190 [DOI] [PMC free article] [PubMed] [Google Scholar]
- 59. Falk K, Rotzschke O, Stevanovic S, Jung G, Rammensee HG. 1991. Allele-specific motifs revealed by sequencing of self-peptides eluted from MHC molecules. Nature 351:290–296 [DOI] [PubMed] [Google Scholar]
- 60. Rammensee HG, Friede T, Stevanoviic S. 1995. MHC ligands and peptide motifs: first listing. Immunogenetics 41:178–228 [DOI] [PubMed] [Google Scholar]
- 61. Katayama K, Shirato-Horikoshi H, Kojima S, Kageyama T, Oka T, Hoshino F, Fukushi S, Shinohara M, Uchida K, Suzuki Y, Gojobori T, Takeda N. 2002. Phylogenetic analysis of the complete genome of 18 Norwalk-like viruses. Virology 299:225–239 [DOI] [PubMed] [Google Scholar]
- 62. Patel MM, Hall AJ, Vinje J, Parashar UD. 2009. Noroviruses: a comprehensive review. J. Clin. Virol. 44:1–8 [DOI] [PubMed] [Google Scholar]
- 63. Prasad BV, Rothnagel R, Jiang X, Estes MK. 1994. Three-dimensional structure of baculovirus-expressed Norwalk virus capsids. J. Virol. 68:5117–5125 [DOI] [PMC free article] [PubMed] [Google Scholar]
- 64. Ely KH, Cookenham T, Roberts AD, Woodland DL. 2006. Memory T cell populations in the lung airways are maintained by continual recruitment. J. Immunol. 176:537–543 [DOI] [PubMed] [Google Scholar]
- 65. Masopust D, Vezys V, Wherry EJ, Barber DL, Ahmed R. 2006. Cutting edge: gut microenvironment promotes differentiation of a unique memory CD8 T cell population. J. Immunol. 176:2079–2083 [DOI] [PubMed] [Google Scholar]
- 66. Wherry EJ. 2011. T cell exhaustion. Nat. Immunol. 12:492–499 [DOI] [PubMed] [Google Scholar]
- 67. Berlin C, Bargatze RF, Campbell JJ, von Andrian UH, Szabo MC, Hasslen SR, Nelson RD, Berg EL, Erlandsen SL, Butcher EC. 1995. alpha 4 integrins mediate lymphocyte attachment and rolling under physiologic flow. Cell 80:413–422 [DOI] [PubMed] [Google Scholar]
- 68. Young KG, Maclean S, Dudani R, Krishnan L, Sad S. 2011. CD8+ T cells primed in the periphery provide time-bound immune-surveillance to the central nervous system. J. Immunol. 187:1192–1200 [DOI] [PMC free article] [PubMed] [Google Scholar]
- 69. Jamieson BD, Ahmed R. 1989. T cell memory. Long-term persistence of virus-specific cytotoxic T cells. J. Exp. Med. 169:1993–2005 [DOI] [PMC free article] [PubMed] [Google Scholar]
- 70. Debbink K, Lindesmith LC, Donaldson EF, Baric RS. 2012. Norovirus immunity and the great escape. PLoS Pathog. 8:e1002921 doi: 10.1371/journal.ppat.1002921 [DOI] [PMC free article] [PubMed] [Google Scholar]
- 71. Hall AJ, Curns AT, McDonald LC, Parashar UD, Lopman BA. 2012. The roles of Clostridium difficile and Norovirus among gastroenteritis-associated deaths in the United States, 1999-2007. Clin. Infect. Dis. 55:216–223 [DOI] [PubMed] [Google Scholar]
- 72. Debbink K, Donaldson EF, Lindesmith LC, Baric RS. 2012. Genetic mapping of a highly variable norovirus GII.4 blockade epitope: potential role in escape from human herd immunity. J. Virol. 86:1214–1226 [DOI] [PMC free article] [PubMed] [Google Scholar]
- 73. Lindesmith LC, Donaldson E, Leon J, Moe CL, Frelinger JA, Johnston RE, Weber DJ, Baric RS. 2010. Heterotypic humoral and cellular immune responses following Norwalk virus infection. J. Virol. 84:1800–1815 [DOI] [PMC free article] [PubMed] [Google Scholar]
- 74. Braciale TJ, Sun J, Kim TS. 2012. Regulating the adaptive immune response to respiratory virus infection. Nat. Rev. Immunol. 12:295–305 [DOI] [PMC free article] [PubMed] [Google Scholar]
- 75. Virgin HW, Walker BD. 2010. Immunology and the elusive AIDS vaccine. Nature 464:224–231 [DOI] [PubMed] [Google Scholar]
- 76. LoBue AD, Thompson JM, Lindesmith L, Johnston RE, Baric RS. 2009. Alphavirus-adjuvanted norovirus-like particle vaccines: heterologous, humoral, and mucosal immune responses protect against murine norovirus challenge. J. Virol. 83:3212–3227 [DOI] [PMC free article] [PubMed] [Google Scholar]
- 77. Prasad BV, Hardy ME, Dokland T, Bella J, Rossmann MG, Estes MK. 1999. X-ray crystallographic structure of the Norwalk virus capsid. Science 286:287–290 [DOI] [PubMed] [Google Scholar]
- 78. Tindle RW. 2002. Immune evasion in human papillomavirus-associated cervical cancer. Nat. Rev. Cancer. 2:59–65 [DOI] [PubMed] [Google Scholar]
- 79. Wobus CE, Karst SM, Thackray LB, Chang KO, Sosnovtsev SV, Belliot G, Krug A, Mackenzie JM, Green KY, Virgin HW. 2004. Replication of Norovirus in cell culture reveals a tropism for dendritic cells and macrophages. PLoS Biol. 2:e432 doi: 10.1371/journal.pbio.0020432 [DOI] [PMC free article] [PubMed] [Google Scholar]