

Abstract
How does the brain develop differently to support nocturnality in some mammals, but diurnality in others? To answer this, one might look to the suprachiasmatic nucleus (SCN), which is entrained by light via the retinohypothalamic tract (RHT). However, because the SCN is more active during the day in all mammals studied thus far, it alone cannot determine circadian phase preference. In adult Norway rats (Rattus norvegicus), which are nocturnal, the RHT also projects to the ventral subparaventricular zone (vSPVZ), an adjacent region that expresses an in-phase pattern of SCN-vSPVZ neuronal activity. In contrast, in adult Nile grass rats (Arvicanthis niloticus), which are diurnal, an anti-phase pattern of SCN-vSPVZ neuronal activity is expressed. We hypothesized that these species differences result in part from a weak or absent RHT-to-vSPVZ projection in grass rats. Here, using a developmental comparative approach, we assessed species differences in behavior, hypothalamic activity, and RHT anatomy. We report that a robust retina-to-vSPVZ projection develops in Norway rats around the end of the second postnatal week when nocturnal wakefulness and the in-phase pattern of neuronal activity emerge. In grass rats, however, such a projection does not develop and the emergence of the anti-phase pattern during the second postnatal week is accompanied by increased diurnal wakefulness. When considered within the context of previously published reports on RHT projections in a variety of species, the current findings suggest that how and when the retina connects to the hypothalamus differentially shapes brain and behavior to produce animals that occupy opposing temporal niches.
Keywords: suprachiasmatic nucleus, subparaventricular zone, wakefulness, presynaptic terminals, PACAP, VIP
Mammals exhibit sensory and thermoregulatory adaptations that are thought to have enhanced survival in a nocturnal niche (Crompton et al., 1978; Menaker et al., 1997). These adaptations, along with the fact that most mammalian species today are nocturnal, suggest that nocturnality is a primitive character of Mammalia (Campi et al., 2011; Park, 1940; Smale et al., 2003). Accordingly, diurnality is a derived character that has reemerged independently in some mammalian lineages (Campi et al., 2011; Smale et al., 2003). How the brain develops to support one or the other circadian phase preference is not known.
Circadian rhythms of sleep and wakefulness are regulated by a system that includes the retina, suprachiasmatic nucleus (SCN) of the hypothalamus and their connection via the retinohypothalamic tract (RHT) (Hannibal, 2002a). All mammals studied thus far—whether diurnal or nocturnal—exhibit a rhythm of increased SCN activity during the day (Challet, 2007; Fuller et al., 2006; Houben et al., 2009). Consequently, interactions of the RHT and SCN with downstream structures are likely to account for species differences in phase preference (Smale et al., 2003). One candidate downstream structure, adjacent to the SCN and also important for the expression of circadian behavior (Lu et al., 2001; Schwartz et al., 2009), is the ventral subparaventricular zone (vSPVZ). In adult Norway rats (Rattus norvegicus), which are nocturnal, the SCN and vSPVZ exhibit in-phase activity such that the SCN and vSPVZ are both more active during the day than during the night (Nunez et al., 1999; Schwartz et al., 2004). In contrast, in adult Nile grass rats (Arvicanthis niloticus), a closely related Murid rodent (Campi et al., 2011), that exhibits behavioral and retinal hallmarks of diurnality (Blanchong et al., 1999; Gaillard et al., 2008), the SCN and vSPVZ exhibit anti-phase activity (Nunez et al., 1999; Schwartz et al., 2004). It is not known which features of the SCN or its downstream projections account for the different neural activity patterns in these two species (Schwartz et al., 2011).
Developmental investigations of sleep and wake behavior in altricial rodents, including Norway rats, are complicated by the fact that infants at the earliest ages, unlike adults, do not exhibit clear state-dependent electroencephalographic (EEG) activity (Gramsbergen, 1976; Seelke and Blumberg, 2008). However, sleep and wakefulness can be reliably studied in infant rats using electromyographic (EMG) and behavioral measures alone (Blumberg and Seelke, 2010). Using these methods, we recently examined the trajectory of day-night differences in sleep and wakefulness in developing Norway rats (Gall et al., 2008). Here, using a developmental comparative approach, we extend our analysis of circadian behavior to Nile grass rats. In infants of both species across the first two postnatal weeks, we identify day-night differences in behavior, Fos immunoreactivity (Fos-ir; a marker of neuronal activation) in the SCN and vSPVZ, RHT projections to the hypothalamus, and presynaptic terminals expressing pituitary adenylate cyclase-activating peptide (PACAP) or vasoactive intestinal peptide (VIP) in the vSPVZ. Our findings converge to support the hypothesis that developmental and species differences in RHT projections to the vSPVZ help to explain the emergence of circadian phase preference in these two species.
Materials and Methods
All experiments were carried out in accordance with the National Institutes of Health Guide for the Care and Use of Laboratory Animals (NIH Publication No. 80-23) and were approved by the Institutional Animal Care and Use Committee of the University of Iowa.
Subjects
A total of 95 Nile grass rats from 53 litters and 84 Norway rats from 49 litters were used in this study. Males and females were distributed equally among all experimental groups. When littermates were used they were always assigned to different experimental groups. All pups were checked for clear milk bands before being used. Norway rats and grass rats were maintained in separate rooms in the animal colony at the University of Iowa. Litters of Norway rats were culled to 8 pups within 3 days of birth (day of birth = Day 0). Because grass rat litters typically had fewer than 8 pups, they were not culled. Grass rat litters averaged about 6 pups and no litters under 4 pups were used. All pups were housed with their mothers in standard laboratory cages and received food and water ad libitum. All rats were maintained on a 12-hr light-dark cycle, with lights on at 0700 hrs for Norway rats and 0600 hrs for grass rats.
Experiment 1: Development of day-night sleep and wake behavior in grass rats
Surgery
Twelve P2 (body weights: 3.3–5.3 g), 12 P6-7 (hereafter P6; body weights: 6.4–10.7 g) and 12 P15 (body weights: 15.0–23.8 g) grass rats were used. Under isofluorane anesthesia, bipolar stainless steel hook electrodes (50 μm diameter; California Fine Wire, Grover Beach, CA) were implanted bilaterally in the nuchal muscle and secured with flexible collodion. A ground wire was looped through the back and secured with flexible collodion. Surgeries and anesthesia typically lasted 5–7 min. The pup was then transferred to the testing chamber and allowed at least 45 min to recover and acclimate. Surgeries performed at night were illuminated using a dim red light, with care being taken to ensure that pups were never exposed to white light.
Apparatus
The testing environment consisted of an electrically shielded, double-walled glass chamber (height = 17 cm, i.d. = 12.5 cm) with a Plexiglas lid. An access hole in the side of the chamber allowed for the passage of humidified air (flow rate: 300 ml/min) and EMG electrodes. Heated water circulated through the walls of the chamber to maintain air temperature at approximately 35.5°C for P2 grass rats, 35°C for P6 grass rats, and 33.5°C for P15 grass rats. In preliminary studies, these temperatures were determined to be within the thermoneutral range for grass rats at these ages using similar methods for studying thermoneutrality in developing Norway rats (Blumberg, 2001; Spiers and Adair, 1986).
Recording procedure
During the day or night, freely moving pups were allowed to cycle undisturbed between sleep and wakefulness for 6 hrs while EMG data were recorded. Nuchal electrodes were connected to differential amplifiers (A-M systems, Carlsbad, WA) and their signals were amplified (x10k) and filtered (300–5000 Hz). EMG signals were sampled at 1 kHz, integrated, and full-wave rectified using a data acquisition system (BioPac Systems, Inc., Santa Barbara, CA). Testing times were arranged so that the midpoint of each photoperiod coincided with the midpoint of the 6-hr test. Accordingly, tests during the day occurred from 0900 to 1500 hrs and tests during the night occurred from 2100 to 0300 hrs. Daytime and nighttime tests were counterbalanced.
Experiment 2: Development of day-night hypothalamic activity in Norway rats and grass rats
Tissue preparation
Twelve P8 (body weights: 17.7–25.8 g) and 12 P15 (body weights: 36.6–49.9 g) Norway rats and 12 P6 (body weights: 5.4–12.0 g) and 12 P15 (body weights: 19.3–30.5 g) grass rats were used. During the day or night, pups were removed from the litter and immediately sacrificed approximately 90 min after the midpoint of their respective photoperiod, allowing sufficient time for production of the Fos protein (Cirelli and Tononi, 2000). Accordingly, P8 and P15 Norway rats were sacrificed at 1430 or 0230 hrs and P6 and P15 grass rats were sacrificed at 1330 or 0130 hrs. At night, a dim red light was used for illumination and care was taken to ensure that these pups were never exposed to white light. Daytime and nighttime tests were counterbalanced. Animals were killed with an overdose of Nembutal and perfused transcardially with phosphate buffered saline (PBS; pH 7.4) followed by 4% paraformaldehyde (PFA) in phosphate buffer (PB; pH 7.4). Brains were removed and stored in 30% sucrose solution. After 5–10 days in 30% sucrose solution, brains were placed on a freezing microtome and sliced in the coronal plane (40 μm sections).
Fos immunohistochemistry
Immunohistochemistical procedures were performed as described previously (Todd et al., 2010). All reactions were conducted at room temperature. Free-floating sections were pretreated with normal goat serum for 1 h, rinsed with PBS, and then incubated overnight with the primary antibody (see Table 1) in 0.01 M PBS and 0.3% Triton X. This rabbit polyclonal antibody was raised against amino acids 210–335 mapping at the C-terminus of human c-Fos and stained a single band of 55 kDa on Western blots from human carcinoma tissue (manufacturer’s technical information). The next day, the sections were rinsed with PBS and then incubated in a biotinylated goat anti-rabbit IgG secondary antibody (1:200; Vector Laboratories, Burlingame, CA) for 1 h in 0.01 M PBS and 0.3% Triton X. After additional PBS rinses, tissues were reacted with an avidin-biotin peroxidase complex (Vector Laboratories) for 1 h. The sections were again rinsed with PBS before reaction with diaminobenzidine solution and hydrogen peroxide (Sigma-Aldrich, St. Louis, MO). The reaction was terminated with PBS. For sections serving as negative controls, primary antibodies were omitted. All sections were mounted, dehydrated with alcohol, and cleared with xylenes. All slides were then coverslipped with Depex.
Table 1.
Primary antibodies used in this study.
| Antibody | Source | Immunogen | Dilution |
|---|---|---|---|
| c-Fos | Santa Cruz Biotechnology, sc-7202, rabbit polyclonal | Amino acids 210–335 of human c-Fos | 1:2000 |
| PACAP | Gift from Jens Hannibal, Mab JHH1, mouse monoclonal | Rat PACAP-38 conjugated to ovalbumin by glutaraldehyde | 1:20 |
| VIP | Peninsula Laboratories, T-5030, guinea pig polyclonal | Synthetic VIP: H-His-Ser-Asp-Ala-Val-Phe-Thr-Asp-Asn-Tyr-Thr-Arg-Leu-Arg-Lys-Gln-Met-Ala-Val-Lys-Lys-Tyr-Leu-Asn-Ser-Ile-Leu-Asn-NH2 | 1:200 |
PACAP, pituitary adenylate cyclase-activating peptide; VIP, vasoactive intestinal peptide.
Experiment 3: Development of RHT projections in Norway rats and grass rats
Eye injection
Four P4 (body weights = 8.8–13.6 g), 4 P11 (body weights = 24.7–33.0 g), and 4 P17 (body weights = 49.0–54.2 g) Norway rats and 4 P2-3 (body weights = 4.7–8.3 g) and 4 P11 (body weights = 11.6–16.6 g) grass rats were used. Three additional adult grass rats (body weights = 90.0–135.0 g) were also used. Under isofluorane anesthesia, each rat received a unilateral intravitreal injection as follows: For P4 and P11 Norway rats, and P2 grass rats, a 30 gauge needle attached to a 10 μl Hamilton syringe was inserted through the skin between the sealed eyelids and into the orbit. For P17 Norway rats and P11 and adult grass rats, ages at which the eyelids have already opened, the procedure was the same except the needle was inserted directly into the orbit. Approximately 10 μl of Alexa Fluor 594 (Texas-Red)-conjugated CTB (1 mg/ml; Molecular Probes, Eugene OR, USA) in PBS was slowly injected into the right or left eye in a counterbalanced manner (Allen and Earnest, 2005). For adult grass rats, 10–15 μl of CTB solution was injected unilaterally. Following the injection, the needle remained in the eye for 15 s before removal.
Tissue preparation and histology
Four days after the injection, P8, P15, and P21 Norway rats and P6 and P15 grass rats were overdosed and perfused as in Experiment 2. Adult grass rats were overdosed and perfused 4–6 days after the injection. Brains were postfixed, stored, and sliced as in Experiment 2. To preserve fluorescence, every other section was mounted and coverslipped using Vectastain Hard Set (Vector Laboratories). The remaining sections were mounted and Nissl-stained. They were then dehydrated with alcohol, cleared with citrus clearing solution, and coverslipped using Depex.
Experiment 4: Effect of light stimulation during the dark period on hypothalamic activity
Procedure
Twelve P8 (body weights = 14.3–21.8 g) and 12 P15 (body weights = 45.7–53.0 g) Norway rats were used. During the dark period, two littermates were removed and immediately placed—in separate rooms—into thermoneutral testing chambers identical to those described in Experiment 1. Chamber temperature was maintained at 35°C and 32°C for P8 and P15 rats, respectively. A dim red light was used for illumination in the dark. After 15 min of acclimation to the chamber, one littermate was maintained in the dark and the other was exposed to standard room lighting for 2 hrs. The midpoint of the 2-hr test was timed to occur during the midpoint of dark period, from 2400-0200.
Tissue preparation, immunohistochemistry, and histology
Immediately after the 2-hr exposure period, all subjects were overdosed and perfused as in Experiment 2. Brains were postfixed, stored, and sliced as in Experiment 2. Every other section throughout the hypothalamus was collected and Fos-immunohistochemistry was performed as previously described. The remaining sections were collected and Nissl-stained as in Experiment 3.
Experiment 5: Developmental expression of PACAP and VIP presynaptic terminals in the vSPVZ in Norway rats and grass rats
Tissue preparation
Six P8 (body weights = 19.4–23.8 g), 6 P11 (body weights = 22.8–30.8 g), 6 P15 (body weights = 36.0–48.1 g), and 6 P21 (body weights = 54.9–71.1 g) Norway rats and 6 P6 (body weights = 4.3–7.6 g), 6 P11 (body weights = 9.1–12.3 g), 6 P15 (body weights = 11.0–14.8 g), and 6 P21 (body weights = 22.8–25.4 g) grass rats were used. At the midpoint of their respective daytime photoperiods, pups were removed from the litter and immediately sacrificed. Accordingly, Norway rats were sacrificed at 1300 hrs and grass rats were sacrificed at 1200 hrs. Animals were killed with an overdose of Nembutal and perfused transcardially with PBS followed by 2% PFA and 0.2% picric acid in PB. Brains were removed and stored in 30% sucrose solution for 5–10 days. Brains were then immersed in OCT compound (Sakura, Torrance, CA) and snap frozen in isopentane cooled in a dry ice/ethanol bath. Using a cryostat, 18 μm sections were cut in the coronal plane and thaw-mounted onto gelatin-subbed slides.
PACAP and VIP Immunohistochemistry
Sections were blocked in 2.5% bovine serum albumin and 0.1% Triton X-100 in PBS for 1 h, followed by incubation with primary antibodies (see Table 1) at 4°C overnight in the same solution. The monoclonal antibody against PACAP was collected from mice immunized with rat PACAP-38 conjugated to ovalbumin by glutaraldehyde. This antibody displays equal affinity for PACAP-38 and PACAP-27, recognizing an epitope between amino acids 6–10, but has no affinity with VIP (Hannibal et al., 1995). Preabsorption with PACAP-38 or PACAP-27 blocks staining (Hannibal et al., 1997). This antibody has been previously used to detect PACAP in the RHT and exhibits a characteristic pattern of staining in the SCN (Hannibal, 2002b; Hannibal et al., 2000).
The polyclonal antibody against VIP was collected from guinea pigs immunized with synthetic VIP (antigen sequence, H-His-Ser-Asp-Ala-Val-Phe-Thr-Asp-Asn-Tyr-Thr-Arg-Leu-Arg-Lys-Gln-Met-Ala-Val-Lys-Lys-Tyr-Leu-Asn-Ser-Ile-Leu-Asn-NH2). Radioimmunoassay shows no cross reactivity with PHI-27, PHM-23, VIP (10–28), VIP (1–12), VIP guinea pig and chicken, PACAP-38, and substance P (manufacturer’s technical information). This antibody exhibits a characteristic pattern of staining in the SCN (Belenky et al., 2008; Vida et al., 2010).
Sections were washed in PBS and secondary antibodies (Alexa Fluor 488- or 568-conjugated; 1:200; Molecular Probes) were applied in PBS for 1 hr. Nuclei were counterstained with 4′,6-diamidino-2-phenylindole (Sigma-Aldrich) added to the final wash. For sections serving as negative controls, the procedure was the same except primary antibodies were omitted. Slides were coverslipped with Fluorogel (Electron Microscopy Sciences, Hatfield, PA).
Confocal microscopy
Sections were imaged sequentially using a SP-5 Leica confocal laser scanning microscope (Leica Microsystems, Germany) with an argon 488 nm laser and a helium/neon 543 nm laser. Two sections containing the vSPVZ were selected from each animal at matching rostrocaudal levels across all groups. For each section, using an oil immersion 63x objective and a magnification factor of 4, a z-stack of optical images at 1 μm layer intervals was acquired and digitized into 512 × 512 pixel bitmaps. The area imaged corresponded to a 61.5 μm-wide square area within the vSPVZ. Laser settings were held constant across all subjects.
Data Analysis
Sleep and wake behavior
EMG data from Experiment 1 were analyzed as described previously (Karlsson et al., 2005). Briefly, the records were dichotomized into bouts of sleep and wakefulness as follows: For each rat, the amplitudes of 5 1-s segments of both atonia and high-tone were averaged and the midpoint between the two was determined. Periods of at least 1 s in which muscle tone was below the midpoint were defined as atonia (indicative of sleep), whereas those above the midpoint were defined as high tone (indicative of wakefulness). An experienced individual blind to experimental condition scored all data.
Sleep and wake bout durations for all pups were imported into JMP 5.0 (SAS Institute, Cary, NC). Mean bout durations for sleep and wakefulness were determined for each pup and percentage of time awake was found by dividing the mean wake bout duration by the sum of the mean sleep and wake bout durations and multiplying by 100. A 2-factor analysis of variance (ANOVA) was used to test for differences across age and time of day, and planned comparisons (unpaired t-tests) served to reveal day-night differences within groups. Additionally, data were pooled for each pup in order to produce survivor distributions of sleep and wakefulness, as described elsewhere (Blumberg et al., 2005). For all tests, alpha was set at 0.05.
Fos-immunohistochemistry
Images of 40 μm brain sections were captured using a Leica DM/LS microscope and imaging system with Firecam software (Leica Microsystems, Germany). Images were imported into ImageJ (National Institutes of Health, http://imagej.nih.gov/ij/) and adjusted to binary values. Using methods similar to those described elsewhere (Todd et al., 2010), cells positive for Fos-ir were identified. Typically, cells were approximately 10 μm in diameter. For each subject, 2–3 sections (in Experiment 2) or 3–4 sections (in Experiment 4) containing the SCN and vSPVZ were selected for analysis. Using a counting box of known dimensions, profiles of Fos-positive cells were counted unilaterally by an experienced individual blind to experimental group. An Abercrombie correction was performed on the counts for each area within each section (Abercrombie, 1946). The mean number of Fos-positive cells per section was then calculated for each pup.
The SCN and vSPVZ were identified using a stereotaxic atlas of the rat brain (Paxinos and Watson, 1998), as well as previous publications describing these structures in adult grass rats and Norway rats (Gooley et al., 2003; Lu et al., 2001; Schwartz et al., 2004; 2009). Although cell bodies were not counterstained in Experiment 2, brain areas were determined on the basis of adjacent anatomical structures (e.g., third ventricle, optic chiasm). When needed, archival Nissl-stained sections from separate animals at similar ages were used to help delineate boundaries between areas. Corresponding Nissl-stained sections from the same animals were used to determine nuclei in Experiment 4. Data were imported into JMP 5.0 and paired or unpaired t-tests were used to reveal day-night differences within each brain area. Alpha was set at 0.05 and Bonferroni corrections were performed to correct for multiple comparisons.
RHT projections
For Experiment 3, unstained sections were analyzed for the presence or absence of CTB labeling in the SCN and vSPVZ using a Leica DM/LS fluorescent microscope and imaging system with Firecam software. Light intensity and contrast levels were held constant for all sections across all subjects. Using a 20x objective, images of consecutive fluorescent and corresponding Nissl-stained sections were collected and then imported into Adobe Photoshop CS3 (Adobe Systems Incorporated, San Jose, CA) to determine the locations of CTB labeling. To compare age differences in CTB labeling in the vSPVZ, 2 fluorescent sections were selected from each subject for further analysis. Images were scored by an individual blind to the age and species of each subject. Mean fluorescence intensity (MFI) in the red channel was quantified, contralateral to the injected eye, for each section using ImageJ software containing the RGB Measure plug-in (Bubier et al., 22007). MFI per section was then calculated for each subject. Data were imported into Statview 5.0 (SAS Institute, Cary, NC). ANOVA was used to test for differences across ages and species, and Fisher’s PLSD was used for post hoc comparisons. For all tests, alpha was set at 0.05.
PACAP and VIP immunohistochemisty
To measure presynaptic terminals in the vSPVZ in Experiment 5, images of two confocal layers, evenly spaced within each z-stack, were extracted using Leica LAS AF software and imported into ImageJ. Data were scored by an experimenter blind to the age and species of each subject. Red- and green-fluorescent presynaptic terminals were automatically counted using the Image J Puncta Analyzer plugin as described elsewhere (Ippolito and Eroglu, 2010). Mean values of PACAP and VIP terminals were calculated for each section and then means were calculated for each pup. Data were imported into Statview 5.0. ANOVA was used to test for differences across age within each species and planned comparisons (unpaired t-tests) were used to test developmental changes between P6/8 and P21. For all tests, alpha was set at 0.05.
Photomicrographs
Sizes of photomicrographs were adjusted and figure plates were prepared using Adobe Photoshop CS3. No other manipulations were made to representative images.
RESULTS
Development of circadian phase preference
We first compared the developmental trajectory of day-night behavioral differences in Norway rats and grass rats. Figure 1 presents log-survivor distributions for wake bouts and mean percentage of time awake (insets) in Norway rats and grass rats. The data for Norway rats have been published previously (Gall et al., 2008) and show that nocturnal wakefulness emerges between P8 and P15. Here, we recorded day-night differences in sleep and wakefulness in grass rats at P2, P6 (i.e., one day after eye opening), and P15. For mean percentage of time awake (insets in Fig. 1), ANOVA revealed significant main effects of age [F(2,30) = 21.3, P < 0.0001] and time [F(1,30) = 33.7, P < 0.0001], but not a significant age x time interaction [F(2,30) = 0.1]. Planned comparisons revealed that mean percentage of time awake was higher during the day in grass rats regardless of age (Ps < 0.05). For mean wake bout durations, ANOVA revealed significant main effects of age [F(2,30) = 20.8, P < 0.0001], time [F(1,30) = 20.7, P < 0.0001], and a significant age x time interaction [F(2,30) = 7.5, P < 0.002]. Planned comparisons revealed that mean wake bout durations were higher during the day regardless of age (Ps < 0.05).
Figure 1.

Log-survivor distributions of wake bouts (pooled across subjects; 2228–3325 points per plot) and mean percentage of time awake (insets; n = 6 per group) in Norway rats (left) and Nile grass rats (right). Recordings occurred during the day (red) and night (blue), at 3 postnatal ages. In Norway rats, nocturnal wakefulness emerged between P8 and P15; in grass rats, a dramatic increase in daytime wake bout durations occurred between P6 and P15. * significant difference from nighttime value, P < 0.05. ** significant difference from nighttime value, P < 0.005. Norway rat data are from a previous study (Gall et al., 2008). Note the different y-axis scales in the insets for the Norway rats and grass rats. Means + standard errors.
Although grass rats expressed diurnality at P2 and P6, the log-survivor plots in Figure 1 show that diurnal wakefulness increased most dramatically between P6 and P15. Planned comparisons revealed that, at P15, daytime wake bout durations and percentage of time awake during the day significantly increased compared to earlier ages (Ps < 0.01), while these values did not differ significantly between P2 and P6. Interestingly, day-night sleep bout durations did not change significantly over development; specifically, ANOVA did not reveal significant main effects of age [F(2,30) = 2.4] or time [F(1,30) = 4.1], or a significant age x time interaction [F(2,30) = 1.0] (data not shown).
In-phase and anti-phase patterns of hypothalamic activity develop between the first and second postnatal weeks
Given that circadian phase preferences, in both species, change significantly between the first and second postnatal weeks, we next asked whether the species-typical in-phase and anti-phase SCN-vSPVZ activity patterns emerge at this time as well. In Norway rats at both P8 and P15 (Fig. 2A, top), the mean number of Fos-positive cells in the SCN was greater during the day than during the night (P8: t(10) = 7.5, P ≤ 0.001; P15: t(10) = 5.8, P ≤ 0.002). In the vSPVZ at P8, Fos values did not differ between day and night (t(10) = 1.0), whereas higher values were found during the day at P15 (t(10) = 6.3, P ≤ 0.0001). In grass rats at both P6 and P15 (Fig. 2B, top), Fos values in the SCN were again greater during the day than during the night (P6: t(10) = 7.0, P ≤ 0.0005; P15: t(10) = 13.8, P ≤ 0.0001). In the vSPVZ at P6, Fos values did not differ between day and night (t(10) = 0.1), whereas higher values were now found during the night at P15 (t(10) = 9.7, P ≤ 0.0001). These patterns, at P15, of increased vSPVZ activity during periods of behavioral inactivity is typical of adults of these species (Schwartz et al., 2004).
Figure 2.

(A) Top: Mean number of Fos-positive cells per section in the suprachiasmatic nucleus (SCN) and ventral subparaventricular zone (vSPVZ) for P8 and P15 Norway rats. Bottom: Representative hypothalamic sections from P15 Norway rats depicting the in-phase Fos-ir activity profile in the SCN and vSPVZ. (B) Top: Mean number of Fos-positive cells per section in the SCN and vSPVZ for P6 and P15 Nile grass rats. Bottom: Representative hypothalamic sections from P15 grass rats depicting the anti-phase Fos-ir activity profile in the SCN and vSPVZ. Red bars represent rats sacrificed during the day and blue bars represent rats sacrificed at night. n=6 per group. * significant difference from nighttime group, P < 0.005. Means + standard errors. Scale bar: 100 μm.
Norway rats, but not grass rats, develop a robust direct projection from RHT to vSPVZ
In Norway rats, the RHT projects to the SCN as early as P1 (Hannibal and Fahrenkrug, 2004). Moreover, by adulthood, the RHT of Norway rats also projects directly to the vSPVZ (Gooley et al., 2003). Based on the Fos-ir data described above, we hypothesized that the direct RHT connection to the vSPVZ would develop between P8 and P15. We tested this hypothesis using CTB tracing in P8, P15, and P21 Norway rats (n = 4 at each age). At P8, as expected, CTB labeling was detected in the SCN but only sparse and inconsistent labeling was found in the vSPVZ (Fig. 3A–C). In contrast, at P15, strong labeling was found in both the SCN and the vSPVZ (Fig. 3D–F). Finally, one week later at P21, this vSPVZ labeling was not noticeably denser (Fig. 4A–B). As shown in Figure 5, mean fluorescence intensity (MFI) in the vSPVZ of Norway rats increased progressively between P8, P15, and P21. ANOVA revealed a significant main effect of age on MFI [F(2,9) = 7.8, P < 0.05].
Figure 3.

Fluorescent images from adjacent sections depicting CTB-labeled retinohypothalamic tract (RHT) projections to the suprachiasmatic nucleus (SCN) and ventral subparaventricular zone (vSPVZ) in representative P8 (A–C) and P15 (D–F) Norway rats and a representative P15 Nile grass rat (G–I). Sections are at the level of the rostral SCN (top), caudal SCN and rostral vSPVZ (middle), and caudal vSPVZ (bottom). Locations of landmarks, including the perimeter of the SCN (yellow dashed lines), were determined using corresponding Nissl-stained sections. Yellow arrows point to robust vSPVZ labeling in the P15 Norway rat. All images shown are contralateral to the injected eye. Sections are arranged, top to bottom, from rostral to caudal. 3V, third ventricle; ot, optic tract. Scale bar: 150 μm.
Figure 4.

Fluorescent images from adjacent sections depicting CTB-labeled retinohypothalamic tract (RHT) projections to the suprachiasmatic nucleus (SCN) and ventral subparaventricular zone (vSPVZ) in a representative P21 Norway rat (A–B) and a representative adult Nile grass rat (C–D). Sections are at the level of the caudal SCN and rostral vSPVZ (top) and caudal vSPVZ (bottom). Locations of landmarks, including the perimeter of the SCN (yellow dashed lines), were determined using corresponding Nissl-stained sections. Yellow arrow points to robust vSPVZ labeling in the P21 Norway rat. All images are contralateral to the injected eye. Sections are arranged, top to bottom, from rostral to caudal. 3V, third ventricle; ot, optic tract. Scale bar: 150 μm.
Figure 5.

Developmental differences in mean fluorescence intensity (MFI) per section in the ventral subparaventricular zone (vSPVZ) following retinal tracing in P8, P15, and P21 Norway rats (left) and P6, P15, and adult Nile grass rats (right). n=4 per group except for adult grass rats (n=3). * significant difference from two other groups, P < 0.05. Means + standard errors.
Based on the Fos-ir data described above, we again hypothesized that the RHT of grass rats does not project directly to the vSPVZ. We tested this hypothesis using CTB tracing in P6 and P15 infants (n = 4 at each age) and in 3 adults. As predicted, we found intense CTB labeling of the SCN at P6 and P15 but little or no such labeling in the vSPVZ at those ages (Fig. 3G–I). We similarly found little or no labeling in the vSPVZ of the 3 adult grass rats (Fig. 4C–D). As shown in Figure 5, MFI in the vSPVZ of grass rats was very low at P6 and did not increase significantly by P15 or adulthood [F(2,8) = 3.1]. Finally, to ensure that our tracing method was reliable in this species to structures beyond the SCN, we confirmed labeling around the supraoptic nucleus (SON) in all subjects.
Functional RHT connectivity mirrors anatomical findings in Norway rats
As a functional test of the anatomical results reported above, we measured the effects of 2 hours of light exposure during the dark period on the mean number of Fos-positive cells in the SCN and vSPVZ in P8 and P15 Norway rats (Fig. 6). As predicted, light exposure produced significant increases in Fos values in the SCN at P8 (t(10) = 6.4, P ≤ 0.0001) and P15 (t(10) = 4.0, P ≤ 0.005). Also as predicted, light exposure did not produce a significant increase in Fos values in the vSPVZ at P8 (t(10) = 1.1) but did at P15 (t(10) = 4.1, P ≤ 0.005).
Figure 6.

Effect of 2 hours of light exposure during the dark period on mean number of Fos-positive cells per section in the suprachiasmatic nucleus (SCN) and ventral subparaventricular zone (vSPVZ) of P8 and P15 Norway rats (n=6 per group). Black bars represent control subjects maintained in the dark and hatched bars represent experimental subjects exposed to light. * significant difference from control group, P < 0.005. Means + standard errors.
Development of PACAP and VIP presynaptic terminals in the vSPVZ
We examined presynaptic terminal markers in the vSPVZ across development in Norway rats and grass rats. As shown in Figure 7, the mean number of PACAP-expressing terminals in the vSPVZ of Norway rats increased progressively from P8 to P21. ANOVA revealed a significant main effect of age [F(3,20) = 6.7, P < 0.005]. In grass rats, the mean number of PACAP-expressing terminals in the vSPVZ was very low at P6 but, in contrast with Norway rats, did not increase significantly with age [F(3,20) = 1.4]. Planned comparisons revealed that the number of PACAP-expressing terminals in the vSPVZ increased significantly from P6/8 to P21 in Norway rats (t(10) = 4.3, P ≤ 0.01), but not grass rats (t(10) = 0.3). Representative images of PACAP-expressing terminals in a P21 Norway rat and grass rat are shown in Figure 8.
Figure 7.

Developmental differences in the mean number of presynaptic terminals in the ventral subparaventricular zone (vSPVZ) in P8, P11, P15, and P21 Norway rats (left) and P6, P11, P15, and P21 Nile grass rats (right). n=6 per group. Black bars represent terminals expressing pituitary adenylate cyclase-activating peptide (PACAP) and hatched bars represent terminals expressing vasoactive intestinal peptide (VIP). * significant difference from P6/8, P < 0.05. Means + standard errors.
Figure 8.
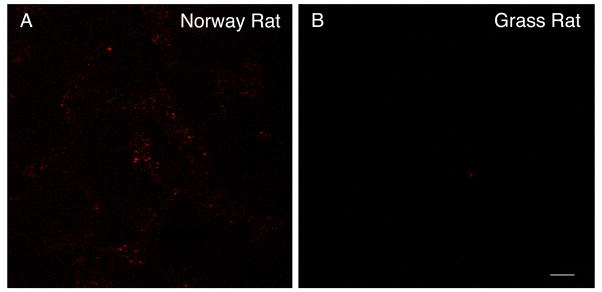
Representative fluorescent images of presynaptic terminals expressing pituitary adenylate cyclase-activating peptide (PACAP) in the ventral subparaventricular zone (vSPVZ) of a P21 Norway rat (A) and a P21 grass rat (B). Scale bar: 5 μm.
As also shown in Figure 7, the mean number of VIP-expressing terminals in the vSPVZ in Norway rats increased between P8 and P21. ANOVA revealed a significant main effect of age [F(3,20) = 6.2, P < 0.005]. In grass rats, the mean number of VIP-expressing terminals in the vSPVZ also increased between P6 and P21; however, ANOVA did not reveal a significant main effect of age [F(3,20) = 2.7, P = 0.07]. Planned comparisons revealed that, for both species, VIP-expressing terminals in the vSPVZ increased significantly from P6/8 to P21 (ts(10) ≥ 3.1, P ≤ 0.05).
Discussion
We have shown here how developmental processes can differentially shape the brain and behavior to alter circadian phase preference in Norway rats and Nile grass rats, two closely related Murid rodents (Campi et al., 2011). First, nocturnal Norway rats and diurnal grass rats undergo profound developmental changes in circadian wake behavior between the first and second postnatal weeks. Second, these behavioral changes are associated with the emergence of an in-phase pattern of SCN and vSPVZ activity in Norway rats and an anti-phase pattern in grass rats. Third, Norway rats develop an abundance of RHT projections to the vSPVZ between P8 and P15, whereas grass rats do not. Fourth, in support of our anatomical evidence, 2 hours of light stimulation during the dark period in Norway rats activates the vSPVZ at P15 but not P8. Finally, Norway rats, but not grass rats, exhibit significant increases in PACAP-expressing presynaptic terminals in the vSPVZ during the second postnatal week, thereby providing additional evidence of species-differences in RHT connectivity. This converging evidence across 5 experiments suggests that the developmental pattern and timing of retinal projections to the hypothalamus contribute to the development of circadian phase preference in these two species.
Multiple lines of evidence support the vSPVZ as a fundamental component of the neural circuitry contributing to circadian phase preference. In adult Norway rats and grass rats, lesions of the vSPVZ selectively disrupt circadian rhythms of sleep and wake behavior (Lu et al., 2001; Schwartz et al., 2009). Also, the vSPVZ receives the majority of the SCN’s output and projects to the same downstream structures as the SCN, making it an ideal structure for mediating and modulating circadian information (Schwartz et al., 2011; Smale et al., 2003). Finally, as mentioned previously, adult Norway rats and grass rats also express in-phase and anti-phase profiles of SCN-vSPVZ activity, respectively (Nunez et al., 1999; Schwartz et al., 2004), which we show here to be first expressed contemporaneously with developmental changes in circadian wakefulness.
Interestingly, it has been reported in adult mice that the SCN and subparaventricular zone (SPVZ) exhibit an anti-phase pattern of multiunit activity (Nakamura et al., 2011; Nakamura et al., 2008). Given that mice are nocturnal, this pattern of activity is opposite to what we would predict based on the present findings and those of others using Norway rats (Nunez et al., 1999; Schwartz et al., 2004). However, in the one Nakamura et al. paper where recording sites were indicated (Nakamura et al., 2008; supplemental data), some sites appear to be dorsal and rostral to the vSPVZ and none was confirmed as being within areas targeted by the RHT. This distinction may be important because the SPVZ is a heterogeneous structure with dorsal and ventral subregions that make separable contributions to locomotion, sleep, and thermoregulation (Lu et al., 2001).
Our understanding of the neurotransmitters involved in the RHT-SCN-vSPVZ circuit comes largely from work in adults. In Norway rats, the axon terminals of RHT projections co-store glutamate and PACAP, which have excitatory postsynaptic effects (Hannibal, 2002a). In contrast, the major projection from the SCN to the vSPVZ in Norway rats is composed of axon terminals that co-store γ-aminobutyric acid (GABA) and VIP and has been shown to have primarily inhibitory postsynaptic effects (Hermes et al., 2009). In adult grass rats, the vSPVZ also receives GABAergic and VIPergic projections from the SCN (Mahoney et al., 2007); because there is only a sparse RHT projection to the vSPVZ in this species (Smale and Boverhof, 1999), we expected PACAP-expressing terminals in this region to be sparse as well, which is what we found (Fig. 8B).
Figure 9 presents a model, based on our results, of the developmental and species differences in the neural circuitry underlying circadian phase preference in Norway rats and grass rats. According to this model, the vSPVZ of Norway rats does not display day-night differences in neural activity at P8, and receives little or no input from the retina or SCN at this age. By P15, however, the direct excitatory RHT projection to the vSPVZ has developed, as has the inhibitory projection arriving from the SCN. To produce the in-phase activity pattern in the vSPVZ, we surmise that the excitation provided by the direct RHT projection must exceed the inhibition provided by the SCN-vSPVZ connection. To better understand the relative contributions of the retinal and SCN connections to the vSPVZ, we would ideally want to selectively disable these connections to observe their effects on hypothalamic activity. However, such selective manipulations are not currently feasible.
Figure 9.

Proposed model, based on the present experiments, of developmental and species differences in neural connections among retina, suprachiasmatic nucleus (SCN), and ventral subparaventricular zone (vSPVZ). Green lines denote presumed excitatory connections releasing glutamate (GLU) and pituitary adenylate cyclase (PACAP) and red lines denote presumed inhibitory connections releasing γ-aminobutyric acid (GABA) and vasoactive intestinal peptide (VIP). Dashed lines denote developing or relatively weak connections.
As also depicted in Figure 9, grass rats possess an excitatory RHT projection to the SCN, but they do not develop the robust RHT projection to the vSPVZ exhibited by Norway rats. At P6, the vSPVZ does not display day-night differences in neural activity, presumably due to the relative lack of input from the SCN. By P15, however, the anti-phase pattern of SCN-vSPVZ activity develops and is associated with an increase in inhibitory projections to the vSPVZ.
For our functional test of RHT connectivity in Norway rats, we used Fos immunohistochemistry to measure neuronal activity changes in the SCN and vSPVZ in response to 2 hrs of light stimulation during the dark period. As predicted, whereas P8 subjects exhibited increased activity only in the SCN, P15 subjects exhibited increased activity in both the SCN and vSPVZ. Although Fos immunohistochemistry is suited to detecting increases in neuronal activity, it is not suited to detecting short-term decreases because, once the Fos protein is produced, it takes several hours to degrade (Cirelli and Tononi, 2000). Nonetheless, for completeness and despite the likelihood of ambiguous results, we repeated the light-exposure test in a small group of grass rats at P15 (data not shown). As was found with Norway rats, 2 hrs of light exposure during the dark period significantly increased Fos-positive cells in the SCN; however, in contrast with Norway rats, Fos activity in the vSPVZ of control subjects was already very high (due to the anti-phase SCN-vSPVZ relationship in this species) and light exposure neither increased nor decreased this activity. A failure to detect an increase in vSPVZ activity could have been due to a ceiling effect. But we believe it is more likely that the failure to detect a decrease in vSPVZ activity resulted from insensitivity of the c-fos method for detecting short-term functional inhibition. It should also be noted that the converse experiment—turning off the lights during the light period—would not resolve these interpretational difficulties. Direct measures of neurophysiological activity would be better able to detect the anti-phase relationship in grass rats.
The vSPVZ exhibited strikingly higher Fos-ir levels in grass rats at P6 than in Norway rats at P8 (Fig. 2). There are several possible causes of this species difference. One possibility is that vSPVZ neurons are more spontaneously active in grass rats than in Norway rats. Another possibility is that the vSPVZ in grass rats is activated by input from another neural structure. Whatever the cause, species differences in vSPVZ activity may provide a mechanism for effecting species differences in RHT connectivity. For example, the action of ephrins, which repel developing axons, is modulated by activity-dependent processes (Klein, 2009).
To our knowledge, it has not previously been hypothesized that RHT connectivity to the vSPVZ helps determine circadian phase preference. Keeping in mind the need for caution when comparing data from multiple laboratories using different techniques, published reports suggest that this hypothesis applies to a variety of other species. As shown in Table 2, nocturnal species including hamsters (Morin et al., 2003; Speh and Moore, 1993), mink (Peytevin et al., 1997), mice (Cassone et al., 1988; Hattar et al., 2006), and opossums (Cassone et al., 1988) possess robust RHT projections extending beyond the SCN to the vSPVZ. In contrast to nocturnal species and in addition to grass rats, RHT afferents do not significantly extend beyond the boundary of the SCN in such diurnal species as humans (Dai et al., 1998), Cebus monkeys (Pinato et al., 2009), ground squirrels (Smale et al., 1991), and four-striped field mice (Schumann et al., 2006).
Table 2.
Relations among life-history variables and retinohypothamic tract (RHT) projections to the ventral subparaventricular zone (vSPVZ) in mammals. Displayed are species name, circadian phase preference, RHT-to-vSPVZ projections, and whether the species can be classified as altricial or precocial at birth. The last column indicates, for those few species where data are available, whether the RHT-to-vSPVZ connection develops prenatally or postnatally.
| Species | Circadian phase preference | RHT→vSPVZ connection? | Altricial/Precocial | RHT→vSPVZ development |
|---|---|---|---|---|
| Norway rat (R. norvegicus) | nocturnal | yes1,2 | altricial | postnatal |
| Hamster (M. auratus) | nocturnal | yes2,3 | altricial | postnatal |
| Mink (M. vison) | nocturnal | yes4 | altricial | postnatal |
| Mouse (M. musculus) | nocturnal | yes5,6 | altricial | ? |
| Opossums (D. virginiana, M. domestica) | nocturnal | yes5 | altricial | ? |
| Nile grass rat (A. niloticus) | diurnal | no | intermediate | n/a |
| Human (H. sapien) | diurnal | no7 | intermediate | n/a |
| Cebus monkey (C. apella) | diurnal | no8 | intermediate | n/a |
| Ground squirrel (S. lateralis) | diurnal | no9 | altricial | n/a |
| Four-striped grass mouse (R. pumilio) | diurnal | no10 | intermediate | n/a |
| Sheep (O. aries) | diurnal | yes11 | precocial | prenatal |
| Degu (O. degus) | diurnal | yes12 | precocial | ? |
| Guinea pig (C. porcellus) | unclear13,14,15 | no5 | precocial | n/a |
| Cat (F. cattus) | unclear16,17,18 | no5 | altricial | n/a |
Superscripts indicate relevant citations, which are listed at the bottom of the table. ?, not known; n/a, not applicable.
Table 2 also shows two notable exceptions to the above pattern. Specifically, both sheep (Torrealba et al., 1993) and degus (Goel et al., 1999) are diurnal but exhibit robust RHT projections extending dorsally and caudally outside the SCN. Interestingly, these two species are precocial in relation to all of the nocturnal species discussed above. Interestingly, this direct projection develops prenatally in sheep (Torrealba et al., 1993), whereas it develops postnatally in rats (Speh and Moore, 1993), hamsters (Speh and Moore, 1993), and mink (Peytevin et al., 1997). Thus, we hypothesize further that, for animals that develop the direct retina-to-vSPVZ connection, the precise timing of innervation may influence its subsequent effect on circadian phase preference. Although there are many behavioral and physiological factors that differ across the altricial-precocial spectrum that could potentially alter SCN function and connectivity, exposure to light may not be a critical factor since dark rearing of Norway rats has little or no effect on the development of RHT connectivity or circadian phase preference (Prichard et al., 2007; Prichard et al., 2004).
Finally, Table 2 indicates that RHT projections in guinea pigs and domestic cats are confined to the SCN (Cassone et al., 1988). However, substantial disagreement exists as to the circadian phase preferences of these two species (Akita et al., 2001; Bowersox et al., 1984; Jilge, 1985; Kuwabara et al., 1986; Tobler et al., 1993; Tobler and Scherschlicht, 1990).
Overall, our findings suggest that species-typical circadian phase preferences emerge through a developmental rewiring of the RHT to effect differential interactions among the retina, SCN, and vSPVZ. It bears noting that the mechanism identified here may be one of several; in other words, there may be multiple developmental paths to nocturnality and diurnality. Whatever the mechanism, once the system is established, most individuals will exhibit a species-typical bias toward one or the other (although it should be noted that this bias does not prevent individuals from shifting to the opposing temporal niche under certain ecological conditions; (Mrosovsky and Hattar, 2005). All together, the present results indicate that a fuller understanding of the mechanisms underlying nocturnality and diurnality will require delineation, in a variety of species, of the developmental relations among RHT connectivity, hypothalamic activity, and behavior.
Acknowledgments
We thank Laura Smale for generously providing adult Nile grass rats for breeding and for helpful comments on an early draft of the manuscript. We also thank Ralph Johnson, Jason Radley, and Shelley Plattner for valuable technical guidance and Jens Hannibal for providing the PACAP antibody.
LITERATURE CITED
- Abercrombie M. Estimation of nuclear population from microtome sections. Anat Rec. 1946;94:239–247. doi: 10.1002/ar.1090940210. [DOI] [PubMed] [Google Scholar]
- Akita M, Ishii K, Kuwahara M, Tsubone H. The daily pattern of heart rate, body temperature, and locomotor activity in guinea pigs. Exp Anim. 2001;50(5):409–415. doi: 10.1538/expanim.50.409. [DOI] [PubMed] [Google Scholar]
- Allen GC, Earnest DJ. Overlap in the distribution of TrkB immunoreactivity and retinohypothalamic tract innervation of the rat suprachiasmatic nucleus. Neurosci Lett. 2005;376(3):200–204. doi: 10.1016/j.neulet.2004.11.076. [DOI] [PubMed] [Google Scholar]
- Belenky MA, Yarom Y, Pickard GE. Heterogeneous expression of gamma-aminobutyric acid and gamma-aminobutyric acid-associated receptors and transporters in the rat suprachiasmatic nucleus. J Comp Neurol. 2008;506(4):708–732. doi: 10.1002/cne.21553. [DOI] [PubMed] [Google Scholar]
- Blanchong JA, McElhinny TL, Mahoney MM, Smale L. Nocturnal and diurnal rhythms in the unstriped Nile rat, Arvicanthis niloticus. J Biol Rhythms. 1999;14(5):364–377. doi: 10.1177/074873099129000777. [DOI] [PubMed] [Google Scholar]
- Blumberg MS. The developmental context of thermal homeostasis. In: Blass EM, editor. Handbook of Behavioral Neurobiology. New York: Plenum Press; 2001. pp. 199–228. [Google Scholar]
- Blumberg MS, Seelke AM, Lowen SB, Karlsson KA. Dynamics of sleep-wake cyclicity in developing rats. Proc Natl Acad Sci U S A. 2005;102(41):14860–14864. doi: 10.1073/pnas.0506340102. [DOI] [PMC free article] [PubMed] [Google Scholar]
- Blumberg MS, Seelke AMH. The form and function of infant sleep: From muscle to neocortex. In: Blumberg MS, Freeman JH, Robinson SR, editors. The Oxford Handbook of Develeopmetal Behavioral Neuroscience. New York: Oxford University Press; 2010. pp. 391–423. [Google Scholar]
- Bowersox SS, Baker TL, Dement WC. Sleep-wakefulness patterns in the aged cat. Electroencephalogr Clin Neurophysiol. 1984;58(3):240–252. doi: 10.1016/0013-4694(84)90110-x. [DOI] [PubMed] [Google Scholar]
- Bubier JA, Bennett SM, Sproule TJ, Lyons BL, Olland S, Young DA, Roopenian DC. Treatment of BXSB-Yaa mice with IL-21R-Fc fusion protein minimally attenuates systemic lupus erythematosus. Ann N Y Acad Sci. 2007;1110:590–601. doi: 10.1196/annals.1423.063. [DOI] [PubMed] [Google Scholar]
- Campi KL, Collins CE, Todd WD, Kaas J, Krubitzer L. Comparison of area 17 cellular composition in laboratory and wild-caught rats including diurnal and nocturnal species. Brain Behav Evol. 2011;77(2):116–130. doi: 10.1159/000324862. [DOI] [PMC free article] [PubMed] [Google Scholar]
- Cassone VM, Speh JC, Card JP, Moore RY. Comparative anatomy of the mammalian hypothalamic suprachiasmatic nucleus. J Biol Rhythms. 1988;3(1):71–91. doi: 10.1177/074873048800300106. [DOI] [PubMed] [Google Scholar]
- Challet E. Minireview: Entrainment of the suprachiasmatic clockwork in diurnal and nocturnal mammals. Endocrinol. 2007;148(12):5648–5655. doi: 10.1210/en.2007-0804. [DOI] [PubMed] [Google Scholar]
- Cirelli C, Tononi G. On the functional significance of c-fos induction during the sleep-waking cycle. Sleep. 2000;23(4):453–469. [PubMed] [Google Scholar]
- Crompton AW, Taylor CR, Jagger JA. Evolution of homeothermy in mammals. Nature. 1978;272(5651):333–336. doi: 10.1038/272333a0. [DOI] [PubMed] [Google Scholar]
- Dai J, Van der Vliet J, Swaab DF, Buijs RM. Human retinohypothalamic tract as revealed by in vitro postmortem tracing. J Comp Neurol. 1998;397(3):357–370. [PubMed] [Google Scholar]
- Fuller PM, Gooley JJ, Saper CB. Neurobiology of the sleep-wake cycle: sleep architecture, circadian regulation, and regulatory feedback. J Biol Rhythms. 2006;21(6):482–493. doi: 10.1177/0748730406294627. [DOI] [PubMed] [Google Scholar]
- Gaillard F, Bonfield S, Gilmour GS, Kuny S, Mema SC, Martin BT, Smale L, Crowder N, Stell WK, Sauve Y. Retinal anatomy and visual performance in a diurnal cone-rich laboratory rodent, the Nile grass rat (Arvicanthis niloticus) J Comp Neurol. 2008;510(5):525–538. doi: 10.1002/cne.21798. [DOI] [PubMed] [Google Scholar]
- Gall AJ, Todd WD, Ray B, Coleman CM, Blumberg MS. The development of day-night differences in sleep and wakefulness in Norway rats and the effect of bilateral enucleation. J Biol Rhythms. 2008;23(3):232–241. doi: 10.1177/0748730408316954. [DOI] [PMC free article] [PubMed] [Google Scholar]
- Goel N, Lee TM, Smale L. Suprachiasmatic nucleus and intergeniculate leaflet in the diurnal rodent Octodon degus: retinal projections and immunocytochemical characterization. Neurosci. 1999;92(4):1491–1509. doi: 10.1016/s0306-4522(99)00056-1. [DOI] [PubMed] [Google Scholar]
- Gooley JJ, Lu J, Fischer D, Saper CB. A broad role for melanopsin in nonvisual photoreception. J Neurosci. 2003;23(18):7093–7106. doi: 10.1523/JNEUROSCI.23-18-07093.2003. [DOI] [PMC free article] [PubMed] [Google Scholar]
- Gramsbergen A. The development of the EEG in the rat. Dev Psychobiol. 1976;9:501–515. doi: 10.1002/dev.420090604. [DOI] [PubMed] [Google Scholar]
- Hannibal J. Neurotransmitters of the retino-hypothalamic tract. Cell Tissue Res. 2002a;309(1):73–88. doi: 10.1007/s00441-002-0574-3. [DOI] [PubMed] [Google Scholar]
- Hannibal J. Pituitary adenylate cyclase-activating peptide in the rat central nervous system: an immunohistochemical and in situ hybridization study. J Comp Neurol. 2002b;453(4):389–417. doi: 10.1002/cne.10418. [DOI] [PubMed] [Google Scholar]
- Hannibal J, Ding JM, Chen D, Fahrenkrug J, Larsen PJ, Gillette MU, Mikkelsen JD. Pituitary adenylate cyclase-activating peptide (PACAP) in the retinohypothalamic tract: a potential daytime regulator of the biological clock. J Neurosci. 1997;17(7):2637–2644. doi: 10.1523/JNEUROSCI.17-07-02637.1997. [DOI] [PMC free article] [PubMed] [Google Scholar]
- Hannibal J, Fahrenkrug J. Melanopsin containing retinal ganglion cells are light responsive from birth. Neuroreport. 2004;15(15):2317–2320. doi: 10.1097/00001756-200410250-00003. [DOI] [PubMed] [Google Scholar]
- Hannibal J, Mikkelsen JD, Clausen H, Holst JJ, Wulff BS, Fahrenkrug J. Gene expression of pituitary adenylate cyclase activating polypeptide (PACAP) in the rat hypothalamus. Regul Pept. 1995;55(2):133–148. doi: 10.1016/0167-0115(94)00099-j. [DOI] [PubMed] [Google Scholar]
- Hannibal J, Moller M, Ottersen OP, Fahrenkrug J. PACAP and glutamate are co-stored in the retinohypothalamic tract. J Comp Neurol. 2000;418(2):147–155. [PubMed] [Google Scholar]
- Hattar S, Kumar M, Park A, Tong P, Tung J, Yau KW, Berson DM. Central projections of melanopsin-expressing retinal ganglion cells in the mouse. J Comp Neurol. 2006;497(3):326–349. doi: 10.1002/cne.20970. [DOI] [PMC free article] [PubMed] [Google Scholar]
- Hermes ML, Kolaj M, Doroshenko P, Coderre E, Renaud LP. Effects of VPAC2 receptor activation on membrane excitability and GABAergic transmission in subparaventricular zone neurons targeted by suprachiasmatic nucleus. J Neurophysiol. 2009;102(3):1834–1842. doi: 10.1152/jn.91261.2008. [DOI] [PubMed] [Google Scholar]
- Houben T, Deboer T, van Oosterhout F, Meijer JH. Correlation with behavioral activity and rest implies circadian regulation by SCN neuronal activity levels. J Biol Rhythms. 2009;24(6):477–487. doi: 10.1177/0748730409349895. [DOI] [PubMed] [Google Scholar]
- Ippolito DM, Eroglu C. Quantifying synapses: an immunocytochemistry-based assay to quantify synapse number. Journal of visualized experiments: JoVE. 2010;(45) doi: 10.3791/2270. [DOI] [PMC free article] [PubMed] [Google Scholar]
- Jilge B. The rhythm of food and water ingestion, faeces excretion and locomotor activity in the guinea pig. Z Versuchstierkd. 1985;27(5):215–225. [PubMed] [Google Scholar]
- Karlsson KÆ, Gall AJ, Mohns EJ, Seelke AMH, Blumberg MS. The neural substrates of infant sleep in rats. PLoS Biol. 2005;3:891–901. doi: 10.1371/journal.pbio.0030143. [DOI] [PMC free article] [PubMed] [Google Scholar]
- Klein R. Bidirectional modulation of synaptic functions by Eph/ephrin signaling. Nat Neurosci. 2009;12(1):15–20. doi: 10.1038/nn.2231. [DOI] [PubMed] [Google Scholar]
- Kuwabara N, Seki K, Aoki K. Circadian, sleep and brain temperature rhythms in cats under sustained daily light-dark cycles and constant darkness. Physiol Behav. 1986;38(2):283–289. doi: 10.1016/0031-9384(86)90164-2. [DOI] [PubMed] [Google Scholar]
- Lu J, Zhang YH, Chou TC, Gaus SE, Elmquist JK, Shiromani P, Saper CB. Contrasting effects of ibotenate lesions of the paraventricular nucleus and subparaventricular zone on sleep-wake cycle and temperature regulation. J Neurosci. 2001;21(13):4864–4874. doi: 10.1523/JNEUROSCI.21-13-04864.2001. [DOI] [PMC free article] [PubMed] [Google Scholar]
- Mahoney MM, Ramanathan C, Smale L. Tyrosine hydroxylase positive neurons and their contacts with vasoactive intestinal polypeptide-containing fibers in the hypothalamus of the diurnal murid rodent, Arvicanthis niloticus. J Chem Neuroanat. 2007;33(3):131–139. doi: 10.1016/j.jchemneu.2007.02.001. [DOI] [PubMed] [Google Scholar]
- Menaker M, Moreira LF, Tosini G. Evolution of circadian organization in vertebrates. Braz J Med and Biol Res. 1997;30(3):305–313. doi: 10.1590/s0100-879x1997000300003. [DOI] [PubMed] [Google Scholar]
- Morin LP, Blanchard JH, Provencio I. Retinal ganglion cell projections to the hamster suprachiasmatic nucleus, intergeniculate leaflet, and visual midbrain: bifurcation and melanopsin immunoreactivity. J Comp Neurol. 2003;465(3):401–416. doi: 10.1002/cne.10881. [DOI] [PubMed] [Google Scholar]
- Mrosovsky N, Hattar S. Diurnal mice (Mus musculus) and other examples of temporal niche switching. J Comp Physiol A Neuroethol Sens Neural Behav Physiol. 2005;191(11):1011–1024. doi: 10.1007/s00359-005-0017-1. [DOI] [PubMed] [Google Scholar]
- Nakamura TJ, Nakamura W, Yamazaki S, Kudo T, Cutler T, Colwell CS, Block GD. Age-related decline in circadian output. J Neurosci. 2011;31(28):10201–10205. doi: 10.1523/JNEUROSCI.0451-11.2011. [DOI] [PMC free article] [PubMed] [Google Scholar]
- Nakamura W, Yamazaki S, Nakamura TJ, Shirakawa T, Block GD, Takumi T. In vivo monitoring of circadian timing in freely moving mice. Curr Biol. 2008;18(5):381–385. doi: 10.1016/j.cub.2008.02.024. [DOI] [PubMed] [Google Scholar]
- Nunez AA, Bult A, McElhinny TL, Smale L. Daily rhythms of Fos expression in hypothalamic targets of the suprachiasmatic nucleus in diurnal and nocturnal rodents. J Biol Rhythms. 1999;14(4):300–306. doi: 10.1177/074873099129000713. [DOI] [PubMed] [Google Scholar]
- Park O. Nocturnalism: The development of a problem. Ecol Monogr. 1940;10:485–536. [Google Scholar]
- Paxinos G, Watson C. The rat brain in stereotaxic coordinates. San Diego, CA: Academic Press; 1998. [Google Scholar]
- Peytevin J, Masson-Pevet M, Martinet L. Ontogenesis of the retinohypothalamic tract, vasoactive intestinal polypeptide- and peptide histidine isoleucine-containing neurons and melatonin binding in the hypothalamus of the mink. Cell Tissue Res. 1997;289(3):427–437. doi: 10.1007/s004410050888. [DOI] [PubMed] [Google Scholar]
- Pinato L, Frazao R, Cruz-Rizzolo RJ, Cavalcante JS, Nogueira MI. Immunocytochemical characterization of the pregeniculate nucleus and distribution of retinal and neuropeptide Y terminals in the suprachiasmatic nucleus of the Cebus monkey. J Chem Neuroanat. 2009;37(4):207–213. doi: 10.1016/j.jchemneu.2009.01.005. [DOI] [PubMed] [Google Scholar]
- Prichard JR, Armacanqui HS, Benca RM, Behan M. Light-dependent retinal innervation of the rat superior colliculus. Anat Rec. 2007;290(3):341–348. doi: 10.1002/ar.20424. [DOI] [PubMed] [Google Scholar]
- Prichard JR, Fahy JL, Obermeyer WH, Behan M, Benca RM. Sleep responses to light and dark are shaped by early experience. Behav Neurosci. 2004;118(6):1262–1273. doi: 10.1037/0735-7044.118.6.1262. [DOI] [PubMed] [Google Scholar]
- Schumann DM, Cooper HM, Hofmeyr MD, Bennett NC. Light-induced Fos expression in the suprachiasmatic nucleus of the four-striped field mouse, Rhabdomys pumilio: A southern African diurnal rodent. Brain Res Bull. 2006;70(4–6):270–277. doi: 10.1016/j.brainresbull.2006.04.009. [DOI] [PubMed] [Google Scholar]
- Schwartz MD, Nunez AA, Smale L. Differences in the suprachiasmatic nucleus and lower subparaventricular zone of diurnal and nocturnal rodents. Neurosci. 2004;127(1):13–23. doi: 10.1016/j.neuroscience.2004.04.049. [DOI] [PubMed] [Google Scholar]
- Schwartz MD, Nunez AA, Smale L. Rhythmic cFos expression in the ventral subparaventricular zone influences general activity rhythms in the Nile grass rat, Arvicanthis niloticus. Chronobiol Int. 2009;26(7):1290–1306. doi: 10.3109/07420520903415742. [DOI] [PubMed] [Google Scholar]
- Schwartz MD, Urbanski HF, Nunez AA, Smale L. Projections of the suprachiasmatic nucleus and ventral subparaventricular zone in the Nile grass rat (Arvicanthis niloticus) Brain Res. 2011;1367:146–161. doi: 10.1016/j.brainres.2010.10.058. [DOI] [PMC free article] [PubMed] [Google Scholar]
- Seelke AM, Blumberg MS. The microstructure of active and quiet sleep as cortical delta activity emerges in infant rats. Sleep. 2008;31(5):691–699. doi: 10.1093/sleep/31.5.691. [DOI] [PMC free article] [PubMed] [Google Scholar]
- Smale L, Blanchard J, Moore RY, Morin LP. Immunocytochemical characterization of the suprachiasmatic nucleus and the intergeniculate leaflet in the diurnal ground squirrel, Spermophilus lateralis. Brain Res. 1991;563(1–2):77–86. doi: 10.1016/0006-8993(91)91517-5. [DOI] [PubMed] [Google Scholar]
- Smale L, Boverhof J. The suprachiasmatic nucleus and intergeniculate leaflet of Arvicanthis niloticus, a diurnal murid rodent from East Africa. J Comp Neurol. 1999;403(2):190–208. doi: 10.1002/(sici)1096-9861(19990111)403:2<190::aid-cne4>3.0.co;2-k. [DOI] [PubMed] [Google Scholar]
- Smale L, Lee T, Nunez AA. Mammalian diurnality: some facts and gaps. J Biol Rhythms. 2003;18(5):356–366. doi: 10.1177/0748730403256651. [DOI] [PubMed] [Google Scholar]
- Speh JC, Moore RY. Retinohypothalamic tract development in the hamster and rat. Brain Res Dev Brain Res. 1993;76(2):171–181. doi: 10.1016/0165-3806(93)90205-o. [DOI] [PubMed] [Google Scholar]
- Spiers DE, Adair ER. Ontogeny of homeothermy in the immature rat: Metabolic and thermal responses. J Appl Physiol. 1986;60:1190–1197. doi: 10.1152/jappl.1986.60.4.1190. [DOI] [PubMed] [Google Scholar]
- Tobler I, Franken P, Jaggi K. Vigilance states, EEG spectra, and cortical temperature in the guinea pig. American J Physiol. 1993;264(6 Pt 2):R1125–1132. doi: 10.1152/ajpregu.1993.264.6.R1125. [DOI] [PubMed] [Google Scholar]
- Tobler I, Scherschlicht R. Sleep and EEG slow-wave activity in the domestic cat: effect of sleep deprivation. Behav Brain Res. 1990;37(2):109–118. doi: 10.1016/0166-4328(90)90086-t. [DOI] [PubMed] [Google Scholar]
- Todd WD, Gibson JL, Shaw CS, Blumberg MS. Brainstem and hypothalamic regulation of sleep pressure and rebound in newborn rats. Behav Neurosci. 2010;124(1):69–78. doi: 10.1037/a0018100. [DOI] [PMC free article] [PubMed] [Google Scholar]
- Torrealba F, Parraguez VH, Reyes T, Valenzuela G, Seron-Ferre M. Prenatal development of the retinohypothalamic pathway and the suprachiasmatic nucleus in the sheep. J Comp Neurol. 1993;338(2):304–316. doi: 10.1002/cne.903380212. [DOI] [PubMed] [Google Scholar]
- Vida B, Deli L, Hrabovszky E, Kalamatianos T, Caraty A, Coen CW, Liposits Z, Kallo I. Evidence for suprachiasmatic vasopressin neurones innervating kisspeptin neurones in the rostral periventricular area of the mouse brain: regulation by oestrogen. J Neuroendocrinol. 2010;22(9):1032–1039. doi: 10.1111/j.1365-2826.2010.02045.x. [DOI] [PubMed] [Google Scholar]