

Abstract
Background
Ethanol affects prefrontal cortex functional roles such as decision making, working memory, and behavioral control. Yet, the pharmacological effect of ethanol on dopamine, a neuromodulator in the medial prefrontal cortex, is unclear. Past studies exploring this topic produced conflicting outcomes; however, a handful of factors (temporal resolution, method of drug administration, estrous cycle) possibly contributed to these discrepancies. We sought to mitigate these factors in order to elucidate ethanol’s pharmacological effects on medial prefrontal cortical dopamine in Long-Evans rats.
Methods
We administered experimental solutions via an intravenous, handling-free route, monitored dopamine in the medial prefrontal cortex via microdialysis (10-minute samples), and used male rats to avoid estrous cycle/ethanol interactions. First, we rapidly (~2.7 ml/min) or slowly (~0.6 ml/min) administered 1.0 g/kg ethanol and saline infusions, showing that the experimental methods did not contribute to dopamine changes. Then a cumulative dosing protocol was used to administer 0.25, 0.75, 1.50, and 2.25 g/kg intravenous ethanol doses to evaluate dose-response. Finally, we monitored dialysate ethanol levels during an oral ethanol self-administration session to compare the dialysate ethanol levels achieved during the pharmacological experiments to those seen during self-administration.
Results
Intravenous administration of a rapid or slow 1.0 g/kg ethanol infusion resulted in similar significant 55 ± 9% and 63 ± 15% peak dialysate dopamine increases, respectively. The 0.25, 0.75, 1.50, and 2.25 g/kg ethanol doses produced a non-significant 17 ± 5% and significant 36 ± 15%, 68 ± 19%, and 86 ± 20 % peak dialysate dopamine increases, respectively. Self-administration dialysate ethanol concentrations fell within the range of concentrations noted during the ethanol dose-response curve.
Conclusions
These experiments show that, using experimental methods which minimize possibly confounding factors, acute intravenous ethanol increases extracellular dopamine in the medial prefrontal cortex in a dose-dependent manner, thereby clarifying ethanol’s pharmacological effects on the mesocortical-dopamine system.
Keywords: medial prefrontal cortex, microdialysis, ethanol, rat, dopamine
Introduction
Human studies suggest that ethanol affects prefrontal cortex functions such as decision making, working memory, and behavioral control (reviewed in Abernathy et al., 2010). Chronic ethanol abusers often show decreased grey and white matter volume in the frontal cortex, which is thought to play a role in their loss of control of ethanol consumption (Chanraud et al., 2007; Rando et al., 2011). Furthermore, animal studies have shown that the mesocorticolimbic dopaminergic system plays a role in the reinforcing effects of ethanol (Czachowski et al., 2001; Hodge et al., 1993; Samson and Chappell, 2003), in particular the nucleus accumbens and ventral tegmental area (Czachowski et al., 2001, 2012; Doyon et al., 2003, 2005; Hodge et al., 1993; Howard et al., 2008, 2009; Samson and Chappell, 2003; reviewed in Gonzales et al., 2004). In marked contrast, the medial prefrontal cortex (mPFC) has received substantially less attention concerning these matters (Hodge et al., 1996; Samson and Chappell, 2003). Considering dopamine’s pivotal role as a neuromodulator in the region, the current uncertainty about the pharmacological effect of ethanol on mPFC dopamine is a breach in ethanol abuse research (neuromodulation reviewed in Seamans and Yang, 2004).
Past microdialysis experiments investigating the relationship between acute ethanol administration and extracellular dopamine concentration in the mPFC have shown mixed results. Dazzi and colleagues found that male Sprague-Dawley rats, ovariectomized female Sprague-Dawley rats pretreated with estrogen, as well as intact female Sprague-Dawley rats in estrus, showed a significant increase in dialysate dopamine concentration after a 0.5 g/kg intraperitoneal (ip) ethanol injection (Dazzi et al., 2002; 2007). A recent study showed that the microinjection of 44 mM ethanol into the posterior VTA of female Wistar rats resulted in a significant medial prefrontal cortical increase in extracellular dopamine (Ding et al., 2011). Yet, other studies found no dopamine response in the mPFC after ethanol injections were delivered to male Sprague-Dawley rats (0.5 and 2.0 g/kg, ip), male P-rats (2.0 g/kg, ip) or male Wistar rats (2.0 g/kg, ip) (Bassareo et al., 1996; Engleman et al., 2006; Hegarty and Vogel, 1993). Furthermore, the 2002 Dazzi study noted a decrease in dialysate dopamine when male Sprague-Dawley rats received a 1.0 g/kg, ip ethanol injection (Dazzi et al., 2002). There are a variety of factors that could contribute to these disparate results. Most of these studies collected dialysate samples at 20-minute (min) intervals. This long sampling period could have masked a transient extracellular dopamine change, explaining the absence of a dopamine response in some studies. Ding and colleagues noted an increase in prefrontal cortical dialysate dopamine when using a 10-min sampling period, yet the female rats’ estrous cycles were not monitored during experiments. Dazzi and colleagues’ work suggests that changes in hormone levels during the estrous cycle affect the mPFC dopaminergic response to ethanol. Though Ding and colleagues attempted to randomize the estrous phase of rats during experiments, it is possible that an estrous phase and ethanol interaction could be responsible for the increases in extracellular dopamine noted in the study.
Stressors such as a tail shock or physical restraint, as well as physical handling increase dialysate dopamine concentrations in the mPFC of rats (Abercrombie et al., 1989; Feenstra et al., 1998; 2000; Hegarty and Vogel, 1993; Segovia et al., 2008). Therefore, it is possible that physiological factors associated with handling required to administer the i.p. injection by Dazzi et al. (2002 and 2007) could have contributed to the dopamine response observed in the prefrontal cortex, rather than solely the pharmacological effects of ethanol. However, the 2002 study did not see a significant dialysate dopamine increase after a vehicle or 0.25 g/kg ip ethanol injection, suggesting that ethanol, not stress or physical handling, contributed to the extracellular dopamine increase. A variety of hypotheses could be formulated to explain the conflicting results of these microdialysis studies, yet, the problem remains that there is not a clear understanding regarding the effects of ethanol on medial prefrontal cortical dopamine activity.
Our goal was to determine if pharmacological effects of ethanol cause changes in extracellular dopamine concentrations in the mPFC. To address past confounding factors, our experimental design incorporated the following: 1) higher dopamine time course resolution (10-min dialysis samples), 2) a handling-free route of drug administration, 3) use of male subjects to eliminate estrous cycle interactions, and 4) an additional experimental group to validate that our method of drug administration did not contribute to a dopamine response. We performed microdialysis in the mPFC of male Long-Evans rats during intravenous (iv) infusions of ethanol or saline. Both dialysate dopamine and ethanol concentrations were monitored to evaluate the effects of non-contingent, acute iv ethanol on the extracellular dopamine concentrations in the mPFC.
Materials and Methods
Animals
We used a total of 41 male, Long-Evans rats (200 - 275 g upon arrival from Charles River Laboratories, USA), which were housed under a 12 hour (hr) light/dark schedule, at 23 ± 2 °C with ad libitum food and water. All procedures complied with the guidelines set by the National Institutes of Health Guide for the Care and Use of Laboratory Animals, and were approved by the Institutional Animal Care and Use Committee of the University of Texas at Austin.
Materials
The 10 % ethanol solution (weight/volume in saline) was prepared from 95 % ethanol (AAPER Alcohol and Chemical Co., Shelbyville, KY), NaCl (Fisher Scientific, Houston, TX) and either distilled water or sterile saline, and then filtered with an Acrodisc 0.2 μm nylon membrane filter (Pall Corp., Ann Arbor, MI). Solutions had final NaCl concentrations of either 0.06 M or 0.15 M. The 10 % ethanol/10% sucrose solution was made from 95 % ethanol (AAPER Alcohol and Chemical Co., Shelbyville, KY), ultrapure sucrose (MP Biomedicals, LLC, Solon, OH) and distilled water. Gentamicin (APP Pharmaceuticals, Schaumburg, IL), heparin (APP Pharmaceuticals, Schaumburg, IL), lidocaine (Hospira, Inc., Lake Forest, IL), carprofen (Pfizer, New York, NY), and Timentin (GlaxoSmithKline, Research Triangle Park, NC) were all required for surgical procedures.
Surgical procedures
Surgical procedures were performed as described in Howard et al., 2008 and Duvauchelle et al., 1998. Briefly, for experiments 1 – 3, after at least 3 days of handling and habituation to our facility, animals were surgically implanted with a jugular catheter and then placed in a stereotaxic frame and fitted with a 21 gauge guide cannula (Plastics One, Roanoke, VA) above the left mPFC (in mm relative to bregma and the skull surface): +3.0 antero-posterior, +0.6 lateral, −2.0 ventral (Paxinos and Watson, 1986). Probe active area began 0.25 mm below the guide cannula. Carprofen (5 mg/kg) was subcutaneously administered for post-surgical malaise. Catheters were flushed at least every 3 days with 0.1 ml of heparinized saline to maintain patency. Animals were allowed at least 5 days of recovery prior to experiments.
For experiment 4, animals were handled and habituated to the facility for at least a week prior to surgical cannulation above the left mPFC. These animals were allowed a 7-day recovery period prior to lever-press training.
Microdialysis
The afternoon before the experiment, we briefly sedated the rat with isoflurane and inserted a laboratory-constructed dialysis probe through the guide cannula into the rat’s mPFC. For 2 animals in experiment 1 the active area was 2.75 mm long. We then adjusted the active area to 3.25 mm for the rest of the rats to increase dopamine dialysate recovery (18,000 molecular weight cut off membrane). The probes were perfused with artificial cerebral spinal fluid (ACSF: 149 mM NaCl, 2.8 mM KCl, 1.2 mM CaCl2, 1.2 mM MgCl2, 0.2 mM ascorbic acid, and 5.4 mM D-glucose) overnight at 0.2 μl/min, and increased to 1.0 μl/min in the morning at least 2 (hr) before dialysate sample collection began (Exmire Microsyringe, Ito Corp. Fuji, Japan; CMA 102 or CMA 100 microinjection pump, Acton, MA USA). Dialysis samples were collected every 10 min, immediately placed on dry ice, and later stored in a −80°C freezer. Microdialysis set-ups and probe construction were modeled after Doyon et al., 2003, and Pettit and Justice, 1991. Ethanol infusions were given as a 10% weight/volume ethanol solution in saline. During the course of the experiments, a solution error was discovered. The iv ethanol solution administered was hypotonic (0.06 M NaCl), but the tonicity error was corrected (0.15 M NaCl) for subsequent experiments. The number of animals that received each solution is noted in the results section. The volume of ethanol infusions was determined by the animal’s weight and the desired ethanol dose. Saline infusions were calculated in the same manner. Infusion rates and volumes are found in Table 1. At the conclusion of all experiments, we perfused calcium-free ACSF through the probe for 1-2 hr and collected additional samples. A minimum 40% dopamine concentration reduction in calcium-free ACSF samples was required for inclusion for analysis. Additionally, baseline samples were required to have a relative standard deviation < 0.25 for data inclusion. Animal behavior was visually observed and video recorded during experiments 1-3, and visually observed during experiment 4.
Table 1. Experiment 1 and 2 Infusion Rates.
Ethanol (1.0 g/kg) was infused at different rates in experiments 1 and 2. Similar volumes of fluid were used in both experiments, but experiment 1 used a rapid manual infusion, while experiment 2 used a slow pump-delivered infusion.
| Experiment | Infusion Volume Range (ml) |
Infusion Time Range (seconds) |
Average Infusion Rate (ml/minute) |
|---|---|---|---|
| Experiment 1: Rapid Infusion |
3.0 – 4.6 | 58 – 102 | 2.7 |
| Experiment 2: Slow Infusion |
3.3 – 4.8 | 332 - 473 | 0.6 |
Experiment 1: Rapid 1.0 g/kg bolus ethanol infusion
Baseline samples were collected for 30 min before animals were intravenously infused with saline. Samples were taken for another 40 min and then animals were intravenously infused with 1.0 g/kg ethanol, and an additional 40 min of samples were collected. We used the 3 samples taken before the saline infusion, and the 2 samples taken before the ethanol infusion as the dopamine baseline to determine the dopamine response after the saline and ethanol infusions, respectively.
Experiment 2: Slow 1.0 g/kg ethanol infusion
Experiment 2 matched experiment 1 in every aspect except for the flow rate, manner, and habituation of the fluid infusion. Instead of rapid manual infusions (~2.7 ml/min), fluid was slowly (~0.6 ml/min) infused by a pump (CMA 400 or CMA 100 microinjection pump, Acton, MA USA). Additionally, at least 45 min prior to the start of the experiment, animals were infused with saline for 2 min to habituate them to the sound of the pump and the feeling of the slow fluid infusion.
Experiment 3: Cumulative ethanol or saline infusions
Baseline samples were taken for 30 min before animals began a series of either 10 % ethanol or saline infusions. In 20-min periods, we manually administered a 0.25, 0.5, 0.75, and then 0.75 g/kg infusion of ethanol or saline. This dosing scheme results in cumulative ethanol doses of 0.25, 0.75, 1.5 and 2.25 g/kg. On average, fluid was infused at a rate of 2.2 ml/min, and was completely administered within the first 1.5 min of the 10 min infusion sample. Samples were taken for 30 min after the final infusion. We used the first 3 samples as the dopamine baseline to determine the dopamine response after all infusions.
Experiment 4: Ethanol self-administration
After recovery from surgery, animals were trained to lever press for a 10 % sucrose solution in a MedAssociates, Inc. (Vermont, USA) operant chamber outfitted with a retractable lever and bottle as described in Howard et al., 2009. After animals learned to lever press, they began an 8-session training protocol. During this protocol, ethanol was successively added to the rat’s drinking solution, culminating in a 10 % sucrose/10 % ethanol solution. Microdialysis was performed during the 8th self-administration session. Seven-min samples were taken. The experimental time course is shown in Figure 5.
Figure 5. Experimental time course for ethanol self-administration.
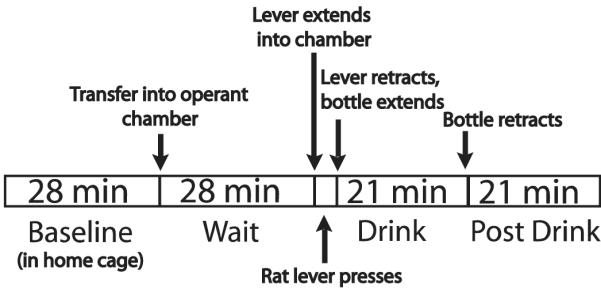
On the 7th day of ethanol self-administration dialysis was performed. Seven-minute samples were taken during these behavioral phases.
Dopamine analysis
We analyzed dialysate dopamine concentrations via reversed-phase high performance liquid chromatography with electrochemical detection. Over the course of the experiments, 3 different systems were used. System 1 used a Polaris 50 × 2 mm column (C18, 3-μm particle size; Varian, Lake Forest, CA), an Alexys autosampler (Antec Leyden, Netherlands) and a 2mm glassy carbon working electrode electrochemical detector (SenCell, Antec Leyden, Netherlands) at potential + 345 mV. The autosampler injected 7 μl of dialysate along with ascorbate oxidase into the system. Mobile phase flow rate was 0.3 ml/min. Systems 2 and 3 used a Luna 50 × 1.0 mm column (C18, 3-μm particle size; Phenomenex, Torrance CA), an 8125 manual injector (Rheodyne, Cotati, CA) or an automated Valco Valve (Valco Instruments Co. Inc., Houston, TX), and a 2 mm glassy carbon working electrode (SenCell or VT03 with ISAAC reference electrode, Antec Leyden, Netherlands) at potential + 345 or + 395 mV. Samples were thawed and then 7 μl of sample were manually mixed with 1.5 μl of ascorbate oxidase, and then 5 – 7 μl were injected into the system. Mobile phase flow rate was 0.1 ml/min. All systems used the following mobile phase: 1 liter of approximately 2.1 mM octanesulfonic acid, 0.05-1.5 mM decanesulfonic acid (adjusted as needed throughout the experiments), 0.34 mM ethylenedianimetetraacetic acid, 71 mM sodium phosphate monobasic dehydrate, and 60 mM potassium chloride aqueous solution that was then adjusted to 5.60 pH with 1 M sodium hydroxide, after which 150 mL methanol was added. All systems used EZChrom Elite software to record and analyze chromatograms. External standards (0.0625 or 0.125 – 0.5 or 1.0 nM) were used to quantify the dopamine concentrations (linear curve, typically R2 > 0.99). All samples were required to have a signal to noise ratio above 3. Dialysate dopamine data are represented as a percent of their respective baseline samples (mean ± standard error of the mean (S.E.M.)).
Ethanol analysis
For experiments 1-3, two samples before the ethanol infusion and all samples after had 2 μL of dialysate removed for ethanol analysis. For experiment 4, two samples before the rat began drinking the 10% ethanol/ 10% sucrose solution and all samples after had 1 μL of dialysate removed for ethanol analysis. The aliquot of dialysate was placed into a 2 mL glass chromatography vial that was then sealed with a septum and analyzed for ethanol concentrations via gas chromatography with flame ionization detection. The system consisted of a Varian CP 3800 gas chromatograph with flame ionization detector, a Varian 8200 or 8400 headspace autosampler (65 or 50 °C), and an HP Innowax capillary column (30 m × 0.53 mm × 1.0 μm film thick), with helium mobile phase. Varian Star Chromatography Workstation software was used to record and analyze chromatograms (Varian Inc., Walnut Creek, CA, USA). External standards (0.3 – 20 mM for experiments 1, 2 and 4, and 0.3 - 40 mM for experiment 3) were used to quantify the ethanol concentrations. Ethanol dialysate data are represented as the concentration of ethanol in the dialysate (mean ± S.E.M.).
Histology
Animals were overdosed with sodium pentobarbital (150 mg/kg, ip) and then intracardially perfused with saline followed by 10% formalin in saline. The brain was removed, coronally sectioned (100 μm thick) using a vibratome (Leica, Nussloch, Germany), and stained with cresyl violet. Correct placement of the probe active dialysis area was confirmed and subregional placement was noted (Paxinos et al., 1999; Paxinos and Watson, 1986).
Statistical Analysis
Data were analyzed with repeated measures analysis of variance (ANOVA), and ANOVA. Bonferroni corrections were used for all post hoc analyses. Statistical analyses required p < 0.05 to assign significance. For experiments 2 and 3, due to a lack of homogeneity of variance in the dopamine data, all statistics were performed on transformed dopamine data. In experiment 3, natural log transformation of the data corrected the homogeneity of variance violations. In order to correct the homogeneity of variance violations in experiment 2, the pre-saline and saline infusion dopamine data was squared, while the pre-ethanol and ethanol dopamine data were natural log transformed. Experiment 2 saline and ethanol data were then analyzed separately. In experiment 3, Spearman’s rho was used to test for correlations between ethanol dose or dialysate concentration, and dialysate dopamine concentration.
Results
Experiment 1: Rapid 1.0 g/kg bolus ethanol infusion
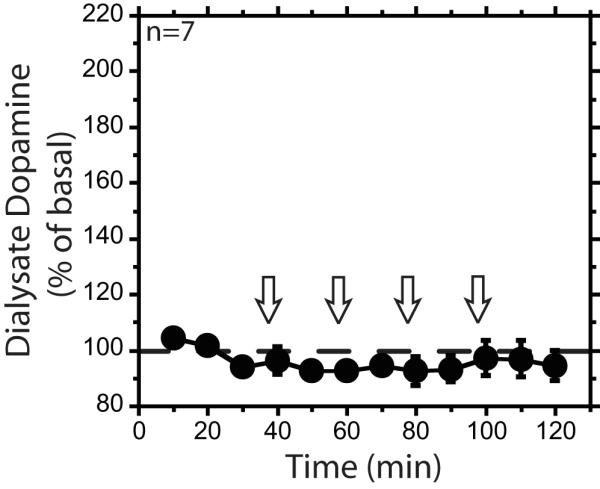
A rapid iv infusion of ethanol (1.0 g/kg) resulted in concurrent increases of mPFC dialysate ethanol and dopamine concentrations (Figure 1). Dialysate dopamine peaked at 55 ± 9 % above baseline, and remained significantly elevated for 20 min after the infusion (F5,68=12, individual 10 and 20 min time points F2,68=27, F2,68=4.9, respectively, p<0.05). A rapid infusion of saline had no significant effect (F6,68 = 0.5, ns) (Figure 1A). Five of the 8 animals showed pronounced loss of motor control after ethanol infusion. All animals received hypotonic ethanol solution.
Figure 1. Intravenous bolus infusion of ethanol (1 g/kg) increases dialysate dopamine and ethanol concentrations.

Panel A shows the percent baseline dialysate dopamine (circles) over the course of an intravenous (iv) saline and then iv 1.0 g/kg 10% ethanol infusion. Open arrow represents iv saline infusion. Closed arrow represents iv ethanol infusion. In panel B the ethanol dialysate data (squares) are represented as the concentration of ethanol in the dialysate. Data are represented as mean ± standard error of the mean. * signifies p<0.05 compared with baseline.
Experiment 2: Slow 1.0 g/kg ethanol infusion
To control for possible effects of the rapid bolus infusion of relatively large volumes of fluid, we repeated the experiment with a slower infusion rate. In addition, we also included a separate saline infusion before the experiment to habituate the rat to the infusion procedure. The isotonic and hypotonic ethanol solution groups’ dialysate dopamine and ethanol time courses were not significantly different; therefore, the groups were collapsed for further analysis (saline treatment dopamine time course F1,9 = 0.11, ethanol treatment dopamine time course F1,9 = 1.5, ethanol dialysate time course F1,9 = 0.06, ns). A slow pump-driven infusion of ethanol (1.0 g/kg) resulted in concurrent increases of mPFC dialysate ethanol and dopamine concentrations (Figure 2). Dialysate dopamine peaked at 63 ± 15% above baseline, and remained significantly elevated for 30 min after the infusion (F5,44 = 15, individual 10, 20, 30 min time points F2,44 = 26, F2,44 = 22, F2,44 = 8.8, respectively, p<0.05). The magnitude and pattern of the extracellular dopamine increase after the slow ethanol infusion was similar to that observed previously with the rapid bolus infusion method. A slow pump-driven infusion of saline had no significant effect (F6,51 = 0.5, ns) (Figure 2A). Six of the 11 animals showed pronounced loss of motor control after ethanol infusion.
Figure 2. Intravenous slow infusion of ethanol (1 g/kg) increases dialysate dopamine and ethanol concentrations.

Panel A shows the percent baseline dialysate dopamine (circles) over the course of a slow pump-driven intravenous (iv) saline and then iv ethanol infusion. Open arrow represents iv saline infusion. Closed arrow represents iv ethanol infusion. In panel B the ethanol dialysate data (squares) are represented as the concentration of ethanol in the dialysate. Data are represented as mean ± standard error of the mean. * signifies p<0.05 compared with baseline.
Experiment 3: Cumulative ethanol or saline infusions
In order to determine the dose-dependent effects of iv ethanol infusion, we performed a cumulative dosing experiment. Administration of 0.25, 0.75, 1.50, and 2.25 g/kg cumulative doses of ethanol resulted in concurrent increases of mPFC dialysate ethanol and dopamine concentrations (Figure 3). The isotonic and hypotonic ethanol solution groups’ dialysate dopamine and ethanol time courses were not significantly different; therefore, the groups were collapsed for further analysis (F1,9=0.0001, F1,9=1.3, respectively, ns). The 0.75, 1.50 and 2.25 g/kg doses of ethanol resulted in significant dialysate dopamine increases above baseline (F4,162=9.2, F4,162=34, F5,162=46, respectively, p<0.05), while infusions of saline and the 0.25 g/kg dose of ethanol did not (F11,162=0.6, F4,162=2.8, respectively, ns) (Figures 3A and 4).
Figure 3. Dose-dependent stimulation of dialysate dopamine and ethanol concentrations using a cumulative dosing procedure.

Panel A shows the percent baseline dialysate dopamine (circles) over the course the cumulative ethanol infusions with cumulative doses of 0.25, 0.75, 1.5 and 2.25 g/kg. Closed arrows represents intravenous (iv) ethanol infusions. * signifies p<0.05 compared with baseline. In panel B the ethanol dialysate data (squares) are represented as the concentration of ethanol in the dialysate. * signifies p<0.05 compared with each other dose. All data are represented as mean ± standard error of the mean.
Figure 4. Experiment 3 saline percent basal dopamine time course.
Percent baseline dialysate dopamine over the course the cumulative saline infusions. Open arrows represent intravenous saline infusions. Data are represented as mean ± standard error of the mean.
Significantly different peak dialysate ethanol concentrations were demonstrated for each ethanol dose (Figure 3B), confirming that the cumulative dosing protocol produced 4 different doses of ethanol (F3,43=153, p<0.05). There was a main effect of ethanol dose on dialysate dopamine concentration, as well as a significant correlation between the dialysate ethanol and dopamine concentrations, and between ethanol dose and dopamine concentrations (F4,109 = 12, p<0.05; r = 0.63, r = 0.61, p<0.01, respectively). The dialysate ethanol concentrations reported are not corrected with an extraction fraction, and therefore do not represent ethanol tissue concentrations. Two of the 11 animals that received ethanol began showing pronounced loss of motor control after the first infusion (0.25 g/kg dose), 1 of the 11 after the second infusion (0.75 g/kg dose), 5 of the 11 after the third infusion (1.5 g/kg dose), and 3 of the 11 after the fourth infusion (2.25 g/kg dose). Saline infusions did not cause obvious changes in behavior.
Experiment 4: Ethanol self-administration
In order to relate the brain ethanol concentrations from acute experiments 1 - 3 to self-administration experiments, we performed an ethanol self-administration study using similar microdialysis and ethanol analysis conditions as experiments 1-3. Rats orally self-administered an average 1.2 ± 0.08 g/kg ethanol dose on the day of dialysis. Dialysate ethanol concentrations were lowest in the first drink sample and gradually increased over the drink and post-drink session, peaking at 4.14 ± 0.6 mM ethanol dialysate concentration during the post-drink period (Figure 6). The dialysate ethanol concentrations reported are not corrected with an extraction fraction, and therefore do not represent ethanol tissue concentrations.
Figure 6. Ethanol time course for ethanol self-administration.
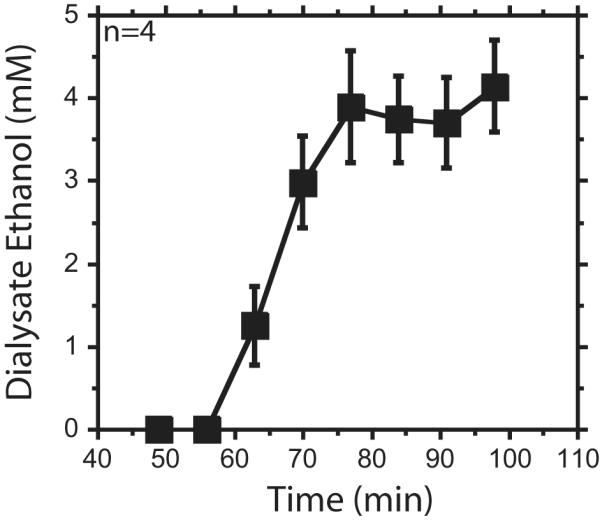
Ethanol dialysate data show the concentration of ethanol in the dialysate. Data are represented as mean ± standard error of the mean. Animals began drinking around 56 minutes (min). The bottle retracted from the chamber around 77 min. Seven-min samples were taken.
Histological analysis and dopamine basal averages
Figure 7 represents the placements of the microdialysis probe active areas. At least 50% of the active dialysis area was in the infralimbic and prelimbic subregions of the mPFC for all animals. Most probes also sampled from the cingulate cortex, and minimally from the dorsal peduncular cortex and motor cortex. There were no significant differences in average baseline dopamine concentrations between the isotonic and hypotonic slow infusion groups, or the isotonic ethanol, hypotonic ethanol and saline cumulative dosing groups (F1,10 = 0.2, F2,17 = 2.7, respectively, ns), (table 2).
Figure 7. Microdialysis probe placements.

Coronal slices representing microdialysis probe placements for all experimental groups. Line shows active dialysis area. Light gray shows prelimbic subregion. Dark gray shows infralimbic subregion. Numbers to the left indicate distance relative to bregma (mm). Figure adapted from Paxinos & Watson (1998).
Table 2. Dopamine Baseline Concentrations by Experiment.
Experiments 1 and 2 show the pre-saline and pre-ethanol dopamine baseline averages seen within the groups. Experiment 3 shows the dopamine baseline averages for the two separate saline and ethanol groups.
| Experiment | Saline (nM) | Ethanol (nM) |
|---|---|---|
| Experiment 1: Rapid Infusion |
0.16 ± 0.02 | 0.17 ± 0.02 |
| Experiment 2: Slow Infusion |
0.12 ± 0.01 | 0.12 ± 0.01 |
| Experiment 3:Cumulative Ethanol or Saline Infusion |
0.14 ± 0.01 | 0.19 ± 0.01 |
Discussion
Overall, our results suggest that acute non-contingent iv ethanol administration increases extracellular dopamine in the mPFC of the male Long-Evans rat. Previous studies arrived at disparate results, but factors such as long sampling times, estrous cycle interactions, handling of the animals during experimentation, and drug administration by ip injection could explain, at least in part, the incongruence. Our experimental design diminished these factors, and produced findings that clarify how acute ethanol affects the mesocorticolimbic dopaminergic system.
Because past investigations have reported an increase, decrease, or no change in extracellular dopamine concentrations in the mPFC after acute ethanol administration, it is important that we address how previous studies’ experimental designs and results compare to ours (Bassareo et al., 1996; Dazzi et al., 2002; 2007; Ding et al., 2011; Engleman et al., 2006; Hegarty and Vogel, 1993). Most of the previous studies took 20-min microdialysis samples. This long sampling time could have masked a transient change in extracellular dopamine, which could explain why some investigators did not see an ethanol-induced dopamine change. To address this we doubled the time resolution. To assure that the decreased sample volume did not compromise the quality of the dopamine chromatography, we required a signal to noise ratio > 3. Ding et al, (2011) also used these criteria, and they too reported an ethanol-stimulated dopamine increase, strengthening the argument that increased time resolution unveils a previously un-measureable extracellular dopamine change.
The interaction of ovarian steroid hormone levels and mPFC dopaminergic response to ethanol might also have contributed to varied experimental outcomes. The effects of estrus, or treatments that mimic it, could have enhanced an ethanol-induced dopamine increase so that it was visible using 20-min sampling periods (Dazzi et al., 2002; 2007). Furthermore, one cannot rule out a possible contribution of estrus effects to the dialysate dopamine increase seen in Ding et al., 2011, as the authors did not account for this factor. Using male rats, we show that an ethanol-induced mPFC dialysate dopamine increase can occur in the absence of estrus or estrogen pretreatment.
Intraperitoneal injection is a non-optimal method of drug administration when monitoring dialysate dopamine concentrations in the mPFC, because physical handling of rats, as well as stressors such as physical restraint or tail shock, can increase extracellular dopamine in the mPFC (Abercrombie et al., 1989; Feenstra et al., 1998; 2000; Hegarty and Vogel, 1993; Segovia et al., 2008). Unlike previous experiments, we avoided this potential confounding factor by using a jugular catheter to administer saline and ethanol infusions. The catheter inlet tubing was suspended above the rat during the experiment; therefore, the experimenter never touched the animal during dialysis, ruling out that physical handling, or injection stress contributed to the observed extracellular dopamine increase.
While iv drug administration allowed us to avoid many previously noted confounding factors, iv delivery of substantial volumes of fluid could have contributed to our observed dopamine increase. After a rapid 1.0 g/kg bolus infusion of ethanol, dopamine significantly increased for 20 min, while infusion of saline did not significantly alter dialysate dopamine concentrations (experiment 1). This suggests that the dopamine increase seen after the ethanol infusion was specific to the effects of ethanol, not the infusion of fluid. Nevertheless, 3 to 4.6 ml of 10 % ethanol infused at a rate of 2.7 ml/min could have engendered physiological effects that may have augmented the extracellular dopamine increase (Abercrombie et al., 1989; Hegarty and Vogel, 1993; Segovia et al., 2008). Therefore, to clarify whether or not the iv infusion protocol interacted with the pharmacological effects of ethanol to increase dopamine, we slowed the 1.0 g/kg ethanol infusion from an average 2.7 ml/min to an average 0.6 ml/min (experiment 2). This reduction in infusion flow rate should lessen any physiological changes that may have been produced by the infusion. Yet, the increases in dialysate dopamine concentrations after the slow and rapid infusions of ethanol were similar. These results not only imply that the pharmacological effects of ethanol, rather than the method of administration, led to the dopamine increase in the mPFC, they also substantiate the use of iv catheter drug administration while monitoring extracellular dopamine changes in the mPFC.
Finally, the strongest evidence that the pharmacological effects of ethanol, rather than physiological factors, are predominantly responsible for the dopamine increases is the dose-dependence of the response (experiment 3). This, along with the significant correlation of dialysate dopamine and ethanol concentrations, suggests that ethanol concentrations in the brain play a significant role in the systemic ethanol-stimulated dopamine response in the mPFC.
It is probable that excitation of VTA dopaminergic neurons projecting to the mPFC are responsible for ethanol-induced mPFC dopamine increases. Ding et al. (2011) found that a microinjection of ethanol in the posterior VTA led to an increase in extracellular mPFC dopamine. These authors attempt to reconcile their findings with previous studies, in which systemic ethanol administration did not cause an mPFC dialysate dopamine increase, by purporting that systemic ethanol administration may allow compensatory responses to suppress a mPFC dopamine increase. In light of our findings, it seems more likely that either local posterior VTA or systemic ethanol administration leads to increased mPFC dialysate dopamine concentrations in ethanol-naïve rats, and that a lack of time resolution accounts for previous negative results.
An important question raised by our findings of a dose-dependent stimulation of mPFC dopamine after non-contingent ethanol is whether a similar effect occurs with the ethanol concentrations achieved during self-administration. The ethanol self-administering rats from experiment 4 drank an average 1.2 g/kg ethanol, which is essentially in the middle of the cumulative ethanol dose range (0.25 to 2.25 g/kg). While the pharmacokinetics of the two routes of administration are quite different, with iv ethanol delivery leading to higher peak brain ethanol concentrations than that seen after the oral consumption of the same dose of ethanol, the dialysate ethanol concentrations after the 0.25 and 0.75 g/kg doses of iv ethanol in experiment 3 encompass the range of dialysate ethanol concentrations in experiment 4. Therefore, the current pharmacological data will be a useful reference to compare with future studies evaluating extracellular dopamine changes in the mPFC during ethanol self-administration.
Our findings provide a knowledge base regarding how ethanol acutely affects extracellular dopamine concentrations in the mPFC. It remains to be seen how repeated, voluntary ethanol consumption and mPFC dopamine relate. However, when this area is studied, these acute data will allow for comparison of the pharmacological effects of ethanol and the effects of ethanol self-administration associated cues, ultimately clarifying the role of the mesocorticolimbic dopamine system during ethanol reinforcement.
Acknowledgements
This research was supported by grants from NIH/NIAAA (AA11852 and AA007471) and the Bruce-Jones Fellowship. The authors would like to sincerely thank Jamie Yu, Mona Madani, So Yoon Lee, Wonbin Song and Hannah Bang for their assistance with experiments, and Drs. Regina Mangieri and Vorani Ramachandra for their help with manuscript preparation.
Funding: This research was supported by grants from NIH/NIAAA (AA11852 and AA007471) and the Bruce-Jones Fellowship at The University of Texas at Austin.
Abbreviations
- ip
intraperitoneal
- iv
intravenous
- mPFC
medial prefrontal cortex
- VTA
ventral tegmental area
- min
minute
- hr
hour
Footnotes
Authors have no conflict of interest.
References
- Abercrombie E, Keefe A, DiFrischia D, Zigmond M. Differential effect of stress on in vivo dopamine release in striatum, nucleus accumbens, and medial frontal cortex. J Neurochem. 1989;52:1655–1658. doi: 10.1111/j.1471-4159.1989.tb09224.x. [DOI] [PubMed] [Google Scholar]
- Abernathy K, Chandler LJ, Woodward JJ. Alcohol and the Prefrontal Cortex. Int Rev Neurobiol. 2010;91:289–320. doi: 10.1016/S0074-7742(10)91009-X. [DOI] [PMC free article] [PubMed] [Google Scholar]
- Bassareo V, Tanda G, Petromilli P, Giua C, Di Chiara G. Non-psychostimulant drugs of abuse and anxiogenic drugs activate with differential selectivity dopamine transmission in the nucleus accumbens and in the medial prefrontal cortex of the rat. Psychopharmacology (Berl) 1996;124:293–299. doi: 10.1007/BF02247433. [DOI] [PubMed] [Google Scholar]
- Chanraud S, Martelli C, Delain F, Kostogianni N, Douaud G, Aubin HJ, Reynaud M, Martinot JL. Brain morphometry and cognitive performance in detoxified alcohol-dependents with preserved psychosocial functioning. Neuropsychopharmacology. 2007;32:429–438. doi: 10.1038/sj.npp.1301219. [DOI] [PubMed] [Google Scholar]
- Czachowski CL, Chappell AM, Samson HH. Effects of raclopride in the nucleus accumbens on ethanol seeking and consumption. Alcohol Clin Exp Res. 2001;25:1431–1440. doi: 10.1097/00000374-200110000-00005. [DOI] [PubMed] [Google Scholar]
- Czachowski CL, DeLory MJ, Pope JD. Behavioral and neurotransmitter specific roles for the ventral tegmental area in reinforcer-seeking and intake. Alcohol Clin Exp Res. 2012;36:1659–1668. doi: 10.1111/j.1530-0277.2012.01774.x. [DOI] [PMC free article] [PubMed] [Google Scholar]
- Dazzi L, Serra M, Seu E, Cherchi G, Pisu MG, Purdy RH, Biggio G. Progesterone enhances ethanol-induced modulation of mesocortical dopamine neurons: antagonism by finasteride. J Neurochem. 2002;83:1103–1109. doi: 10.1046/j.1471-4159.2002.01218.x. [DOI] [PubMed] [Google Scholar]
- Dazzi L, Seu E, Cherchi G, Barbieri PP, Matzeu A, Biggio G. Estrous cycle-dependent changes in basal and ethanol-induced activity of cortical dopaminergic neurons in the rat. Neuropsychopharmacology. 2007;32:892–901. doi: 10.1038/sj.npp.1301150. [DOI] [PubMed] [Google Scholar]
- Ding ZM, Oster AM, Hall SR, Engleman EA, Hauser SR, McBride WJ, Rodd ZA. The stimulating effects of ethanol on ventral tegmental area dopamine neurons projecting to the ventral pallidum and medial prefrontal cortex in female Wistar rats: regional differences and involvement of serotonin-3 receptors. Psychopharmacology (Berl) 2011;216:245–255. doi: 10.1007/s00213-011-2208-5. [DOI] [PMC free article] [PubMed] [Google Scholar]
- Doyon WM, York JL, Diaz LM, Samson HH, Czachowski CL, Gonzales RA. Dopamine activity in the nucleus accumbens during consummatory phases of oral ethanol self-administration. Alcohol Clin Exp Res. 2003;27:1573–1582. doi: 10.1097/01.ALC.0000089959.66222.B8. [DOI] [PubMed] [Google Scholar]
- Doyon WM, Anders SK, Ramachandra VS, Czachowski CL, Gonzales RA. Effect of operant self-administration of 10% ethanol plus 10% sucrose on dopamine and ethanol concentrations in the nucleus accumbens. J Neurochem. 2005;93:1469–1481. doi: 10.1111/j.1471-4159.2005.03137.x. [DOI] [PubMed] [Google Scholar]
- Duvauchelle CL, Sapoznik T, Kornetsky C. The synergistic effects of combining cocaine and heroin (“speedball”) using a progressive-ratio schedule of drug reinforcement. Pharmacol Biochem Behav. 1998;61:297–302. doi: 10.1016/s0091-3057(98)00098-7. [DOI] [PubMed] [Google Scholar]
- Engleman EA, Ingraham CM, McBride WJ, Lumeng L, Murphy JM. Extracellular dopamine levels are lower in the medial prefrontal cortex of alcohol-preferring rats compared to Wistar rats. Alcohol. 2006;38:5–12. doi: 10.1016/j.alcohol.2006.03.001. [DOI] [PubMed] [Google Scholar]
- Feenstra MG, Botterblom MH, Mastenbroek S. Dopamine and noradrenaline efflux in the prefrontal cortex in the light and dark period: effects of novelty and handling and comparison to the nucleus accumbens. Neuroscience. 2000;100:741–748. doi: 10.1016/s0306-4522(00)00319-5. [DOI] [PubMed] [Google Scholar]
- Feenstra MG, Botterblom MH, van Uum JF. Local activation of metabotropic glutamate receptors inhibits the handling-induced increased release of dopamine in the nucleus accumbens but not that of dopamine or noradrenaline in the prefrontal cortex: comparison with inhibition of ionotropic receptors. J Neurochem. 1998;70:1104–1113. doi: 10.1046/j.1471-4159.1998.70031104.x. [DOI] [PubMed] [Google Scholar]
- Gonzales RA, Job MO, Doyon WM. The role of mesolimbic dopamine in the development and maintenance of ethanol reinforcement. Pharmacol Ther. 2004;103:121–146. doi: 10.1016/j.pharmthera.2004.06.002. [DOI] [PubMed] [Google Scholar]
- Hegarty AA, Vogel WH. Modulation of the stress response by ethanol in the rat frontal cortex. Pharmacol Biochem Behav. 1993;45:327–334. doi: 10.1016/0091-3057(93)90247-q. [DOI] [PubMed] [Google Scholar]
- Hodge CW, Chappelle AM, Samson HH. Dopamine receptors in the medial prefrontal cortex influence ethanol and sucrose-reinforced responding. Alcohol Clin Exp Res. 1996;20:1631–1638. doi: 10.1111/j.1530-0277.1996.tb01709.x. [DOI] [PubMed] [Google Scholar]
- Hodge CW, Haraguchi M, Erickson H, Samson HH. Ventral tegmental microinjections of quinpirole decrease ethanol and sucrose-reinforced responding. Alcohol Clin Exp Res. 1993;17:370–375. doi: 10.1111/j.1530-0277.1993.tb00778.x. [DOI] [PubMed] [Google Scholar]
- Howard EC, Schier CJ, Wetzel JS, Duvauchelle CL, Gonzales RA. The shell of the nucleus accumbens has a higher dopamine response compared with the core after non-contingent intravenous ethanol administration. Neuroscience. 2008;154:1042–1053. doi: 10.1016/j.neuroscience.2008.04.014. [DOI] [PMC free article] [PubMed] [Google Scholar]
- Howard EC, Schier CJ, Wetzel JS, Gonzales RA. The dopamine response in the nucleus accumbens core-shell border differs from that in the core and shell during operant ethanol self-administration. Alcohol Clin Exp Res. 2009;33:1355–1365. doi: 10.1111/j.1530-0277.2009.00965.x. [DOI] [PMC free article] [PubMed] [Google Scholar]
- Paxinos G, Kus L, Ashwell K, Watson C. Chemoarchitectonic Atlas of The Rat Forebrain. Academic Press; San Diego: 1999. [Google Scholar]
- Paxinos G, Watson C. The Rat Brain in Stereotaxic Coordinates Academic Press. 4th ed Academic Press; San Diego: 1998. [Google Scholar]
- Paxinos G, Watson C. The Rat Brain in Stereotaxic Coordinates. Academic Press; Orlando: 1986. [Google Scholar]
- Pettit HO, Justice JB. Effect of dose on cocaine self-administration behavior and dopamine levels in the nucleus accumbens. Brain Res. 1991;539:94–102. doi: 10.1016/0006-8993(91)90690-w. [DOI] [PubMed] [Google Scholar]
- Rando K, Hong K, Bhagwagar Z, Li CR, Bergquist K, Guarnaccia J, Sinha R. Association of frontal and posterior cortical gray matter volume with time to alcohol relapse: A prospective study. Am J Psychiatry. 2011;168:183–192. doi: 10.1176/appi.ajp.2010.10020233. [DOI] [PMC free article] [PubMed] [Google Scholar]
- Samson HH, Chappell A. Dopaminergic involvement in medial prefrontal cortex and core of the nucleus accumbens in the regulation of ethanol self-administration: a dual-site microinjection study in the rat. Physiol Behav. 2003;79:581–590. doi: 10.1016/s0031-9384(03)00126-4. [DOI] [PubMed] [Google Scholar]
- Seamans JK, Yang CR. The principal features and mechanisms of dopamine modulation in the prefrontal cortex. Prog Neurobiol. 2004;74:1–58. doi: 10.1016/j.pneurobio.2004.05.006. [DOI] [PubMed] [Google Scholar]
- Segovia G, Del Arco A, de Blas M, Garrido P, Mora F. Effects of an enriched environment on the release of dopamine in the prefrontal cortex produced by stress and on working memory during aging in the awake rat. Behav Brain Res. 2008;187:304–311. doi: 10.1016/j.bbr.2007.09.024. [DOI] [PubMed] [Google Scholar]