Abstract
While in vitro studies have shown that nanoscale surface modifications influence cell fate and activity, there is little information on how they modulate healing at the bone–implant interface.
Aim
This study aims to investigate the effect of nanotopography at early time intervals when critical events for implant integration occur.
Materials & methods
Untreated and sulfuric acid/hydrogen peroxide-treated machined-surface titanium alloy implants were placed in rat tibiae. Samples were processed for DNA microarray analysis and histomorphometry.
Results
At both 3 and 5 days, the gene expression profile of the healing tissue around nanotextured implants differed from that around machined-surface implants or control empty holes, and were accompanied by an increase in bone–implant contact on day 5. While some standard pathways such as the immune response predominated, a number of unclassified genes were also implicated.
Conclusion
Nanotexture elicits an initial gene response that is more complex than suspected so far and favors healing at the bone–implant interface.
Keywords: bone, DNA microarray, histomorphometry, nanotopography, titanium alloy
The current trend in implant research is the development of biomaterials with surfaces that will improve tissue integration and stability, and ensure clinical performance [1,2]. Surface characteristics such as chemical composition, morphology and energy can generate conditions at the bone–implant interface that significantly influence cell and tissue responses [3]. While all scales of implant topography can potentially influence tissue healing events, it is increasingly recognized that interactions between biomaterials and host tissues occur on the nanoscale, the scale at which cells normally carry out their activity [4,5]. Several studies have now demonstrated that nanoscale surface cues can elicit change in cell attachment [6,7], proliferation and differentiation [8–10], organization of cell shape and cytoskeleton [10,11], and enhance the precipitation of apatite [12].
While there have been several in vitro studies on cell behavior and surface texture, very few have investigated the effect of nanoscale surface modifications on implant osseointegration in the complex and multifactorial environment of the body [5]. Results from these few in vivo studies have suggested that nanoscale surface topography has a major impact on contact osteogenesis [13,14] and promotes interfacial strength [14]. Despite these reports, little is known on how nanotopography influences the early healing response and the cellular and molecular events that are critical for determining the outcome of an implant. The objective of this study was, therefore, to determine the gene expression and histological profile of tissue healing at early time points around nanostructured titanium (Ti) alloy screw-shaped miniature implants placed in rat tibiae, as compared with ones with a machined surface and the empty implantation hole. We selected early time points that reflect initial healing events in noncritical size defects in rat [15]. We used a chemical oxidative patterning approach with a mixture of sulfuric acid (H2SO4) and hydrogen peroxide (H2O2), which has proved efficient for various medically relevant metals [16–19], to nanostructure the implants. Such controlled oxidation predictably produces networks of nanosized pits of approximately 20 nm in diameter and with a root mean square roughness of approximately 15 nm [16–18,20]. This treatment has been shown to enhance osteogenic activity in vitro, to directly and selectively signal to cells, and to influence stem cell division and differentiation [17,19,21].
Materials & methods
Ti alloy implants & surface analysis
Miniature machined screw-shaped implants made of Ti-6Al-4V (Micro Med Machining Inc, FL, USA) were used. The screws had the following dimensions: 1.0 mm inner diameter; 1.5 mm outer diameter; 2.4 mm head diameter; 0.4 mm head thickness; and 1.6 mm implant length. Implants were washed with toluene and then nanotextured by treatment with a solution consisting of equal volumes of concentrated H2SO4 and H2O2 for 2 h, at room temperature (Figure 1) [16]. Samples were rinsed with nanopure distilled water, washed with 70% ethanol and air-dried. Machined screw implants were washed with 70% ethanol, rinsed with water and air-dried. The surface characteristics of the machined and nanotextured screws were confirmed using a JEOL JSM-7400F (Tokyo, Japan) field emission scanning electron microscope (SEM) operated at 1–2 kV.
Figure 1. High-resolution scanning electron micrographs of Ti6Al4V screw-shaped implant surfaces.
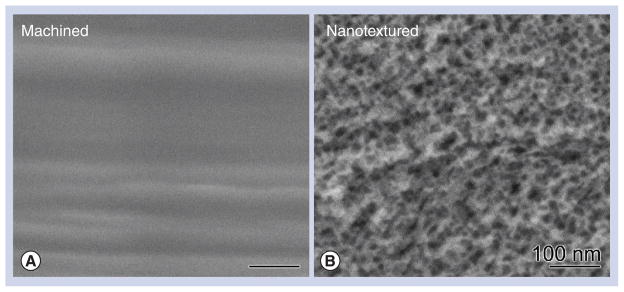
(A) The control (machined) surface appears smooth and (B) the surface treated with the oxidative solution (sulfuric acid/hydrogen peroxide) creates a nanotextured pattern with nanopits approximately 20 nm in diameter.
Surgical procedure
Forty male Wistar rats weighting 200–225 g (Charles Rivers Canada, QC, Canada) were anesthetized with an intraperitoneal injection of a mixture of Ketalean® (ketamine hydrochloride; Biomeda-MTC, ON, Canada), Rompun® (xylazine; Bayer Inc., ON, Canada) and Acevet® (acepromazine maleate; Vetoquinol Inc., QC, Canada). The anteromedial side of each hind limb was shaved and cleaned with Baxedin® (chlorhexidine gluconate; Omega Laboratories, QC, Canada). A 1-cm incision was made through the skin, and the skin and muscle were gently pried apart to expose the periosteum. Two holes were drilled through the periosteum and across the bone cortex at 5 mm from the knee joint, using a 1.4-mm round carbide burr (Brasseler, QC, Canada). The drilling site was irrigated with physiological saline and implants were placed in both tibiae. In a randomized manner, one tibia received two machined implants, while the other received two nanotextured implants. Control groups consisted of animals with holes without placement of a screw (empty hole). The muscle was sutured with 4-0 chromic gut sutures and the skin was closed with 4-0 sofsilk sutures (distributed by Patterson Dental Supply Inc., MN, USA). The surgical site was cleaned and disinfected with Baxedin. The animals received an injection of Temgesic® (buprenorphine hydrochloride; Reckitt and Colman, Hull, UK) after surgery and were fed with soft food containing Temgesic. All experimental protocols and animal handling described above were approved by the Comité de déontologie de l’expérimentation sur les animaux of Université de Montréal, Canada.
Tissue processing for RNA extraction
After 3 (n = 14) or 5 (n = 14) days, some animals were anesthetized, the wound was cleaned with 70% ethanol and opened with a scalpel blade and the screws were gently removed with a miniature jewelry screwdriver. Under physiological saline irrigation, the bone at the surgical site was harvested using a trephine drill (2.4-mm diameter, ACE Dental Implant System, MA, USA) fitted on a slow-speed hand-piece (Physiodispenser 3000, Henry Schein Inc., ON, Canada), placed in Trizol® (Invitrogen, ON, Canada) and immediately homogenized with the Polytron® (Kinematic Inc., NY, USA) at full speed for 1 min. Total RNA was extracted from these samples as recommended by the manufacturer and purified with the RNeasy® MiniElute® Cleanup kit (Qiagen, ON, Canada). RNA concentration, integrity and quality were analyzed using the Agilent Bioanalyzer 2100 at McGill University and Génome Québec Innovation Centre (QC, Canada). Only RNA samples showing a sharp distinction of clear 18s and 28s ribosomal RNA peaks and a high RNA integrity number were considered of ‘good quality’ and were used for DNA microarray analyses. The number of samples for day 3 (n = 14) and 5 (n = 14) was calculated after eliminating samples with poor-quality RNA.
DNA microarray design, hybridization, data normalization & analysis
Microarray analysis using an Illumina® RatRef-12 Expression BeadChip (22106 probe sets; Illumina, S CA, USA) was performed at McGill University and Génome Québec Innovation Centre. Expression analyses of microarray data were performed by Genexanalysis (QC, Canada [101]) using the method of consecutive sampling and coincidence testing [22–24] and statistical significance was estimated based on the method of stabilized variance [25].
Using the PANTHER Classification System [102], a ‘gene ontology’ classification of the genes/expressed sequence tags (ESTs) that were significantly (p < 0.05) up- or down-regulated was performed for both implants and time points (nanotextured implants vs empty hole, machined implants vs empty hole, and nano-textured vs machined implants at both 3 and 5 days post-surgery). Pathway analyses of differentially expressed genes (probability interval: 0.9) were carried out using the GO-Elite software (Gene Map Annotator and Pathway Profiler [GenMAPP], Gladstone Institute at the University of California at San Francisco [CA, USA]) [103].
Tissue processing for histology
After 3 (n = 6) or 5 days (n = 6), animals were anesthetized and perfusion-fixed [26]. Tibia were dissected out and immersed in a fixative solution consisting of 4% paraformaldehyde (Fisher Scientific, ON, Canada) and 0.1% glutaraldehyde (Electron Microscopy Sciences, PA, USA) in 0.08 M sodium cacodylate (Electron Microscopy Sciences) buffer containing 0.05% calcium chloride (Sigma-Aldrich Canada Ltd, ON, Canada), pH 7.2, for 3 h at 4°C. They were then washed with 0.1 M sodium cacodylate buffer, pH 7.2. Prior to processing for embedding in methylmethacrylate resin (Technovit® 9100 new, Electron Microscopy Sciences) [27], x-rays (7 mA, 60 kv, 0.500 s; Progeny Dental, IL, USA) of the dissected tibiae were taken to verify the positioning of the implant (Figure 2). Longitudinal sections that were 5- to 8-μm thick including the implant and surrounding tissue, were cut with a Reichert-Jung Polycut E microtome (Leica, Heidelberg, Germany), collected on superfrost-plus slides for histology, deplasticized with 2-methoxyethyl acetate (Sigma-Aldrich Canada Ltd, ON, Canada), rehydrated with decreasing concentrations of ethanol and stained according to the Goldner’s trichrome protocol. Goldner’s trichrome stains mineralized bone in green and unmineralized bone (osteoid) in orange/red color. Histological observations were carried out with an Axiophot light microscope (Carl Zeiss, Oberkochen, Germany).
Figure 2. X-ray micrograph showing the surgical position of the two holes that were drilled through the periosteum and across the bone cortex.
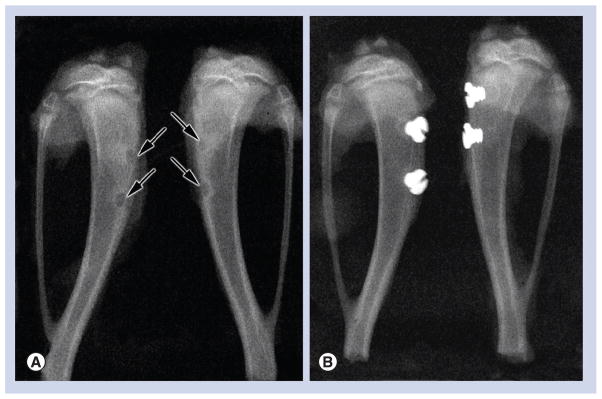
(A) Control animals consisted of an empty hole (arrows), without placement of an implant. (B) Two Ti6Al4V machined screw-shaped implants were placed in one tibia, while the other received two nanotextured implants.
Measurements & statistical analysis
Goldner’s trichrome stained sections were photographed and 12 bone areas in each group were analyzed. A 250-μm square was drawn around the implant or in the empty hole; green pixels were picked up as a bone tissue using imaging software (Photoshop CS4; Adobe, CA, USA). These pixels were translated into the bone area and expressed by the ratio of total tissue area in the 250-μm square. The length of bone–implant contact was expressed by the total length of green pixels on the implant–tissue surface, and demonstrated by the ratio of total implant–tissue surface length in the 250-μm square. Statistical differences of bone area around two different implants and in the empty hole were examined using the Kruskal–Wallis one-way analysis of variance. A Mann–Whitney U test was also used to statistically compare the bone–implant contact between nanotextured and machined-surface implant groups; p < 0.01 was considered significant.
Results
Surface characteristic of Ti alloy implants by SEM
As previously reported [16], SEM examination confirmed that surface treatment of Ti-6Al-4V screw-shaped implants with the H2SO4/H2O2 oxidative solution created a nanopatterned surface with uniformly distributed pores of approximately 20 nm in size (Figure 1).
Histology & histomorphometric analysis at days 3 & 5
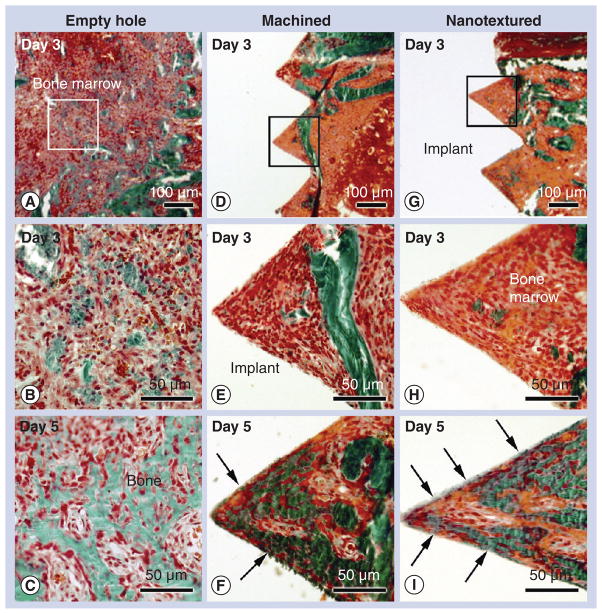
For all animals, healing was uneventful following implant installation. No sign of infection or inflammation was noticed at the surgical site and all implants were stable. Histological sections stained with Goldner’s trichrome revealed that as early as 3 days post-surgery, in the empty hole group, newly formed bone was noted within the bone marrow cavity (Figure 3A & B) and almost completely filled the surgical site by day 5 (Figure 3C). The presence of residual bone debris produced during drilling and implantation of machined (Figure 3D & e) and nanotextured screws (Figure 3g & H) was also noted in the bone marrow cavity. However, new bone formation was not evident at this time point for both types of implants. By day 5, there was an increase in the amount of bone forming around both machined (Figure 3F) and nanotextured screw-shaped implants (Figure 3i). Direct bone contact with the implant surface was clearly observed in nanotextured implants (Figure 3i), while it was only occasionally noted in machined implants (Figure 3F).
Figure 3. Histology of bone formation in an empty hole and around machined and nanotextured implants.
Light microscope images of calcified sections stained with Goldner-trichrome of the tissue (A, B & C) formed in an empty hole, and (D, E & F) around machined and (G, H & I) nanotextured screw-shaped implants at (A, B, D, E, G & H) day 3 and (C, F & I) 5 post-surgery. With time, there is an increase in bone formation in the marrow at the surgical site left empty (empty hole) as well as around either type of implant. At day 3, bone formation was hardly noted around both types of implants. At 5 days postimplantation, bone–implant contact (arrows) is more advanced around nanotextured implants (I) than machined implants (F). (B, E & H) High-magnification of the boxed areas in (A), (D) and (G), respectively.
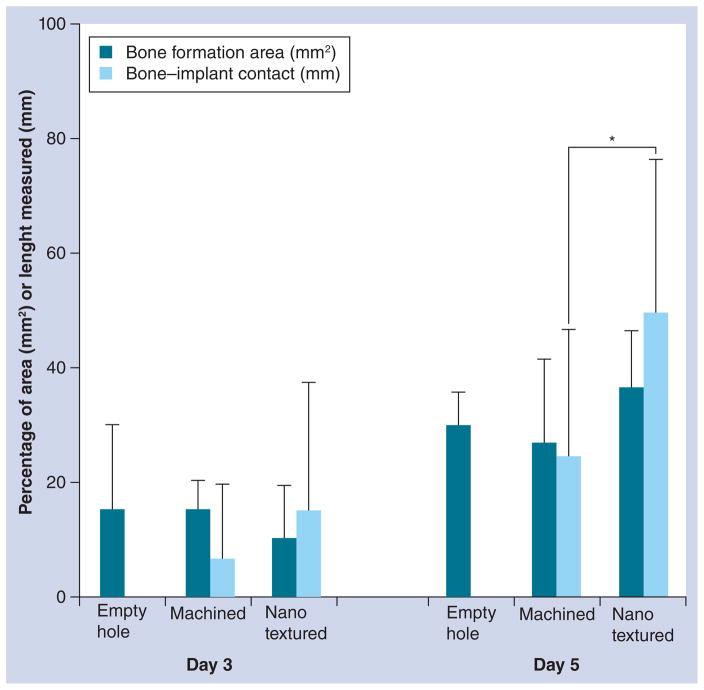
Histomorphometric analysis did not reveal any statistical difference in the bone formation area in empty hole, machined and nanotextured implants at days 3 and 5 (Figure 4). At day 3, no difference of bone formation and bone–implant contact was measured between the machined and nanotextured implant. However, by day 5, the bone–implant contact was significantly increased in nanotextured implants. The high standard deviations measured are probably related to the variability in bone formation in the various regions along the implant. However, statistical analyses validated the differences in bone–implant contact observed.
Figure 4. Histomorphometry of bone formation in empty hole, and around machined and nanotextured implants.
The bone formation area in an empty hole, and around machined and nanotextured implants showed no significant difference at 3 or 5 days post-surgery (one-way analysis of variance test). However, bone–implant contact in the nanotextured implants was significantly increased compared with that in the machined implants. Error bars show standard deviations.
*p < 0.05 by Mann–Whitney U test.
Gene expression profile at days 3 & 5
We examined the global gene expression profiles in RNA pools from the healing tissue harvested in an empty hole and around machined and nanotextured screw-shaped implants, at both days 3 and 5 post-surgery. On both days, stable nanotextured screws elicited a different gene expression profile in the healing tissue compared with machined-surface screws and the empty hole. A detailed list of differentially expressed genes for both surfaces and time points is presented in Supplementary TAbles 1–6 (see online, www.futuremedicine.com/doi/suppl/10.2217/NNM.12.167).
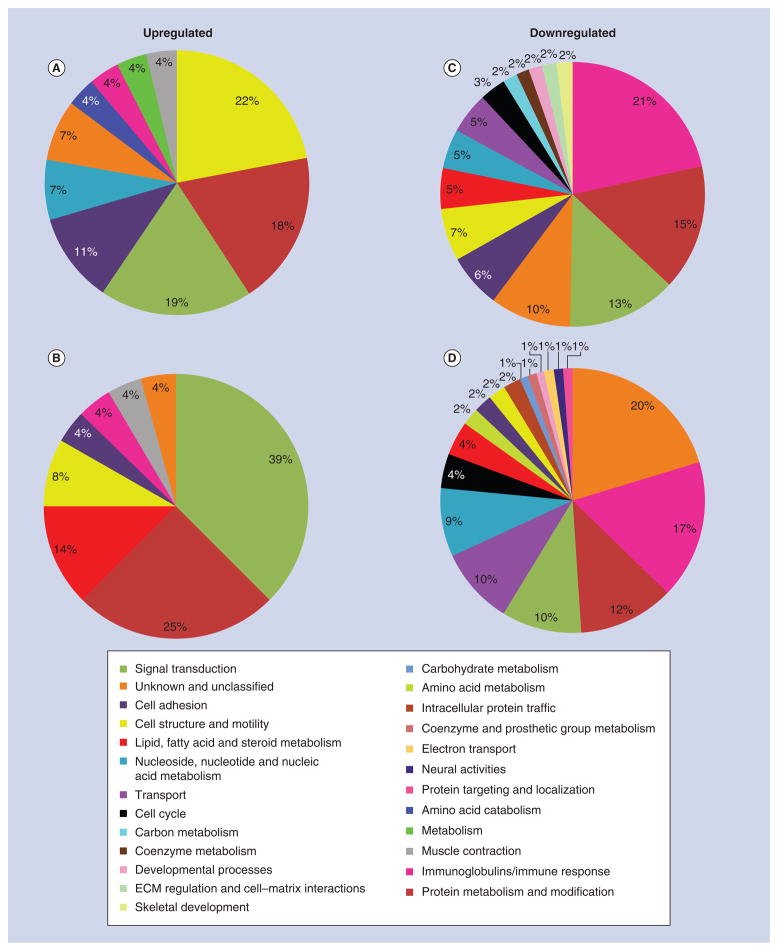
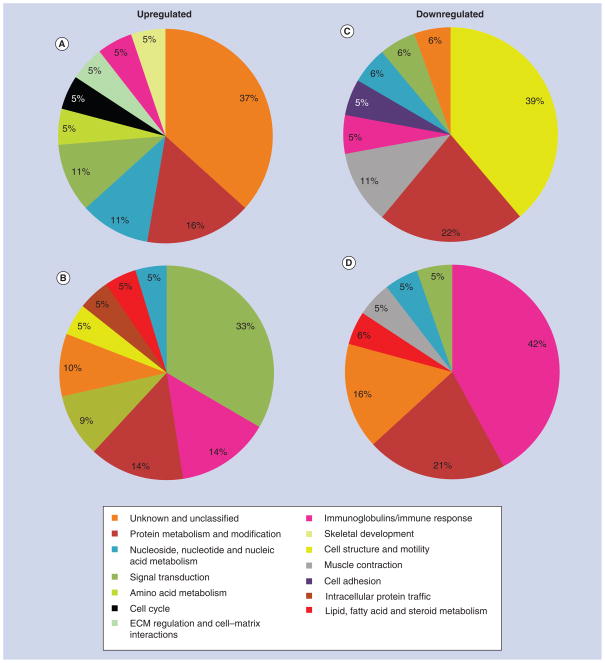
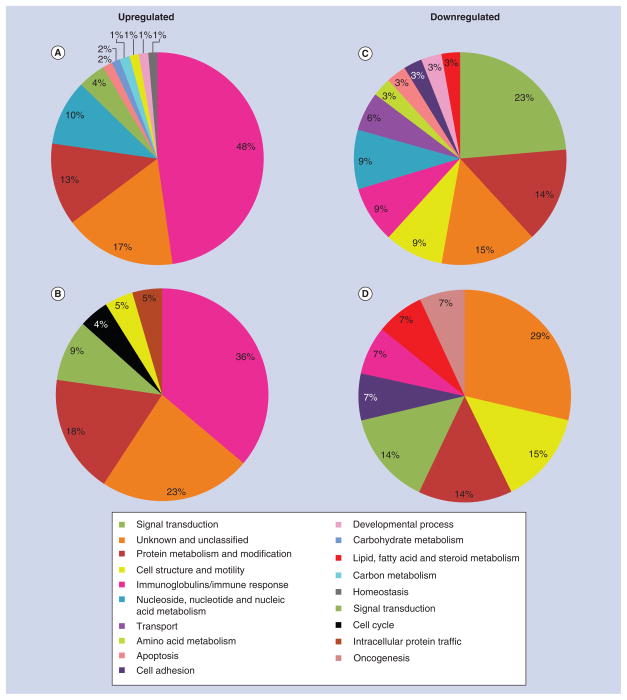
Since the identification of individual genes conveys limited information on how surface roughness affects interfacial tissue healing, differentially expressed genes were classified into various biological processes in order to assess their functional significance (Figures 5–7). The proportional distribution of up-(Figures 5A & B, 6A & B, 7A & B) and down-regulated (Figures 5C & D, 6C & D, 7C & D) genes in each process is illustrated for day 3 (Figure 5) and 5 (Figure 6) post-surgery.
Figure 5. Gene expression profile of tissue healing at day 3 around machined and nanotextured implants as compared with an empty hole.
The percentage distribution of biological process ontologies identified for statistically significant genes (p < 0.05) differentially upregulated (A & B) and downregulated (C & D) between nanotextured implants versus empty hole (A & C), and machined implants versus empty hole (B & D) at day 3 post-surgery.
ECM: Extracellular matrix.
Figure 7. Comparative gene expression profile of tissue healing at day 3 and 5 around machined and nanotextured implants.
The percentage distribution of biological process ontologies identified for statistically significant genes (p < 0.05) differentially upregulated (A & B) and downregulated (C & D) between nanotextured versus machined implants at day 3 (A & C) and 5 (B & D) post-surgery.
ECM: Extracellular matrix.
Figure 6. Gene expression profile of tissue healing at day 5 around machined and nanotextured implants as compared with an empty hole.
The percentage distribution of biological process ontologies identified for statistically significant genes (p < 0.05) differentially upregulated (A & B) and downregulated (C & D) between nanotextured implants versus empty hole (A & C), and machined implants versus empty hole (B & D) at day 5 post-surgery.
To identify potential local signaling pathways associated with tissue healing response around nanotextured and machined implants and in an empty hole, we analyzed our microarray expression data using GenMAPP and results are listed in Tables 1–5. These results indicate that different pathways have been activated with the placement of nanotextured and machined implants.
Table 1.
Local pathways obtained for candidate genes differentially expressed (probability interval = 0.9) in nanotextured implants in comparison with empty hole at day 3 (541 candidate genes).
| GenMAPP name | Genes changed (n) | Gene symbols | Average fold difference |
|---|---|---|---|
| Urea cycle and metabolism of amino groups | 4 | Arg1/Ckb/Ckm/Gatm | 6.1 |
| Striated muscle contraction | 9 | Acta1/Actn3/Mybpc2/Myh7/Tmod1/Tnnc2/Tnni2/Tpm1/Ttn | 3.8 |
| Endochondral ossification | 5 | Acan/Col2a1/Sox6/Stat4/Timp3 | 3.2 |
| Statin pathway | 3 | Abca1/Apoc1/Apoe | 2.3 |
| Matrix metalloproteinases | 6 | Mmp12/Mmp3/Mmp7/Mmp8/Timp1/Timp3 | 1.9 |
| Complement and coagulation cascades | 5 | A2m/C2/C6/F5/Serpine1 | 0.8 |
| Myometrial relaxation and contraction pathways | 12 | Acta1/Cxcr7/Gucy1a3/Igfbp6/Mylk2/Prkar2b/Prkcg/Prkcq/Prkcz/Ramp2/Rgs18/Rxfp1 | 0.0 |
| Blood clotting cascade | 3 | F5/Serpinb2/Serpine1 | −0.9 |
| Type II interferon signaling (IFN-γ) | 4 | Cxcl10/Oas1a/Oas1k/Stat4 | −1.2 |
| DNA replication | 4 | Cdc7/Cdt1/Mcm5/Orc1l | −1.8 |
| IL-7 signaling pathway | 5 | Cbl/Foxo3/Il7r/Rb1/Stat4 | −1.9 |
| Cell cycle | 6 | Ccne2/Cdc7/Cdh1/Mcm5/Orc1l/Rb1 | −1.9 |
| Heme biosynthesis | 3 | Cpox/Hmbs/Uros | −2.1 |
GenMAPP: Gene Map Annotator and Pathway Profiler.
Table 5.
Local pathways obtained for candidate genes differentially expressed (probability interval = 0.9) in nanotextured implants in comparison with machined implants at day 5 (165 candidate genes).
| MAPP name | Genes changed (n) | Gene symbols | Average-fold difference |
|---|---|---|---|
| TGF-β signaling pathway | 3 | Serpine1/Wnt1/Zeb2 | 0.4 |
GenMAPP: Gene Map Annotator and Pathway Profiler.
Discussion & conclusion
Biochemical signals and physicochemical cues both influence the cellular response to a biomaterial at the site of implantation [28,29]. Learning how to best integrate these two contributions is, therefore, essential to optimize tissue repair and even achieve regeneration. Although several in vitro studies have been carried out on the benefits of nanostructured surfaces on the biological response to implants [5], investigating the relevance of such surfaces in the complex biological environment of the body, where implants are exposed to multiple cell types that may not all respond in the same way to a given surface cue needs to be defined. Moreover, while whole-genome expression profiles of healing bone around microtextured implants have just recently been reported [30], that of next-generation nanotextured surfaces remains to be addressed. Data from this combined histomorphometric and gene expression study show that nanotextured surfaces lead to changes in expression of gene sets at the bone–implant interface that result in differences in bone healing that favor implant stability. Moreover, they provide insight into the molecular mechanisms involved in osseointegration of implants and on the response to surface topography. Importantly, all of our analyses were carried out on calcified tissues from which the implants were not removed. This avoided tissue damage, which normally occurs when an implant is pulled out, and therefore, to characterization of the healing process at the real tissue–implant interface.
A major distinction between our study and the recently reported microarray analyses of bone healing around microtextured dental implants placed in human patients [31] is the nature of the bone–implant contact. In the case of dental implants, they are usually placed in compact bone and are largely in contact, throughout their length, with old bone. Changes in gene expression around such implants would, therefore, probably include a strong bone remodelling component. In our case, most of the implant surface extended in the medullary cavity of the tibia, and hence the resulting gene expression profile most likely reflected bone induction events around the implant. In addition, because our sampling region was very close to the implant (0.45 mm), the changes observed are likely to relate to events at the tissue–implant interface where cell surface interactions actually take place.
One striking aspect of gene profiling studies following marrow ablation [32], mechanical loading of bone [33], and of our study, is that initially the genes that are up- or down-regulated are related to general biological processes such as protein metabolism and modification, signal transduction and immune response. In the case of the marrow ablation experiment [32] and with our nanostructured surfaces, note also the participation of several miscellaneous genes and/or those with undefined name/function. This suggests that the early bone healing response, in particular to implantable metals, may be more complex than so far suspected and probably initially involves general healing genes that will eventually be supplanted by osteogenic ones as bone builds up. Altogether, this suggests that focusing on standard pathways may only provide a limited picture, particularly at early time intervals when the fate of a biomaterial is determined.
Omar et al. compared the expression of selected proinflammatory cytokines, chemokines, adhesion molecules and bone formation and resorption markers at various time points following the implantation in rat tibiae of machined-surfaced and anodically oxidized Ti implants [34–36]. They concluded that the microtexture generated by their anodization process stimulates the recruitment and adhesion of cells that are crucial for regenerative processes at implant surfaces. In particular, they note that microtexture elicits a reduced inflammatory response. In the case of our nanotextured implants, there is a major modulation of the immunoglobulin and immune response gene category, with some genes undergoing downregulation while others are upregulated. The screening and identification of these up- and down-regulated genes will be validated using quantitative PCR in future studies. Thus, a better understanding of the temporally adapted control of the various aspects of the inflammatory process may lead to the rational design of surfaces that will optimize healing and new bone formation around implants.
In conclusion, our study provides the first integrated histomorphometric and molecular profile of the early bone healing events around implants with machined as compared with nanostructured surfaces. The data show that a nanoporous Ti alloy surface unquestionably has a major effect on how the body responds to the implant. The data also point to a number of potential candidate genes, so far unsuspected, that may help us understand how nanotexture influences local and systemic aspects of the tissue healing response. Recent literature from various laboratories and using different models indicates that altering the physicochemical properties of the surface of various types of biomaterials influences the activity of several cell types [5,37,38]. Most of these studies [37,38] are in vitro and will need to be validated in the complex environment of the body.
Future perspective
In the years to come, one can expect that novel generations of implants will be available that will have rationally designed surfaces capable of providing signaling cues to the surrounding environment in order to modulate cell activity at tissue–implant interface. These surfaces will be capable of promoting bone healing and regeneration, to improve implant integration. These innovations are needed to address the challenges of a demographically ageing population with compromised bone status.
Table 2.
Local pathways obtained for candidate genes differentially expressed (probability interval = 0.9) in machined implants in comparison with empty hole at day 3 (466 candidate genes).
| GenMAPP name | Genes changed (n) | Gene symbols | Average fold difference |
|---|---|---|---|
| Retinol metabolism | 3 | Cd36/Crabp2/RGD1565355 | −0.6 |
| Senescence and autophagy | 4 | Mll1/Rb1/Serpinb2/Serpine1 | −1.0 |
| IL-6 signaling pathway | 6 | Btk/Fes/Foxo3/Gab1/Rb1/Stat4 | −2.1 |
| Delta–notch signaling pathway | 5 | Adam10/Fhl1/Pcaf/Skp2/Yy1 | −2.1 |
| Cell cycle | 5 | Atm/Ccne2/Orc2l/Rb1/Skp2 | −2.4 |
| G1 to S cell cycle control | 5 | Atm/Ccne2/Ccng2/Orc2l/Rb1 | −2.3 |
| IL-7 signaling pathway | 4 | Foxo3/Il7r/Rb1/Stat4 | −2.5 |
GenMAPP: Gene Map Annotator and Pathway Profiler.
Table 3.
Local pathways obtained for candidate genes differentially expressed (probability interval 0.9) in machined implants in comparison with an empty hole at day 5 (205 candidate genes).
| GenMAPP name | Genes changed (n) | Gene symbols | Average fold difference |
|---|---|---|---|
| Apoptosis | 4 | Gzmb/Irf7/Nfkb1/Prf1 | 2.0 |
| Selenium metabolism selenoproteins | 3 | Nfkb1/Selenbp1/Sla | 1.9 |
GenMAPP: Gene Map Annotator and Pathway Profiler.
Table 4.
Local pathways obtained for candidate genes differentially expressed (probability interval = 0.9) in nanotextured implants in comparison with machined implants at day 3 (412 candidate genes).
| GenMAPP name | Genes changed (n) | Gene symbols | Average fold difference |
|---|---|---|---|
| Matrix metalloproteinases | 5 | Mmp12/Mmp3/Mmp7/Mmp8/Timp3 | −1.0 |
| Striated muscle contraction | 15 | Acta1/Actn2/Actn3/Mybpc2/Myh3/Myh7/Myl1/Myl3/Myl9/Tmod1/Tnnc2/Tnni2/Tnnt3/Tpm1/Ttn | −3.1 |
| Endochondral ossification | 5 | Acan/Col2a1/Sox6/Tgfb2/Timp3 | −6.8 |
GenMAPP: Gene Map Annotator and Pathway Profiler.
Executive summary.
The data show that a nanoporous titanium alloy surface unquestionably has a major effect on how the body responds to the implant.
Different gene sets are expressed during healing of the surgical bone defect and, around machined-surface and nanotextured titanium alloy implants.
The difference in gene expression leads to a significant increase in the bone–implant contact in nanotextured titanium alloy implants compared with machined-surface ones at day 5 following surgery.
While a number of genes related to general biological processes such as protein metabolism and modification, signal transduction and immune response are expressed during bone healing around an implant, the study highlights a number of unsuspected candidate genes for validation and emphasis in future work.
In studies of healing around implants, focusing on standard pathways may provide a limited picture, particularly at early time intervals when the fate of a biomaterial is determined.
Acknowledgments
The authors acknowledge the services from Génome Québec Innovation Center at McGill University for performing the DNA microarray analysis and Genexanalysis for the service with quantitative analysis of data.
Footnotes
Ethical conduct of research
The authors state that they have obtained appropriate institutional review board approval or have followed the principles outlined in the Declaration of Helsinki for all human or animal experimental investigations. In addition, for investigations involving human subjects, informed consent has been obtained from the participants involved.
Financial & competing interests disclosure
This work was supported by Canadian Institutes of Health Research, The Network for Oral and Bone Health Research and NIH EB000504-04 grants. The authors have no other relevant affiliations or financial involvement with any organization or entity with a financial interest in or financial conflict with the subject matter or materials discussed in the manuscript apart from those disclosed.
No writing assistance was utilized in the production of this manuscript.
References
Papers of special note have been highlighted as:
▪ of interest
▪▪ of considerable interest
- 1.Albrektsson T, Wennerberg A. Oral implant surfaces: part 2 review focusing on clinical knowledge of different surfaces. Int J Prosthodont. 2004;17(5):544–564. [PubMed] [Google Scholar]
- 2.Shalabi MM, Gortemaker A, Van’t Hof MA, Jansen JA, Creugers NH. Implant surface roughness and bone healing: a systematic review. J Dent Res. 2006;85(6):496–500. doi: 10.1177/154405910608500603. [DOI] [PubMed] [Google Scholar]
- 3.Brunski JB, Puleo DA, Nanci A. Biomaterials and biomechanics of oral and maxillofacial implants: current status and future developments. Int J Oral Maxillofac Implants. 2000;15(1):15–46. [PubMed] [Google Scholar]
- 4.Liu H, Webster TJ. Nanomedicine for implants: a review of studies and necessary experimental tools. Biomaterials. 2006;28(2):354–369. doi: 10.1016/j.biomaterials.2006.08.049. [DOI] [PubMed] [Google Scholar]
- 5▪.Variola F, Brunski JB, Orsini G, Tambasco de OP, Wazen R, Nanci A. Nanoscale surface modifications of medically relevant metals: state-of-the art and perspectives. Nanoscale. 2011;3(2):335–353. doi: 10.1039/c0nr00485e. Discusses state-of-the-art of nanotechnology-based approaches adopted to modify the surface of metals. [DOI] [PMC free article] [PubMed] [Google Scholar]
- 6.Lord MS, Modin C, Foss M, et al. Monitoring cell adhesion on tantalum and oxidised polystyrene using a quartz crystal microbalance with dissipation. Biomaterials. 2006;27(26):4529–4537. doi: 10.1016/j.biomaterials.2006.04.006. [DOI] [PubMed] [Google Scholar]
- 7.Raimondo T, Puckett S, Webster TJ. Greater osteoblast and endothelial cell adhesion on nanostructured polyethylene and titanium. Int J Nanomed. 2010;5:647–652. doi: 10.2147/IJN.S13047. [DOI] [PMC free article] [PubMed] [Google Scholar]
- 8.Martin JY, Schwartz Z, Hummert TW, et al. Effect of titanium surface roughness on proliferation, differentiation, and protein synthesis of human osteoblast-like cells (MG63) J Biomed Mater Res. 1995;29:389–401. doi: 10.1002/jbm.820290314. [DOI] [PubMed] [Google Scholar]
- 9.Curtis AS, Gadegaard N, Dalby MJ, Riehle MO, Wilkinson CD, Aitchison G. Cells react to nanoscale order and symmetry in their surroundings. IEEE Trans Nanobiosci. 2004;3(1):61–65. doi: 10.1109/tnb.2004.824276. [DOI] [PubMed] [Google Scholar]
- 10.Dalby MJ, McCloy D, Robertson M, et al. Osteoprogenitor response to semi-ordered and random nanotopographies. Biomaterials. 2006;27(15):2980–2987. doi: 10.1016/j.biomaterials.2006.01.010. [DOI] [PubMed] [Google Scholar]
- 11.Pennisi CP, Dolatshahi-Pirouz A, Foss M, et al. Nanoscale topography reduces fibroblast growth, focal adhesion size and migration-related gene expression on platinum surfaces. Coll Surf B Biointerfaces. 2011;85(2):189–197. doi: 10.1016/j.colsurfb.2011.02.028. [DOI] [PubMed] [Google Scholar]
- 12.Boyan BD, Bonewald LF, Paschalis EP, et al. Osteoblast-mediated mineral deposition in culture is dependent on surface microtopography. Calcif Tissue Int. 2002;71(6):519–529. doi: 10.1007/s00223-001-1114-y. [DOI] [PubMed] [Google Scholar]
- 13.Mendonca G, Mendonca DB, Simoes LG, et al. Nanostructured alumina-coated implant surface: effect on osteoblast-related gene expression and bone-to-implant contact in vivo. Int J Oral Maxillofac Implants. 2009;24(2):205–215. [PubMed] [Google Scholar]
- 14.Palmquist A, Emanuelsson L, Branemark R, Thomsen P. Biomechanical, histological and ultrastructural analyses of laser micro- and nano-structured titanium implant after 6 months in rabbit. J Biomed Mater Res B Appl Biomater. 2011;97(2):289–298. doi: 10.1002/jbm.b.31814. [DOI] [PubMed] [Google Scholar]
- 15.Campbell TM, Wong WT, Mackie EJ. Establishment of a model of cortical bone repair in mice. Calcif Tissue Int. 2003;73(1):49–55. doi: 10.1007/s00223-002-2120-4. [DOI] [PubMed] [Google Scholar]
- 16.Nanci A, Wuest JD, Péru L, et al. Chemical modification of titanium surfaces for covalent attachment of biological molecules. J Biomed Mater Res. 1998;40:324–335. doi: 10.1002/(sici)1097-4636(199805)40:2<324::aid-jbm18>3.0.co;2-l. [DOI] [PubMed] [Google Scholar]
- 17.Richert L, Vetrone F, Yi JH, et al. Surface nanopatterning to control cell growth. Adv Mater. 2008;20(8):1488–1492. [Google Scholar]
- 18.Variola F, Yi JH, Richert L, Wuest JD, Rosei F, Nanci A. Tailoring the surface properties of Ti6Al4V by controlled chemical oxidation. Biomaterials. 2008;29(10):1285–1298. doi: 10.1016/j.biomaterials.2007.11.040. [DOI] [PubMed] [Google Scholar]
- 19.Vetrone F, Variola F, Tambasco de OP, et al. Nanoscale oxidative patterning of metallic surfaces to modulate cell activity and fate. Nano Lett. 2009;9(2):659–665. doi: 10.1021/nl803051f. [DOI] [PubMed] [Google Scholar]
- 20.Yi JH, Bernard C, Variola F, et al. Characterization of a bioactive nanotextured surface created by controlled chemical oxidation of titanium. Surf Sci. 2006;600(19):4613–4621. [Google Scholar]
- 21.Chiesa R, Giavaresi G, Fini M, et al. In vitro and in vivo performance of a novel surface treatment to enhance osseointegration of endosseous implants. Oral Surg Oral Med Oral Pathol Oral Radiol Endod. 2007;103(6):745–756. doi: 10.1016/j.tripleo.2006.09.025. [DOI] [PubMed] [Google Scholar]
- 22.Novak JP, Sladek R, Hudson TJ. Characterization of variability in large-scale gene expression data: implications for study design. Genomics. 2002;79(1):104–113. doi: 10.1006/geno.2001.6675. [DOI] [PubMed] [Google Scholar]
- 23.Novak JP, Kim SY, Xu J, et al. Generalization of DNA microarray dispersion properties: microarray equivalent of t-distribution. Biol Direct. 2006;1:27. doi: 10.1186/1745-6150-1-27. [DOI] [PMC free article] [PubMed] [Google Scholar]
- 24.Guilbault C, Novak JP, Martin P, et al. Distinct pattern of lung gene expression in the Cftr-KO mice developing spontaneous lung disease compared with their littermate controls. Physiol Genomics. 2006;25(2):179–193. doi: 10.1152/physiolgenomics.00206.2005. [DOI] [PubMed] [Google Scholar]
- 25.Baldi P, Long AD. A Bayesian framework for the analysis of microarray expression data: regularized t-test and statistical inferences of gene changes. Bioinformatics. 2001;17(6):509–519. doi: 10.1093/bioinformatics/17.6.509. [DOI] [PubMed] [Google Scholar]
- 26.Nanci A, Wazen RM, Zalzal S, et al. A tracer study with systemically and locally administered dinitrophenylated osteopontin. J Histochem Cytochem. 2004;52(12):1591–1600. doi: 10.1369/jhc.4A6452.2004. [DOI] [PubMed] [Google Scholar]
- 27.Laboux O, Ste-Marie LG, Glorieux FH, Nanci A. Quantitative immunogold labeling of bone sialoprotein and osteopontin in methylmethacrylate-embedded rat bone. J Histochem Cytochem. 2003;51(1):61–67. doi: 10.1177/002215540305100108. [DOI] [PubMed] [Google Scholar]
- 28.Morra M. Biochemical modification of titanium surfaces: peptides and ECM proteins. Eur Cell Mater. 2006;12:1–15. doi: 10.22203/ecm.v012a01. [DOI] [PubMed] [Google Scholar]
- 29.Lord MS, Foss M, Besenbacher F. Influence of nanoscale surface topography on protein adsorption and cellular response. Nano Today. 2010;5(1):66–78. [Google Scholar]
- 30▪.Donos N, Retzepi M, Wall I, Hamlet S, Ivanovski S. In vivo gene expression profile of guided bone regeneration associated with a microrough titanium surface. Clin Oral Implants Res. 2011;22(4):390–398. doi: 10.1111/j.1600-0501.2010.02105.x. Differential gene expression profiling of osseointegration associated with a chemically modified hydrophilic rough surface in a human model. [DOI] [PubMed] [Google Scholar]
- 31.Donos N, Hamlet S, Lang NP, et al. Gene expression profile of osseointegration of a hydrophilic compared with a hydrophobic microrough implant surface. Clin Oral Implants Res. 2011;22(4):365–372. doi: 10.1111/j.1600-0501.2010.02113.x. [DOI] [PubMed] [Google Scholar]
- 32.Wise JK, Sena K, Vranizan K, et al. Temporal gene expression profiling during rat femoral marrow ablation-induced intramembranous bone regeneration. PLoS One. 2010;5(10):e12987. doi: 10.1371/journal.pone.0012987. [DOI] [PMC free article] [PubMed] [Google Scholar]
- 33.Mantila Roosa SM, Liu Y, Turner CH. Gene expression patterns in bone following mechanical loading. J Bone Miner Res. 2011;26(1):100–112. doi: 10.1002/jbmr.193. [DOI] [PMC free article] [PubMed] [Google Scholar]
- 34.Omar O, Lenneras M, Svensson S, et al. Integrin and chemokine receptor gene expression in implant-adherent cells during early osseointegration. J Mater Sci Mater Med. 2010;21(3):969–980. doi: 10.1007/s10856-009-3915-x. [DOI] [PubMed] [Google Scholar]
- 35.Omar O, Svensson S, Zoric N, et al. Invivo gene expression in response to anodically oxidized versus machined titanium implants. J Biomed Mater Res A. 2010;92(4):1552–1566. doi: 10.1002/jbm.a.32475. [DOI] [PubMed] [Google Scholar]
- 36.Omar OM, Lenneras ME, Suska F, et al. The correlation between gene expression of proinflammatory markers and bone formation during osseointegration with titanium implants. Biomaterials. 2011;32(2):374–386. doi: 10.1016/j.biomaterials.2010.09.011. [DOI] [PubMed] [Google Scholar]
- 37▪▪.Zhang L, Webster TJ. Poly-lactic-glycolic-acid surface nanotopographies selectively decrease breast adenocarcinoma cell functions. Nanotechnology. 2012;23(15):155101. doi: 10.1088/0957-4484/23/15/155101. Effect of poly(lactic-co-glycolic acid) surface nanotopography on cancer cell functions. [DOI] [PubMed] [Google Scholar]
- 38.Zhang L, Webster TJ. Decreased lung carcinoma cell functions on select polymer nanometer surface features. J Biomed Mater Res A. 2012;100(1):94–102. doi: 10.1002/jbm.a.33217. [DOI] [PubMed] [Google Scholar]
Websites
- 101.GenexAnalysis. http://genexanalysis.net.
- 102.Panther Classification System. www.pantherdb.org.
- 103.Gene Map Annotator and Pathway Profiler. GO-Elite Pathway Analysis. www.genmapp.org/go_elite.


