Abstract
Treatment with histone deacetylase inhibitors (HDACI) results in potent cytotoxicity of a variety of cancer cell types, and these drugs are used clinically to treat hematological tumors. They are known to repress the transcription of ERBB2 and many other oncogenes, but little is known about this mechanism. Using global run-on sequencing (GRO-seq) to measure nascent transcription, we find that HDACI cause transcriptional repression by blocking RNA polymerase II elongation. Our data show that HDACI preferentially repress the transcription of highly expressed genes as well as high copy number genes in HER2+ breast cancer genomes. In contrast, genes that are activated by HDACI are moderately expressed. We analyzed gene copy number in combination with microarray and GRO-seq analysis of expression level, in normal and breast cancer cells to show that high copy number genes are more likely to be repressed by HDACI than non-amplified genes. The inhibition of transcription of amplified oncogenes, which promote survival and proliferation of cancer cells, might explain the cancer-specific lethality of HDACI, and may represent a general therapeutic strategy for cancer.
Keywords: GRO-seq, transcription elongation, HDAC inhibition, oncogenes, amplicons
INTRODUCTION
Histone deacetylase inhibitors (HDACI) are a class of epigenetic cancer drugs used clinically to treat hematological malignancies that also show promise in treating solid tumors (1, 2). Their anti-cancer activities include inducing differentiation, cell cycle arrest and apoptosis, and decreasing angiogenesis (3, 4). However, previous studies have not sufficiently resolved the basis for the cancer selective effects of HDACI.
These drugs block the activity of the zinc-dependent histone deacetylases (HDAC). There are 11 isoforms of these HDAC, and pan-specific inhibitors like trichostatin A (TSA) and suberoylanilide hydoxamic acid (SAHA, also known as Vorinostat) have been reported to have little isoform specificity (5, 6). By blocking HDAC activity, HDACI treatment results in the hyper-acetylation of lysine residues in histones and non-histone proteins. Histone acetylation is associated with active transcription, so HDACI are believed to function by derepressing silent genes through the inhibition of HDAC activities found within many transcription corepressor complexes (7, 8). Transcriptional activation contributes to the anti-cancer effects of these drugs by inducing pro-apoptotic and differentiation programs that become epigenetically silenced during tumorigenesis (9–11).
The transcriptional repression that results from inhibition of HDAC is far less understood than the transcriptional activation. Curiously, the expression of many oncogenes that are highly expressed in cancers, such as ERBB2, MITF, MYC, MYCN, EGFR and others, are significantly reduced by HDACI, and only in tumor cells (12–15). However, previous studies have not revealed the underlying mechanism of repression. These oncogenes are often found in amplicons, which arise from multiple duplications of particular chromosomal segments, and are found in many types of cancers. Therefore, we hypothesized that transcriptional repression induced by HDACI may be more common in highly expressed genes and genes within amplicons than in moderately expressed or normal copy number genes. Amplicons increase the transcriptional output of the genes they contain; this often drives cancer cell survival and growth (16). The ability to selectively repress the transcription of highly expressed genes within amplicons pharmacologically would be extremely powerful in treating cancers whose survival usually depends on the ability to highly express oncogene transcripts.
In this study, we demonstrate that HDAC inhibition in ERBB2-amplified breast cancer cells causes the preferential and direct transcriptional silencing of ERBB2. We establish that HDACI treatment prevents RNA polymerase II (RNAP) elongation and represses genes that are very highly expressed prior to drug treatment. Combining copy number and RNA transcript expression data, we find that HDACI are able to repress other amplified oncogenes, such as ERBB2 that are highly expressed and amplified in breast cancer genomes. These results point to the transcription elongation machinery as desirable targets for selectively silencing highly expressed oncogenes.
RESULTS
ERBB2 transcription is directly and selectively repressed by HDACI in breast cancer cells
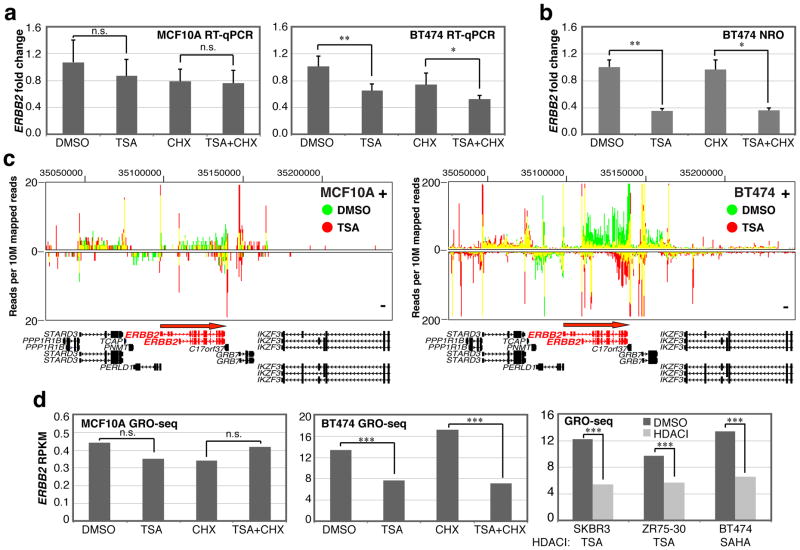
Previous studies demonstrated that the ERBB2 amplicon is silenced by HDACI in HER2+ breast cancer cells (17). Using reverse transcription quantitative PCR (RT-qPCR), we detected a modest, yet significant, repression of the ERBB2 gene in BT474 cells, an ERBB2-amplified breast cancer cell line, within four hours of a 500 nM TSA treatment (Figure 1a). A short-term treatment was chosen to define the primary transcriptional response to HDACI (10). Additionally, we determined that repression of ERBB2 occurs even in the presence of the protein synthesis inhibitor cycloheximide (CHX). Therefore, ERBB2 transcriptional repression is not caused by the increased de novo synthesis of a protein which blocks ERBB2 transcription after HDACI treatment. In contrast, ERBB2 is not repressed by TSA in MCF10A cells, a non-cancerous breast epithelial line that moderately expresses this gene (Figure 1a). By performing nuclear run-on (NRO) to directly measure nascent transcription, which rules out any effects that HDACI have been previously shown to have on transcript turnover (14), we determined that TSA treatment decreases the transcription of the ERBB2 gene in BT474, rather than increasing mRNA turnover (Figure 1b).
Figure 1.
ERBB2 amplicon repression by HDACI. (a) Fold change in ERBB2 transcript level in MCF10A and BT474 as determined by RT-qPCR in cells treated with DMSO, 500 nM TSA, 10 μg/mL CHX or both TSA and CHX for 4 hr. normalized to GAPDH (n = 6). (b) The amount of ERBB2 transcript detected by standard nuclear run-on (NRO) experiments analyzed by RT-qPCR and normalized to POLR2A. Error bars, s.d.; n.s. = not significant; * = P < 0.05; ** = P < 0.01 by two-tailed Student’s t tests. (c) GRO-seq reads at the ERBB2 locus upon DMSO (green) and TSA (red) treatment. Yellow lines represents overlapping signal between both conditions. Positive and negative strand directions are indicated, and the direction of transcription for ERBB2 is indicated with a red arrow in the positive strand direction. (d) ERBB2 GRO-seq RPKM before and after HDACI treatment (500nM TSA or 3 μM SAHA). *** = P < 10−16 log-likelihood ratio test.
Using global run-on sequencing (GRO-seq) to analyze nascent transcription across the entire genome, we confirmed that TSA treatment results in the selective repression of ERBB2 in BT474, but not in MCF10A (Figure 1c and 1d). Our GRO-seq analysis also confirms that CHX addition does not affect the transcriptional repression of ERBB2 in BT474 cells, as determined by the RPKM (reads per kilobase of gene per million mapped sequence reads) normalization method (18). We also detected repression of ERBB2 transcription by TSA using GRO-seq in SKBR3 and ZR75-30, two independently derived breast cancer cell lines, like BT474, that carry ERBB2 amplicons. Furthermore, we confirmed that SAHA represses ERBB2 transcription in BT474, suggesting that direct transcription repression of the ERBB2 amplicon is a common property of pan-specific HDACI (Figure 1d).
HDACI repress a common set of genes in breast cancer cells
Repressed genes (P < 10−16, log-likelihood ratio) from GRO-seq were analyzed to explore the characteristics of HDACI-repressed genes in breast cancer cells compared to normal cells. The number of TSA-repressed genes in BT474 that overlap with the repressed genes from the other breast cancer cells and SAHA-repressed genes in BT474 is almost two fold higher than those that overlap with TSA-repressed genes from the normal cell line, MCF10A (Supplementary Figure 1a).
To define the cancer specific repressed genes, the repressed genes were compared among the cancer cell lines. 734 genes were significantly repressed in all cancer cells (Supplementary Figure 1b). Among them, 365 genes are cancer-specific TSA-repressed genes, as they do not overlap with the repressed genes in MCF10A. 369 of 734 genes were repressed in both normal and cancer cells (Supplementary Figure 1c). Additionally, 208 of the 356 cancer-specific TSA-repressed genes are also repressed by SAHA (Supplementary Figure 1d).
To explore the characteristics of these HDACI-repressed genes, we analyzed these gene sets using functional analysis tools (GO analysis and functional analysis) provided in the DAVID bioinformatics database (http://david.abcc.ncifcrf.gov/) (19, 20). The genes repressed by TSA in all the cell lines examined are significantly associated with chromatin, chromosome and lumen organizations (Supplementary Table 1a). In contrast, the cancer specific TSA-repressed genes and the TSA- and SAHA-repressed genes are likely related to the regulation of transcription or gene expression (Supplementary Table 1b and 1c). Functional analysis also shows that cancer-specific repressed genes have a role in the regulation of transcription and alternative splicing (Supplementary Table S2).
HDACI-repressed genes are repressed through a direct mechanism
Since ERBB2 transcription is directly inhibited without requiring the synthesis of new proteins, we investigated if other transcriptionally blocked genes are directly repressed after TSA treatment in BT474 and MCF10A. In microarrays and GRO-seq, genes that are transcriptionally repressed by TSA (P < 0.05, Illumina BeadStudio package for microarray analysis, P < 10−16, log-likelihood ratio for GRO-seq) are often no longer repressed when CHX is added (Figure 2a and 2b). Conversely, in BT474, the transcription of a large number of TSA-repressed transcripts is still reduced even in the presence of CHX (Figure 2a and 2b). The vast majority of genes activated by TSA in both BT474 and MCF10A are still activated in the presence of CHX (Figure 2c and 2d). Therefore, while direct transcriptional activation by TSA treatment in the two cell lines is common, direct repression is more frequently seen in BT474 than in MCF10A cells.
Figure 2.
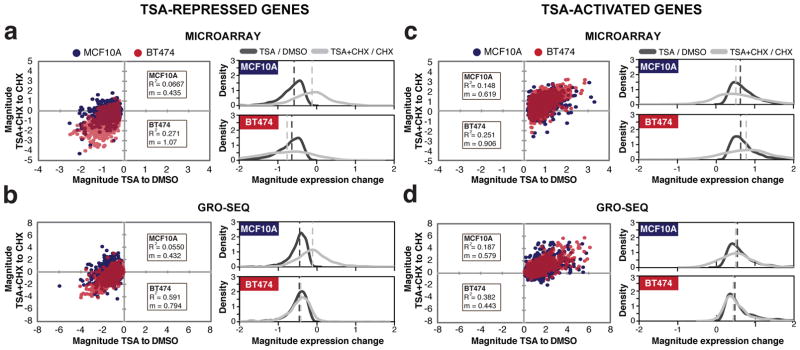
Transcriptional changes after TSA treatment when CHX is used to prevent indirect effects on transcription. The magnitude of expression change from genes with significant alterations in expression after TSA treatment (P < 0.01, Illumina BeadStudio p-value for microarray, and P < 10−16 log-likelihood ratio for GRO-seq) were plotted against their corresponding magnitude of expression change when CHX is present using repressed genes from (a) microarray data or (b) GRO-seq, and activated genes from (c) microarray data or (d) GRO-seq. The x-axes in the dot plots indicate the magnitude of transcriptional change induced by TSA treatment verses DMSO treatment, while the y-axes show the magnitude of change between treatment with TSA and CHX combined and CHX alone. Positive values indicate transcriptional activation, and negative values signify transcriptional repression. Expression changes in BT474 and MCF10A are indicated in red and purple-blue, respectively. To the right are density plots of the same data as in the dot plots. Vertical dashed lines indicate the median of the data. Magnitude = log10 (TSA/DMSO) or = log10 ((TSA+CHX)/CHX). R2 = correlation coefficient, m = slope of linear regression.
HDACI induce elongation pausing genome-wide
Transcription starts with the recruitment of RNAP to the transcription start site (TSS). Once initiated, RNAP often encounters an elongation block, but remains engaged (21). In order for transcription to proceed, the elongation phase of transcription must be induced. Transcriptional elongation is a key rate-limiting step for expression of many genes in the eukaryotic genome (22, 23). Looking at the pattern of GRO-seq reads at the ERBB2 locus in BT474 (Figure 1c), we observed that TSA treatment decreases transcription in the gene body, while transcription near the two ERBB2 promoters is not reduced. This suggests that TSA prevents transcription elongation.
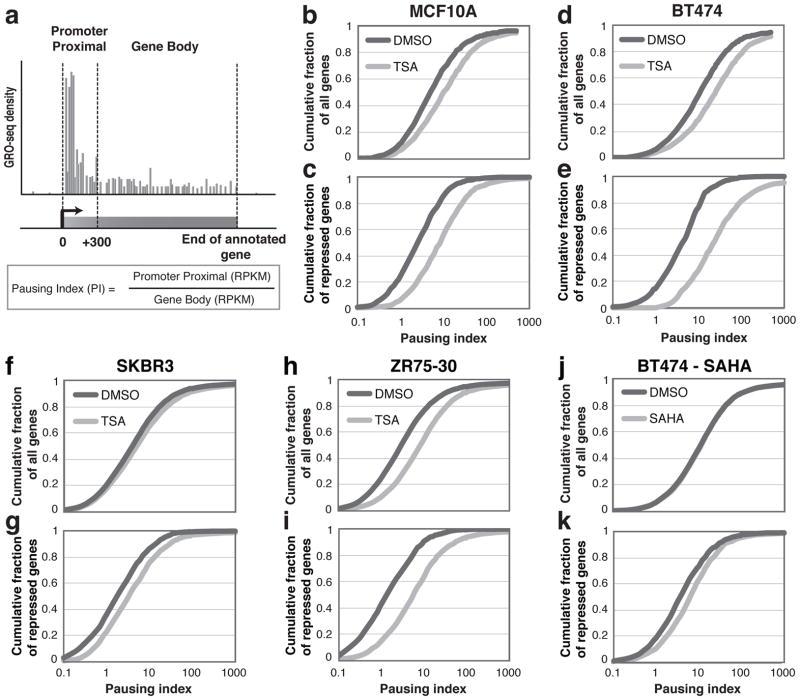
To determine whether HDACI inhibit transcription elongation across the genome, we assessed the extent of RNAP pausing with the “pausing index” (PI), calculated by dividing the GRO-seq read density in the promoter proximal region by that in the gene body (24) (Figure 3a). Overall, genes treated with TSA display higher PIs, and are therefore more paused, in both normal and cancer cell lines (Figure 3b, 3d, 3f, 3h, and Supplementary Figure 2a). By analyzing the PIs of the significantly (P < 10−16, log-likelihood ratio) repressed gene sets from GRO-seq, we determined that repressed genes exhibit much higher PIs after TSA or SAHA treatments compared to DMSO (Figure 3c, 3e, 3g, 3i, 3k, and Supplementary Figure 2b) and the difference in PI is much greater between DMSO and HDACI for repressed genes than all genes combined (Figure 3b – 3k). Activated transcripts (P < 10−16, log-likelihood ratio) do not show as drastic changes in pausing index upon HDACI treatment as do repressed transcripts (Supplementary Figure 3a and 3d).
Figure 3.
RNAP pausing analysis after HDACI treatment. (a) A schematic for defining the pausing index. Pausing index (PI) is calculated by dividing promoter proximal GRO-seq RPKM by gene body RPKM. The promoter proximal region is defined as between the transcription start site and 300 bp downstream. (b, d, f, h, j) Cumulative distribution plots of PI for all transcribed genes in (b) MCF10A, (d) BT474, (f) SKBR3 and (h) ZR75-30 treated by TSA, and in (j) BT474 treated by SAHA. (c, e, g, i, k) Cumulative distribution plots of PI for only repressed genes in the same cell lines. Genes with no expression in either the promoter or gene body region were excluded. See Supplementary Figure 2 for statistics.
Examination of the expression of a noncoding RNA that inhibits transcription elongation, 7SK (25, 26), shows that it is not significantly activated by TSA in all cell lines examined, nor are the 7SK-related RNAs (Supplementary Figure 4). Thus, HDACI-mediated transcriptional repression seems to result from blockades in elongation, likely through inhibition of protein or histone deacetylation events that are critical for efficient transcription elongation rather than inducing 7SK transcription.
Transcriptional repression results from a decrease in elongation without affecting initiation
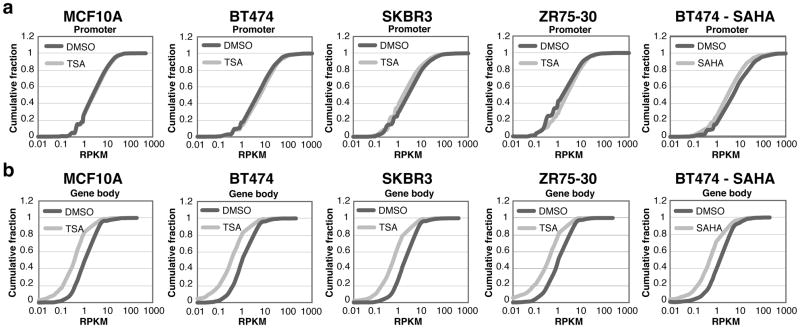
We further investigated whether increased transcriptional pausing results from HDACI-induced effects on transcription occurring near the promoter (initiation) or along the gene body (elongation). In all the cell lines tested, repressed genes show an increase or a very small change in promoter proximal GRO-seq tag density after TSA treatment (Figure 4a and Supplementary Figure 5a). The magnitude of the change resulting from TSA treatment in microarray expression when plotted against GRO-seq density at the promoter shows that changes in transcription initiation are correlated with transcriptional repression only in MCF10A, but not BT474 (Supplementary Figure 6a, 6b, 6e and 6f). Although the promoter densities of repressed transcripts in BT474 are not correlated with transcriptional output, TSA treatment still causes higher GRO-seq tag densities at the promoter, suggesting there is no reduction in transcriptional initiation upon TSA treatment in either cell line.
Figure 4.
Analysis of the promoter and the gene body of repressed genes after HDACI treatment. (a) Cumulative distribution plot of the GRO-seq RPKM in the promoter of repressed genes after treatment with DMSO and TSA or SAHA. (b) Cumulative distribution plot of the GRO-seq RPKM in the gene body of repressed genes after treatment with DMSO, TSA, or SAHA in the same cell lines. Dark grey lines represent DMSO treatment and light grey lines represent TSA or SAHA treatment. See Supplementary Figure 5 for statistics. Genes with no expression were excluded.
As TSA-induced transcriptional repression does not seem to be correlated with the GRO-seq density near promoters in BT474 cells, the reduction in the rate at which RNAP transitions into the productive elongation phase of transcription seems to be the primary basis for the TSA-driven repression of amplicons. Indeed, more extreme reductions in GRO-seq tag densities are consistently found within the gene bodies than the promoters of repressed genes in the TSA-treated cells as well as SAHA-treated BT474 cells (Figure 4 and Supplementary Figure 5b). In contrast, activated transcripts show increased transcription in their promoters and gene bodies (Supplementary Figure 3b and 3c). A strong positive correlation exists between transcript levels from magnitude of expression change from microarray and GRO-seq density in the gene body for both repressed and activated genes (Supplementary Figure 6c, 6d, 6g and 6h).
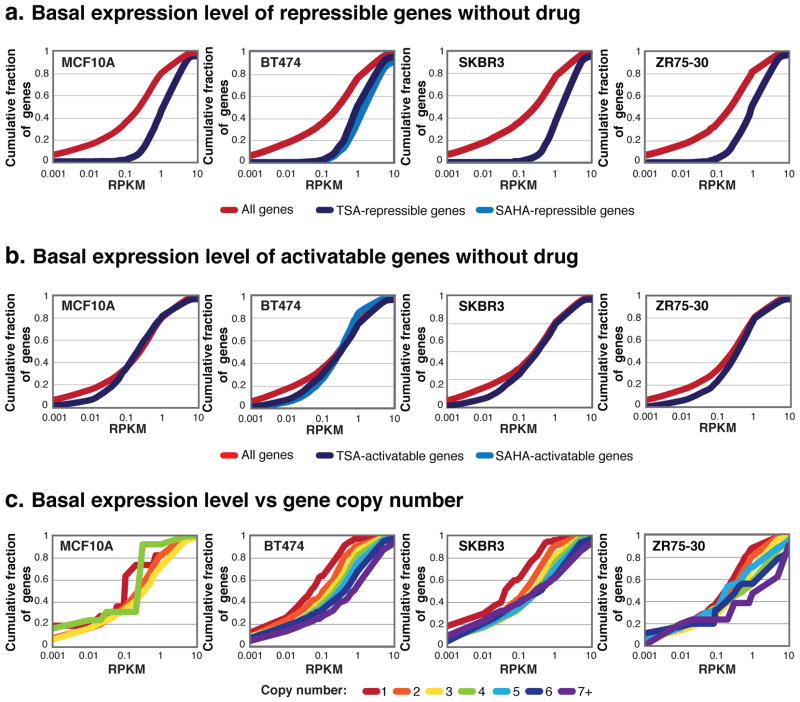
To identify the level of transcription that occurs in genes whose expression is capable of being altered by HDACI treatment, we determined the cumulative distribution of RPKM expression level for all genes and genes that can be significantly repressed or activated by HDACI (P < 10−20, log-likelihood ratio). We found that HDACI-repressible genes have a higher expression level than all genes in the genome as a whole (Figure 5a and Supplementary Figure 7a). Conversely, HDACI-activatable genes do not show any marked difference in expression level than all genes combined (Figure 5b and Supplementary Figure 7b).
Figure 5.
HDACI-repressible genes and amplified genes have high basal expression levels. (a–b) Cumulative distribution plots for genes without drug for all genes (red), and genes that can be significantly repressed or activated (P < 10−20, log-likelihood ratio test) by HDACI as determined by GRO-seq (TSA, purple-blue; SAHA, medium blue). See Supplementary Figure 7 for statistics. Genes with no expression were excluded. (c) Cumulative distribution plots of the expression levels (RPKM) of all genes of the indicated copy numbers. See Supplementary Figure 8 for statistics. Genes with no expression were excluded.
Several previous studies have identified genes that are repressed by HDACI, and many are highly expressed genes that are commonly found in amplicons, like ERBB2. The cell lines we employed in this study also harbor many amplicons relevant for cancer cell growth and survival, such as MYC, CCDN1 and others. We performed genome-wide copy number analysis using genotyping arrays, and a hidden Markov model previously developed was used to detect copy number alterations (27). Looking at the expression level of all the copy numbers, we found that high copy number genes in breast cancer cell lines have higher expression levels than normal copy number genes (Figure 5c and Supplementary Figure 8).
High copy number genes are more likely to be repressed by HDACI
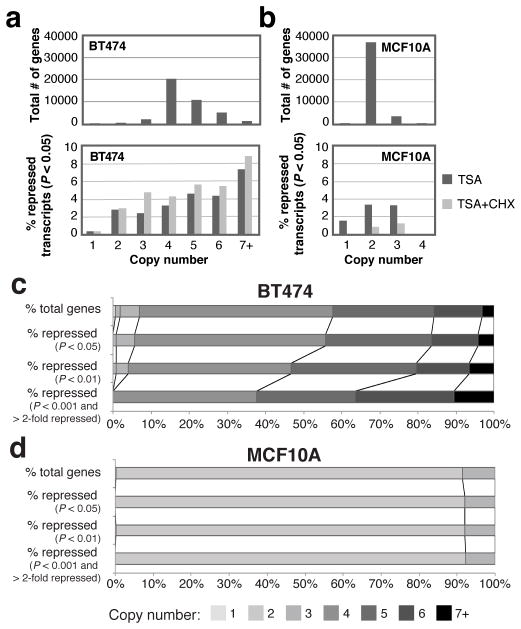
As amplicons contain highly expressed genes (Figure 5c) we wanted to know if these genes are more likely to be repressed than unamplified ones. This would suggest that oncogenes like ERBB2 that are highly expressed and amplified are specifically targeted for transcriptional repression by HDACI. We determined that in the BT474 genome, most genes exist in four copies, though many other genes are present in higher numbers (Figure 6a top). In contrast, most genes are diploid in the MCF10A genome, as expected (Figure 6b top). Transcripts that are identified as repressed by microarray analysis of BT474 cells after TSA treatment (P < 0.05, Illumina BeadStudio p-value) are more likely to come from genes with high copy numbers (five or greater), and these transcripts remain repressed even with CHX added (Figure 6a bottom, for statistics see Supplementary Table 3). The association between TSA-mediated direct transcriptional repression and copy number gains is statistically significant in BT474 (Figure 6a bottom, Supplementary Table 3). In other breast cancer cell lines, high copy number genes (four copies or greater in SKBR3, and three copies or greater in ZR75-30) are preferentially repressed by TSA based on our GRO-seq analysis (Supplementary Figure 9a–b, Supplementary Table 4). SAHA also selectively represses high copy number genes in BT474 (Supplementary Figure 9b, Supplementary Table 4).
Figure 6.
Genome-wide changes in mRNA levels upon HDAC inhibition in relation to copy number. (a–b) Histogram distribution graphs of the number of genes for given copy numbers as determined by MixHMM (top), and the percent of genes of the indicated copy number that are significantly repressed (P < 0.05) after TSA (dark grey) or TSA with CHX (light grey) treatment (bottom) in BT474 and MCF10A. See also Supplementary Table 3 for statistics on (a) and (b). (c–d) Stacked histograms for MCF10A and BT474, respectively. The top stacked bar is the distribution of all genes having the indicated copy numbers, and the bars below are the percent of genes that are significantly repressed by TSA as determined at increasing statistical thresholds (log-likelihood ratio) and cutoffs for minimum magnitude of change for defining transcripts as ‘repressed,’ which are indicated to the left. Lighter colors represent lower copy numbers and darker colors represent higher copy numbers.
By applying increasingly stringent statistical thresholds for detecting repressed genes in the microarray and GRO-seq data, we determined that in the BT474 and other breast cancer cell lines, high copy number genes are much more likely to be repressed by TSA or SAHA (Figure 6c, Supplementary Figure 9c). MCF10A do not show this trend in microarrays (Figure 6d), but do show a slight trend in the GRO-seq data (Supplementary Figure 9c). These results provide evidence from two independent measures of transcriptional activity that amplicons are more likely to be repressed by HDACI than unamplified genes.
Gene amplification events could cause a gene to be more susceptible to repression by HDACI, or a gene in an amplicon might be repressed because amplicons are composed of highly expressed genes (Figure 5c). Therefore, we looked at whether unamplified genes that are repressed (P < 10−20, log-likelihood ratio) still show a high level of expression before HDACI is added. We found that even unamplified HDACI-repressed genes display a high basal expression level (Supplementary Figure 10).
DISCUSSION
Using genome-wide measurements of steady state mRNA, nascent RNA synthesis and copy number states of genes, we have analyzed how HDACI modulate transcription in normal and HER2+ breast cancer cells. We found that HDACI inhibit transcriptional elongation, which causes significant decreases in the level of RNAP transcribing in the body of many genes across the genome, including ERBB2, and results in their transcriptional repression. We have also found that genes that are highly expressed, including amplified genes, are preferentially repressed by HDACI. Our data, taken together, suggest that oncogenic amplicons are selectively repressed by HDACI because they are highly transcribed, and their increased level of expression requires efficient transitioning from the initiation to elongation phase of transcription. This transition is most likely facilitated by histone or protein deacetylation.
Studies in yeast show that HDACs have a role in active gene transcription (28, 29), and recruitment of several HDAC isoforms is positively correlated with gene activation and histone acetylation level (30). The ability of HDACs to either activate or repress transcription suggests that proper cycling of acetylation and deacetylation is necessary for appropriate gene expression. Moreover, it was recently found that Hsp90 is involved in maintaining a barrier to elongation. Mutations of the gene encoding Hsp90, and two other known elongation barrier-creating proteins, Spt4 and NelfE, cause ectopic expression of wingless and an ectopic eye outgrowth phenotype in the sensitized D. melanogaster strain, KrIf (31, 32). TSA lowers the frequency at which both phenotypes are seen in flies with mutated Hsp90 (32). In combination with our results, it seems likely that TSA is normalizing the amount of transcriptional elongation pausing that is occurring by impeding the increased basal level of elongation caused by this mutation.
Transcription elongation appears to be an effective therapeutic target in cancer, and we predict that this is because of the ability of elongation inhibitors to target highly expressed oncogenes. Flavopiridol, a cancer drug currently being investigated in clinical trials, inhibits transcription elongation by blocking cyclin dependent kinase 9 (CDK9), the kinase subunit of positive transcription elongation factor b (P-TEFb) (33, 34). Also, a new class of cancer drugs (JQ1 and I-BET) that inhibit bromodomain containing protein 4 (BRD4), an acetyl-lysine binding protein that helps recruit P-TEFb, have shown great promise as a cancer therapy in several cancer types (24, 35, 36). Our results show that HDACI treatment causes the selective repression of transcriptional elongation, an effect that we have found to be specific to the deleterious transcriptional products of amplicons. Therefore, defining transcription elongation mechanisms and the role that HDAC enzymes play in this pathway will likely lead to more specific and potent cancer treatments.
MATERIALS and METHODS
Cell lines and drugs
BT474, MCF10A, SKBR3 and ZR75-30 cells were obtained from American Type Culture Collection (ATCC) and cultivated according to the supplier’s instructions. TSA and CHX were obtained from Sigma (St. Louis, MO, USA), and SAHA was provided LNH. Doses used were 500 nM, 10 μg/mL and 3 μM for TSA, CHX and SAHA, respectively.
Genotyping and copy number analysis
We used the hidden Markov model to infer copy number of genes as previously described (27). For details, see Supplemental Information.
Microarray genome-wide expression analysis
Total RNA for microarray analysis was isolated using RNA Isolation kit (Qiagen) per the manufacturer’s instructions. Biotinylated cDNA (1.5 μg) was hybridized onto an Illumina Sentrix BeadChip (Human-6v2) (Illumina, Inc., San Diego, CA, USA) then scanned on a BeadArray Reader (Illumina Inc). The resulting microarray data were quantile normalized, averaged and confidence values for transcriptional change for each probe upon HDAC inhibition were determined. The probe and gene expression profiles were generated using Illumina BeadStudio software. Statistical analysis was performed by the Illumina BeadStudio detection p-value. Microarrays were performed in triplicate.
Expression analysis
RT-qPCR was performed as previously described (37). Primer sequences are in Supplemental Information.
GRO-seq analysis and sequencing data analysis
Global run-on and library preparation for sequencing was performed based on the method published by John Lis et al. in 2008 (22). The protocol was partially modified to accommodate our experimental requirements. Sequencing data were aligned with hg18 using Bowtie mapping (38). Statistical analysis of the Illumina sequencing data was performed using the log-likelihood ratio in the Partek Genomic Suite. For details, see Supplemental Information. DAVID bioinformatics database was used for functional analysis and GO analysis (19, 20).
Supplementary Material
Acknowledgments
We thank the members of the laboratory for their comments on the manuscript. Yale Center for Genomic Analysis provided services for microarray labeling, hybridization and scanning. Bing Ren (Ludwig Institute for Cancer Research, La Jolla, CA) provided critical help with sequencing the GRO-seq libraries. CBG is a PhRMA Foundation predoctoral fellow. Grants to THK from the Rita Allen Foundation, Sidney Kimmel Foundation for Cancer Research, Yale Comprehensive Cancer Center (CA-16359), Alexander and Margaret Stewart Trust supported this work. A portion of this work was also made possible by a grant from the National Cancer Institute (R01CA140485 to THK).
Footnotes
CONFLICT OF INTEREST
The authors declare no conflict of interest
ACCESSION NUMBERS
All the sequencing and array data have been submitted to the ArrayExpress archive. The accession numbers are E-MTAB-666, E-MTAB-667, E-MTAB-668 and E-MTAB-675.
Supplemental information includes extended experimental procedures, 10 figures, and 4 tables.
References
- 1.Federico M, Bagella L. Histone deacetylase inhibitors in the treatment of hematological malignancies and solid tumors. Journal of biomedicine & biotechnology. 2011;2011:475641. doi: 10.1155/2011/475641. [Research Support, Non-U.S Gov’t Review] [DOI] [PMC free article] [PubMed] [Google Scholar]
- 2.Petrella A, Fontanella B, Carratu A, Bizzarro V, Rodriquez M, Parente L. Histone deacetylase inhibitors in the treatment of hematological malignancies. Mini reviews in medicinal chemistry [Review] 2011 Jun;11(6):519–27. doi: 10.2174/138955711795843347. [DOI] [PubMed] [Google Scholar]
- 3.Khan O, La Thangue NB. HDAC inhibitors in cancer biology: emerging mechanisms and clinical applications. Immunology and cell biology. 2011 Nov 29; doi: 10.1038/icb.2011.100. [DOI] [PubMed] [Google Scholar]
- 4.Rikiishi H. Autophagic and apoptotic effects of HDAC inhibitors on cancer cells. Journal of biomedicine & biotechnology. 2011;2011:830260. doi: 10.1155/2011/830260. [Research Support, Non-U.S Gov’t Review] [DOI] [PMC free article] [PubMed] [Google Scholar]
- 5.Kozikowski AP, Tapadar S, Luchini DN, Kim KH, Billadeau DD. Use of the nitrile oxide cycloaddition (NOC) reaction for molecular probe generation: a new class of enzyme selective histone deacetylase inhibitors (HDACIs) showing picomolar activity at HDAC6. Journal of medicinal chemistry [Research Support, NIH, Extramural Research Support, Non-US Gov’t] 2008 Aug 14;51(15):4370–3. doi: 10.1021/jm8002894. [DOI] [PMC free article] [PubMed] [Google Scholar]
- 6.Khan N, Jeffers M, Kumar S, Hackett C, Boldog F, Khramtsov N, et al. Determination of the class and isoform selectivity of small-molecule histone deacetylase inhibitors. The Biochemical journal. 2008 Jan 15;409(2):581–9. doi: 10.1042/BJ20070779. [DOI] [PubMed] [Google Scholar]
- 7.Choudhary C, Kumar C, Gnad F, Nielsen ML, Rehman M, Walther TC, et al. Lysine acetylation targets protein complexes and co-regulates major cellular functions. Science [Research Support, Non-US Gov’t] 2009 Aug 14;325(5942):834–40. doi: 10.1126/science.1175371. [DOI] [PubMed] [Google Scholar]
- 8.Berger SL. The complex language of chromatin regulation during transcription. Nature [Research Support, NIH, Extramural Review] 2007 May 24;447(7143):407–12. doi: 10.1038/nature05915. [DOI] [PubMed] [Google Scholar]
- 9.Marchion D, Munster P. Development of histone deacetylase inhibitors for cancer treatment. Expert review of anticancer therapy [Review] 2007 Apr;7(4):583–98. doi: 10.1586/14737140.7.4.583. [DOI] [PubMed] [Google Scholar]
- 10.Reid G, Metivier R, Lin CY, Denger S, Ibberson D, Ivacevic T, et al. Multiple mechanisms induce transcriptional silencing of a subset of genes, including oestrogen receptor alpha, in response to deacetylase inhibition by valproic acid and trichostatin A. Oncogene. 2005 Jul 21;24(31):4894–907. doi: 10.1038/sj.onc.1208662. [DOI] [PubMed] [Google Scholar]
- 11.Xu WS, Parmigiani RB, Marks PA. Histone deacetylase inhibitors: molecular mechanisms of action. Oncogene [Research Support, NIH, Extramural Research Support, Non-US Gov’t Review] 2007 Aug 13;26(37):5541–52. doi: 10.1038/sj.onc.1210620. [DOI] [PubMed] [Google Scholar]
- 12.Chou CW, Wu MS, Huang WC, Chen CC. HDAC inhibition decreases the expression of EGFR in colorectal cancer cells. PloS one. 2011;6(3):e18087. doi: 10.1371/journal.pone.0018087. [Research Support, Non-U.S Gov’t] [DOI] [PMC free article] [PubMed] [Google Scholar]
- 13.LaBonte MJ, Wilson PM, Fazzone W, Russell J, Louie SG, El-Khoueiry A, et al. The dual EGFR/HER2 inhibitor lapatinib synergistically enhances the antitumor activity of the histone deacetylase inhibitor panobinostat in colorectal cancer models. Cancer research [Research Support, NIH, Extramural] 2011 May 15;71(10):3635–48. doi: 10.1158/0008-5472.CAN-10-2430. [DOI] [PMC free article] [PubMed] [Google Scholar]
- 14.Scott GK, Marx C, Berger CE, Saunders LR, Verdin E, Schafer S, et al. Destabilization of ERBB2 transcripts by targeting 3′ untranslated region messenger RNA associated HuR and histone deacetylase-6. Molecular cancer research: MCR [Research Support, NIH, Extramural Research Support, Non-US Gov’t] 2008 Jul;6(7):1250–8. doi: 10.1158/1541-7786.MCR-07-2110. [DOI] [PMC free article] [PubMed] [Google Scholar]
- 15.Yokoyama S, Feige E, Poling LL, Levy C, Widlund HR, Khaled M, et al. Pharmacologic suppression of MITF expression via HDAC inhibitors in the melanocyte lineage. Pigment cell & melanoma research [Evaluation Studies Research Support, NIH, Extramural Research Support, Non-US Gov’t] 2008 Aug;21(4):457–63. doi: 10.1111/j.1755-148X.2008.00480.x. [DOI] [PMC free article] [PubMed] [Google Scholar]
- 16.Albertson DG. Gene amplification in cancer. Trends in genetics: TIG [Research Support, NIH, Extramural Review] 2006 Aug;22(8):447–55. doi: 10.1016/j.tig.2006.06.007. [DOI] [PubMed] [Google Scholar]
- 17.Huang X, Gao L, Wang S, Lee CK, Ordentlich P, Liu B. HDAC inhibitor SNDX-275 induces apoptosis in erbB2-overexpressing breast cancer cells via down-regulation of erbB3 expression. Cancer research [Research Support, Non-US Gov’t] 2009 Nov 1;69(21):8403–11. doi: 10.1158/0008-5472.CAN-09-2146. [DOI] [PubMed] [Google Scholar]
- 18.Mortazavi A, Williams BA, McCue K, Schaeffer L, Wold B. Mapping and quantifying mammalian transcriptomes by RNA-Seq. Nature methods [Research Support, NIH, Extramural Research Support, Non-US Gov’t] 2008 Jul;5(7):621–8. doi: 10.1038/nmeth.1226. [DOI] [PubMed] [Google Scholar]
- 19.Huang da W, Sherman BT, Lempicki RA. Systematic and integrative analysis of large gene lists using DAVID bioinformatics resources. Nat Protoc. 2009;4(1):44–57. doi: 10.1038/nprot.2008.211. [Research Support, N.I.H Extramural] [DOI] [PubMed] [Google Scholar]
- 20.Huang da W, Sherman BT, Lempicki RA. Bioinformatics enrichment tools: paths toward the comprehensive functional analysis of large gene lists. Nucleic Acids Res [Research Support, NIH, Extramural] 2009 Jan;37(1):1–13. doi: 10.1093/nar/gkn923. [DOI] [PMC free article] [PubMed] [Google Scholar]
- 21.Gilmour DS, Fan R. Detecting transcriptionally engaged RNA polymerase in eukaryotic cells with permanganate genomic footprinting. Methods [Research Support, Non-US Gov’t] 2009 Aug;48(4):368–74. doi: 10.1016/j.ymeth.2009.02.020. [DOI] [PubMed] [Google Scholar]
- 22.Core LJ, Waterfall JJ, Lis JT. Nascent RNA sequencing reveals widespread pausing and divergent initiation at human promoters. Science [Research Support, NIH, Extramural] 2008 Dec 19;322(5909):1845–8. doi: 10.1126/science.1162228. [DOI] [PMC free article] [PubMed] [Google Scholar]
- 23.Core LJ, Lis JT. Transcription regulation through promoter-proximal pausing of RNA polymerase II. Science [Research Support, NIH, Extramural] 2008 Mar 28;319(5871):1791–2. doi: 10.1126/science.1150843. [DOI] [PMC free article] [PubMed] [Google Scholar]
- 24.Rahl PB, Lin CY, Seila AC, Flynn RA, McCuine S, Burge CB, et al. c-Myc regulates transcriptional pause release. Cell [Research Support, NIH, Extramural] 2010 Apr 30;141(3):432–45. doi: 10.1016/j.cell.2010.03.030. [DOI] [PMC free article] [PubMed] [Google Scholar]
- 25.Yik JH, Chen R, Nishimura R, Jennings JL, Link AJ, Zhou Q. Inhibition of P-TEFb (CDK9/Cyclin T) kinase and RNA polymerase II transcription by the coordinated actions of HEXIM1 and 7SK snRNA. Mol Cell [Research Support, Non-US Gov’t Research Support, US Gov’t, PHS] 2003 Oct;12(4):971–82. doi: 10.1016/s1097-2765(03)00388-5. [DOI] [PubMed] [Google Scholar]
- 26.Michels AA, Fraldi A, Li Q, Adamson TE, Bonnet F, Nguyen VT, et al. Binding of the 7SK snRNA turns the HEXIM1 protein into a P-TEFb (CDK9/cyclin T) inhibitor. Embo J [Research Support, NIH, Extramural Research Support, Non-US Gov’t Research Support, US Gov’t, PHS] 2004 Jul 7;23(13):2608–19. doi: 10.1038/sj.emboj.7600275. [DOI] [PMC free article] [PubMed] [Google Scholar]
- 27.Liu Z, Li A, Schulz V, Chen M, Tuck D. MixHMM: inferring copy number variation and allelic imbalance using SNP arrays and tumor samples mixed with stromal cells. PloS one. 2010;5(6):e10909. doi: 10.1371/journal.pone.0010909. [Research Support, N.I.H., Extramural Research Support, Non-U.S Gov’t] [DOI] [PMC free article] [PubMed] [Google Scholar]
- 28.Govind CK, Qiu H, Ginsburg DS, Ruan C, Hofmeyer K, Hu C, et al. Phosphorylated Pol II CTD recruits multiple HDACs, including Rpd3C(S), for methylation-dependent deacetylation of ORF nucleosomes. Mol Cell [Research Support, NIH, Intramural] 2010 Jul 30;39(2):234–46. doi: 10.1016/j.molcel.2010.07.003. [DOI] [PMC free article] [PubMed] [Google Scholar]
- 29.Li B, Gogol M, Carey M, Lee D, Seidel C, Workman JL. Combined action of PHD and chromo domains directs the Rpd3S HDAC to transcribed chromatin. Science [Research Support, NIH, Extramural] 2007 May 18;316(5827):1050–4. doi: 10.1126/science.1139004. [DOI] [PubMed] [Google Scholar]
- 30.Wang Z, Zang C, Cui K, Schones DE, Barski A, Peng W, et al. Genome-wide mapping of HATs and HDACs reveals distinct functions in active and inactive genes. Cell [Research Support, NIH, Extramural Research Support, Non-US Gov’t] 2009 Sep 4;138(5):1019–31. doi: 10.1016/j.cell.2009.06.049. [DOI] [PMC free article] [PubMed] [Google Scholar]
- 31.Sawarkar R, Sievers C, Paro R. Hsp90 globally targets paused RNA polymerase to regulate gene expression in response to environmental stimuli. Cell. 2012 May 11;149(4):807–18. doi: 10.1016/j.cell.2012.02.061. [DOI] [PubMed] [Google Scholar]
- 32.Sollars V, Lu X, Xiao L, Wang X, Garfinkel MD, Ruden DM. Evidence for an epigenetic mechanism by which Hsp90 acts as a capacitor for morphological evolution. Nat Genet [Research Support, Non-US Gov’t Research Support, US Gov’t, PHS] 2003 Jan;33(1):70–4. doi: 10.1038/ng1067. [DOI] [PubMed] [Google Scholar]
- 33.Chao SH, Fujinaga K, Marion JE, Taube R, Sausville EA, Senderowicz AM, et al. Flavopiridol inhibits P-TEFb and blocks HIV-1 replication. J Biol Chem [Research Support, Non-US Gov’t Research Support, US Gov’t, PHS] 2000 Sep 15;275(37):28345–8. doi: 10.1074/jbc.C000446200. [DOI] [PubMed] [Google Scholar]
- 34.Cheng B, Price DH. Properties of RNA polymerase II elongation complexes before and after the P-TEFb-mediated transition into productive elongation. J Biol Chem [Research Support, NIH, Extramural] 2007 Jul 27;282(30):21901–12. doi: 10.1074/jbc.M702936200. [DOI] [PubMed] [Google Scholar]
- 35.Delmore JE, Issa GC, Lemieux ME, Rahl PB, Shi J, Jacobs HM, et al. BET bromodomain inhibition as a therapeutic strategy to target c-Myc. Cell [Research Support, NIH, Extramural Research Support, Non-US Gov’t] 2011 Sep 16;146(6):904–17. doi: 10.1016/j.cell.2011.08.017. [DOI] [PMC free article] [PubMed] [Google Scholar]
- 36.Zuber J, Shi J, Wang E, Rappaport AR, Herrmann H, Sison EA, et al. RNAi screen identifies Brd4 as a therapeutic target in acute myeloid leukaemia. Nature [Research Support, NIH, Extramural Research Support, Non-US Gov’t] 2011 Oct 27;478(7370):524–8. doi: 10.1038/nature10334. [DOI] [PMC free article] [PubMed] [Google Scholar]
- 37.Kim YJ, Cecchini KR, Kim TH. Conserved, developmentally regulated mechanism couples chromosomal looping and heterochromatin barrier activity at the homeobox gene A locus. Proc Natl Acad Sci U S A [Research Support, NIH, Extramural Research Support, Non-US Gov’t] 2011 May 3;108(18):7391–6. doi: 10.1073/pnas.1018279108. [DOI] [PMC free article] [PubMed] [Google Scholar]
- 38.Langmead B, Trapnell C, Pop M, Salzberg SL. Ultrafast and memory-efficient alignment of short DNA sequences to the human genome. Genome Biol. 2009;10(3):R25. doi: 10.1186/gb-2009-10-3-r25. [Research Support, N.I.H Extramural] [DOI] [PMC free article] [PubMed] [Google Scholar]
Associated Data
This section collects any data citations, data availability statements, or supplementary materials included in this article.


