Abstract
Individuals with spinal cord injury experience a rapid loss of bone mineral below the neurological lesion. The clinical consequence of this bone loss is a high rate of fracture around regions of the knee. The ability to predict the mechanical competence of bones at this location may serve as an important clinical tool to assess fracture risk in the spinal cord injury population. The purpose of this study was to develop, and statistically compare, non-invasive methods to predict torsional stiffness (K) and strength (Tult) of the proximal tibia. Twenty-two human tibiae were assigned to either a “training set” or a “test set” (11 specimens each) and mechanically loaded to failure. The training set was used to develop subject-specific finite element (FE) models, and statistical models based on dual energy x-ray absorptiometry (DXA) and quantitative computed tomography (QCT), to predict K and Tult; the test set was used for cross-validation. Mechanical testing produced clinically relevant spiral fractures in all specimens. All methods were accurate and reliable predictors of K (cross-validation r2 ≥ 0.91; error ≤ 13%), however FE models explained an additional 15% of the variance in measured Tult and illustrated 12–16% less error than DXA and QCT models. Given the strong correlations between measured and FE predicted K (cross-validation r2= 0.95; error = 10%) and Tult (cross-validation r2= 0.91; error = 9%), we believe the FE modeling procedure has reached a level of accuracy necessary to answer clinically relevant questions.
Keywords: finite element analysis, quantitative computed tomography, mechanical testing, experimental validation, bone fracture, spinal cord injury
INTRODUCTION
Individuals with spinal cord injury (SCI) experience a rapid loss of bone mineral at regions below the neurological lesion. Depending on the anatomic location, some 25% to 50% of their lower-extremity bone mineral is resorbed within the first 2 to 3 years of SCI (Biering-Sorensen et al., 1990; Eser et al., 2004). The clinical consequence of this reduction in bone is an increased lifetime risk of low-energy fracture that is two times greater than the general population (Vestergaard et al., 1998). These fractures are a source of considerable morbidity; more than 50% are characterized by medical complications requiring prolonged hospitalization (Morse et al., 2009).
Fractures in individuals with SCI frequently occur around regions of the knee, e.g. the proximal tibia (Comarr et al., 1962; Eser et al., 2005; Freehafer et al., 1981; Morse et al., 2009; Zehnder et al., 2004). Common causes of fracture include transfers, falls from wheelchairs, and rolling over in bed (Comarr et al., 1962; Eser et al., 2005; Freehafer et al., 1981; Morse et al., 2009; Zehnder et al., 2004). Torsional loading has been implicated as a principal mode of failure, as spiral fracture patterns are frequently observed in this population (Keating et al., 1992; Martínez et al., 2002). The current fracture risk assessment tools for the general public are inadequate for people with SCI. In part, this is because the locations of routine fracture do not correspond between these two groups. Therefore, the ability to quantify the mechanical competence of bone at a physiologically relevant location may serve as an important clinical tool to assess fracture risk in the SCI population.
The purpose of this study was to develop and statistically evaluate three non-invasive methods for predicting torsional stiffness and strength of the proximal tibia. These methods included 1) subject-specific finite element (FE) models, and multivariate models based on 2) dual energy x-ray absorptiometry (DXA) and 3) quantitative computed tomography (QCT). Because the FE method explicitly models structural and material behavior, while DXA and QCT derived predictions are inherently statistical, we hypothesized that FE models would be a more accurate and reliable predictor of mechanical behavior.
METHODS
Specimens
Twenty-two tibiae were excised from formalin-fixed cadavers of mixed death histories (ages 46 to 98 yrs, 11 females, 17 right limbs). All specimens were free from overt structural pathology as identified by an expert anatomist. Specimens were cleaned of soft tissue and osteotomy was performed 15 cm distal to the intercondylar eminence. The proximal and distal most 2 cm of bone were potted in polymethyl methacrylate (PMMA), leaving 11 cm of bone exposed. Specimens were assigned to either a “training” set or a “test” set (11 specimens each) based on DXA assessed areal bone mineral density (aBMD) of the entire proximal tibia (see Image Acquisition and Analysis). Sets were allocated by ranking aBMD of the entire sample and assigning every other ranked specimen to a specific set.
Image Acquisition and Analysis
The DXA and computed tomography (CT) data were acquired with the specimens aligned along the longitudinal axis and fully immersed in water. The DXA scans were performed using a Hologic QDR-4500 (Holigic, Waltham, MA) with the lumbar spine acquisition software. Three regions of bone were analyzed corresponding to 0–10%, 10–20%, and 20–30% of tibial length (medial condyle to medial malleolus), as measured from the proximal end. These regions, which illustrated considerable variation in their trabecular and cortical bone makeup, were chosen based on their anatomical correspondence to epiphyseal (0–10%), metaphyseal (10–20%), and diaphyseal (20–30%) locations (Figure 1). For each region, bone mineral content (BMC), and aBMD were computed.
Figure 1.
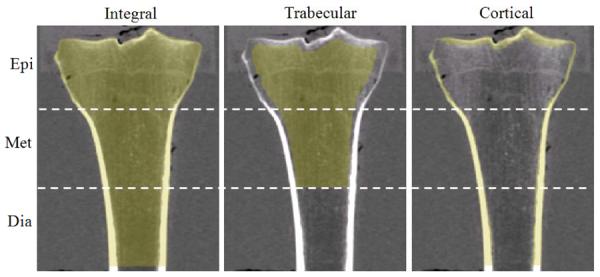
A frontal plane cut-through view of the QCT regions (Epi, Met, Dia) of interest for a representative specimen. Yellow pixels superimposed on the image correspond to integral, trabecular and cortical regions of bone.
The CT scans were performed using a BrightSpeed (GE Medical Systems, Milwaukee, WI) with acquisition settings of 120 kV, 200 mA, an in-plane resolution of 0.352 mm, and a slice thickness of 0.625 mm. Each scan included a calibration phantom (QRM, Moehrendorf, Germany) with known bone equivalent concentrations. The phantom was used to convert CT attenuation in Hounsfield units (Hu) to calcium hydroxyapatite equivalent density (ρha).
The QCT analysis was performed using a combination of Mimics (Materialise, Leuven, Belgium) and Matlab (MathWorks, Natick, MA) software. Measurements were computed for epiphyseal, metaphyseal, and diaphyseal regions as defined above (Figure 1). Proximal tibiae were segmented using a 0.15 g/cm3 threshold to identify the periosteal surface boundary. For the epiphyseal and metaphyseal regions, trabecular volumetric BMD (Tb.vBMD) and cortical BMC (Ct.BMC) were computed. Trabecular and cortical bone specific regions were identified using methods similar to those described for the proximal femur by Lang et al. (2004). The trabecular region was determined from a 3.5 mm, or 10 pixel, in-plane erosion of the integral bone region (i.e, all voxels contained within the periosteal surface boundary). The cortical region was determined from a Boolean subtraction of the trabecular from the integral region, followed by a thresholding of 0.35 g/cm3 to remove any residual trabecular bone (Figure 1). For the diaphyseal region, only cortical BMC was computed. Here, the cortical region included all voxels within the integral region greater than 0.35 g/cm3. Measures of geometry and strength were also computed for each region including cortical bone volume (Ct.BV), integral bone cross sectional area (CSA), and an integral bone torsional strength index (TSI) (see Appendix).
Mechanical Testing
Proximal tibiae were loaded in internal rotation using a materials testing machine (858 Mini Bionix II, MTS, Inc., Minneapolis, MN) with a custom linear actuated torsional device (Figure 2a). The device has an experimental error less than 0.2 Nm (Edwards and Troy, 2012). Following 10 preconditioning cycles to 20 Nm, tibiae were loaded in internal rotation at a fixed rotation rate of 9.0 °/s until fracture. Torque and rotation data were collected concurrently at 1000 Hz. Rotational stiffness (K) and torque at ultimate failure (Tult) were calculated from the torque-rotation curves. K was calculated from a 1st order polynomial fit of the initial linear portion of the curve and Tult corresponded to the instant of maximum torque (Figure 3).
Figure 2.
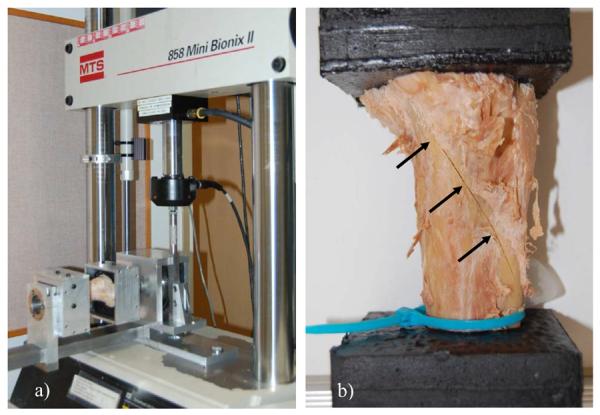
(a) Proximal tibia being loaded in internal rotation using the linear actuated torsional device. (b) Lateral view of a proximal tibia illustrating a spiral fracture pattern (see arrows).
Figure 3.
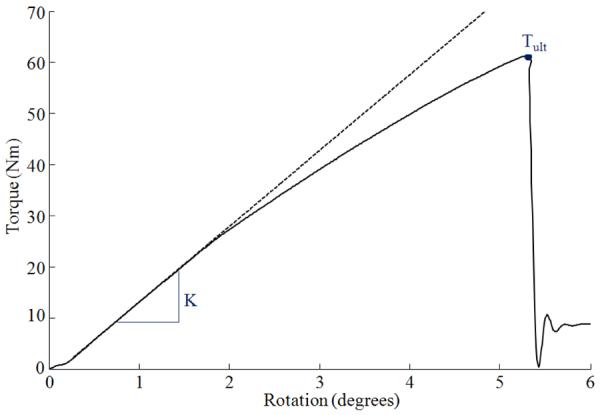
Representative torque-rotation curve (solid line) illustrating the linear elastic projection (dashed line) used to calculate stiffness K, and the point on the curve corresponding to ultimate strength Tult.
Finite Element (FE) Modeling
Specimen-specific FE models of the proximal tibiae were created from segmented CT data for the training set. These models were used to refine FE modeling parameters specific to element size, material property assignment, and failure criteria.
The CT images were resampled to isotropic voxels with a 1.5 mm edge length and a custom Matlab script was used to convert voxels of segmented bones to 8-node hexahedral elements; PMMA was modeled as a conforming mesh. This resulted in models consisting of 211,825 ± 17,466 elements with 230,153 ± 18,173 degrees of freedom, depending on specimen size. This level of refinement was deemed acceptable following a convergence analysis with element edge lengths ranging from 3.0 to 1.0 mm; decreasing edge length from 1.5 to 1.0 mm changed FE predicted K by less than 2%. Bone elements were assigned to one of approximately 160 nonlinear orthotropic material properties corresponding to a bin width of 10 Hu (Figure 4). Pre-yield elastic moduli in the axial direction E3 was defined using a density-elasticity relationship specific to the proximal tibia (Rho et al., 1995):
where E3 is expressed in MPa, and ρapp is the apparent density expressed in g/cm3 (ρapp = ρha/0.626; Dalstra et al., 1993). Although this relationship was developed for trabecular bone (i.e., ρapp <1.0 g/cm3) it was applied here across the entire density range. Figure 4 illustrates that extrapolation of the density-elasticity relationship to ρapp ≥1.0 g/cm3 resulted in E3 values within the range frequently reported for cortical bone. Values of E3 less than 0.01 MPa were assigned a new value of 0.01 MPa (Keyak et al., 2001). Anisotropy was assumed to be the same throughout with E1=0.574·E3, E2=0.577·E3, G12=0.195·E3, G23=0.265·E3, G31=0.216·E3, ν12=0.427, ν23=0.234, and ν31=0.405 (Rho, 1996). Here, subscripts 1 and 2 denote the medial and anterior directions, respectively. These anisotropic definitions illustrated excellent agreement between experimentally measured and FE predicted principal strains for a cadaveric tibia loaded in torsion (r2=0.994; error = 6.3%, Gray et al., 2008). PMMA elements were modeled as a linear isotropic material with a modulus of 2,500 MPa, and a poisons ratio of 0.3 (Lewis, 1997).
Figure 4.
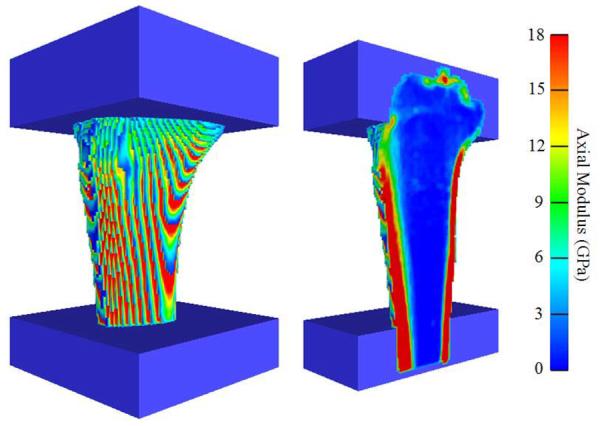
Anteriomedial view of a representative FE model illustrating the distribution of axial moduli E3 on the surface (left) and internal (right) elements.
The non-linear phase of the bone material was modeled as bilinear elastic-plastic with a post-yield modulus equal to 5% of the pre-yield modulus (Bayraktar et al., 2004; Gupta et al., 2007). Yield was defined by Hill's conventional criterion (Hill, 1948), which has illustrated strong agreement with test data from human tibial bone under combined axial-torsional loading (Cezayirlioglu et al., 1985). Hill's conventional criterion is an orthotropic extension of the Von Mises yield criterion that takes the form:
where F, G, H, L, M, and N are empirically derived constants and σij are the stress tensor components. These constants are functions of material anisotropic yield in which:
where , , are the normal yield stresses and , , are the yield stress in shear. Yield strains were assumed to be isotropic (Currey, 2004; Keaveny, 2001) in the normal (0.675%) and shear (1.215%) directions (Rincon-Kohli and Zysset, 2009) and yield stresses were determined by multiplying yield strains by their respective normal (E1, E2, E3) and shear (G12, G23, G31) moduli.
The FE analyses were performed in ABAQUS Standard (ABAQUS Inc., Providence, RI) with boundary conditions that mimicked the mechanical testing protocol. Surface nodes of the distal PMMA were fixed in translation, and surface nodes of the proximal PMMA were constrained with a kinematic couple to a reference node created at the center of the top surface of the proximal PMMA. A torsional displacement was applied to the reference node in increments of ≈1.15 deg (0.02 rad); all other degrees of freedom of the reference node were fixed and the reaction torque was monitored. The FE predicted stiffness K was quantified from the linear portion of the torque-rotation curve. The FE predicted ultimate failure Tult was assumed to occur when a specific percentage of surface elements had failed according to a maximum principal strain criterion. This particular definition of Tult was chosen because fractures caused by torsional loads are generally characterized by a crack initiating at the surface with a fracture plane coincident with the angle of maximum tensile strain (Bonfield and Grynpas, 1982). Element material failure was said to occur when the maximum principal strain exceeded 1.410% (Rincon-Kohli and Zysset, 2009). The FE models for the training set were used to establish the percentage of failed surface elements, i.e. 10%, that minimized the error between experimentally measured and FE predicted Tult (Figure 5).
Figure 5.
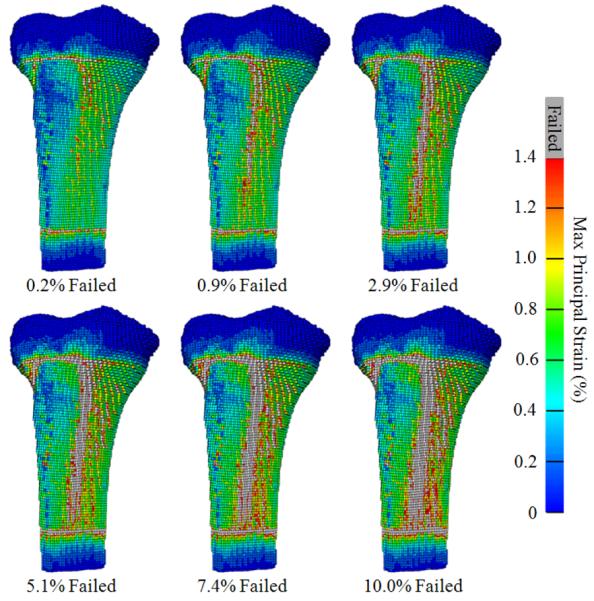
Anteriomedial views of a representative FE model illustrating maximum principal strain and progression of surface element failure (i.e., εmax>1.41%). The FE predicted Tult corresponded to the torque at which 10% of the surface elements had failed.
Data and Statistical Analysis
Multivariate linear regression models were constructed for the training set. These models were used to predict experimentally measured K and Tult from either DXA or QCT data (i.e. four separate regression models). For each model, specimen age and sex were also included in the group of independent candidate variables. Regression analyses were conducted stepwise, with the criterion alpha level set to 0.05 for entry and 0.1 for removal. The correlation between experimental and FE predicted K and Tult for the training set was calculated using simple linear regression.
The reliability of multivariate and finite element models developed for the training set was tested by applying them to the test set (i.e., we tested how reliable K and Tult predictions were when applied to a new sample). For DXA and QCT, this was done using data obtained from the test set as inputs to the regression models derived from the training set. For FE models, the modeling procedures developed for the training set were directly applied to the test set. The cross-validation r2 and the mean absolute percent error between measured and predicted values were calculated for the test set. All statistical analyses were performed in SPSS (SPSS Inc., Chicago, IL) with a criterion alpha level of 0.05.
RESULTS
Torsional loading of the proximal tibiae produced clinically relevant spiral fractures in all twenty-two cadaveric specimens (Figure 2b). Experimentally measured K ranged from 10.04 to 55.15 Nm/deg and Tult ranged from 40.16 to 216.06 Nm. Rotational displacement at Tult ranged from 4.93 to 12.12 deg, which corresponded to a time until fracture of 0.55 to 1.34 sec.
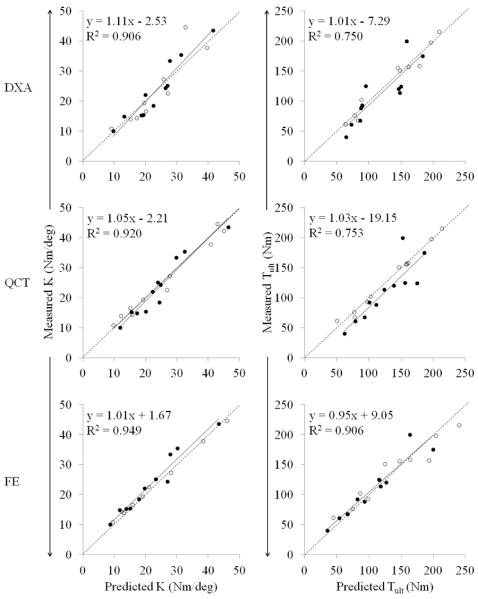
The training and the test set did not differ in terms of any measured variables (Table 1). All three methods were able to explain a large amount of variance in experimentally measured K and Tult (Table 2). In general, all models were more reliable predictors of K than Tult. Although DXA and QCT models were stronger predictors of Tult than FE models for the training set, the ability of DXA and QCT to predict Tult for the test set was noticeably lower. For all models, regression slopes and intercepts of the test set were not significantly different from 1 and 0, respectively (Figure 6).
Table 1.
Mean (SD) parameters for cadaveric specimens of the training and test sets. There were no significant differences in any measurement between the training and test sets (p<0.05).
| Training set | Test set | |
|---|---|---|
|
| ||
| (n = 11; 6 females) | (n = 11; 5 females) | |
| Age (yrs) | 68.18 (15.72) | 69.82 (15.60) |
| DXA | ||
| Epi aBMD (g/cm2) | 0.61 (0.28) | 0.52 (0.20) |
| Epi BMC (g) | 13.31 (7.52) | 10.24 (4.90) |
| Met aBMD (g/cm2) | 0.83 (0.25) | 0.76 (0.20) |
| Met BMC (g) | 11.35 (5.20) | 9.69 (3.36) |
| Dia aBMD (g/cm2) | 1.01 (0.28) | 0.98 (0.24) |
| Dia BMC (g) | 10.28 (4.66) | 9.40 (3.16) |
| QCT | ||
| Epi Tb.vBMD (g/cm3) | 0.10 (0.06) | 0.09 (0.04) |
| Epi Ct.BV (cm3) | 9.03 (5.43) | 5.73 (2.98) |
| Epi Ct.BMC (g) | 4.56 (2.88) | 2.85 (1.62) |
| Epi CSA (cm2) | 24.66 (5.12) | 23.48 (3.03) |
| Epi TSI (cm3) | 2.09 (1.15) | 1.53 (0.61) |
| Met Tb.vBMD (g/cm3) | 0.02 (0.14) | 0.04 (0.05) |
| Met Ct.BV (cm3) | 14.24 (5.95) | 11.72 (3.60) |
| Met Ct.BMC (g) | 9.78 (4.82) | 8.20 (3.16) |
| Met CSA (cm2) | 15.03 (3.28) | 13.54 (1.91) |
| Met TSI (cm3) | 2.25 (1.12) | 1.81 (0.69) |
| Dia Ct.BV (cm3) | 15.17 (5.93) | 13.69 (3.95) |
| Dia Ct.BMC (g) | 12.19 (5.58) | 11.14 (3.96) |
| Dia CSA (cm2) | 9.13 (2.27) | 8.27 (1.36) |
| Dia TSI (cm3) | 1.85 (0.84) | 1.65 (0.62) |
| FE | ||
| K (Nm/deg) | 28.02 (16.52) | 21.67 (10.00) |
| Tult (Nm) | 131.11 (63.59) | 106.30 (47.80) |
| Mechanical test | ||
| K (Nm/deg) | 27.72 (14.94) | 23.48 (10.34) |
| Tult (Nm) | 130.61 (53.21) | 109.93 (47.66) |
Table 2.
Predictive models of torsional stiffness K and strength Tult. The method of prediction is listed in parentheses on the left side of equations.
| Prediction model | Training set r2 | Cross-validation correlation r2 | Mean Absolute % Error (SD) |
|---|---|---|---|
| K (DXA) = 2.631 × Met BMC − 2.141 | 0.838 | 0.906 | 12.99 (7.44) |
| K (QCT) = 0.152 × Age + 17.652 × Dia TSI − 15.332 | 0.970 | 0.920 | 11.28 (12.63) |
| K (FE) = K | 0.976 | 0.949 | 10.03 (6.42) |
| Tult (DXA) = 41.486 × Sex + 6.381 × Met BMC + 35.560 | 0.964 | 0.750 | 20.80 (16.18) |
| Tult (QCT) = 12.167 × Epi TSI − 12.424 × Met Ct.BMC + 17.586 × Dia Ct.BMC + 12.437 | 0.990 | 0.753 | 24.63 (14.75) |
| Tult (FE) = Tult | 0.935 | 0.906 | 8.87 (4.96) |
Units for parameters of multivariate models are as reported in Table 1. For sex, female = 0 and male = 1.
Figure 6.
The predicted torsional stiffness K and strength Tult for the training set (open circles) and test set (closed circles) plotted against the actual measured values. Regression equations and coefficients of variation are for the test set. All slopes and intercepts were not significantly different from unity and zero, respectively (p<0.05).
DISCUSSION
The purpose of this study was to test and compare the ability of three non-invasive methods to predict torsional stiffness and strength of the proximal tibia. We hypothesized that subject-specific FE models would be a better predictor of mechanical behavior than statistical models based on DXA and QCT parameters. All models were able to accurately and reliably predict K (cross-validation r2 ≥ 0.91; error ≤ 13%), with the FE method just slightly outperforming DXA and QCT. On the other hand the FE method was noticeably better at predicting Tult than DXA and QCT. The FE models for the test set explained an additional 15% of the variance in measured Tult and illustrated 12–16% less absolute error than that of DXA and QCT models. Thus, our hypothesis was supported by the results of this study.
The fact that FE models outperformed DXA and QCT models is not surprising. The mechanical behavior of bone is dependent on structural geometry, mineral distribution, material properties, and loading environment. Unlike densitometry measures, FE models capture this information and account for the complex interaction between these factors. The FE method has illustrated a substantial improvement in fracture strength prediction of proximal femora (Cody et al., 1999; Dragomir-Daescu et al., 2011) and vertebral bodies (Crawford et al., 2003) relative to DXA and QCT. Additionally, information derived from FE models are strongly associated with hip fracture risk, even after controlling for aBMD (Orwoll et al., 2009). The level of accuracy observed here for FE predicted strength (training set r2 = 0.94; cross-validation r2 = 0.91; error = 9%; X = Y type correlation) is in line with that reported for similar validation studies at other anatomical locations. Roberts et al., (2009) reported an accuracy of r2 = 0.78 for proximal femurs loaded in a sideways fall configuration and Crawford et al., (2003) reported an accuracy of r2 = 0.86 for vertebral bodies loaded in axial compression. These FE models are currently being used to answer clinically relevant questions regarding fracture risk (Amin et al., 2011; Wang et al., 2012) and drug treatment efficacy (Keaveny et al., 2008; Keaveny et al., 2012) in postmenopausal women and older adults.
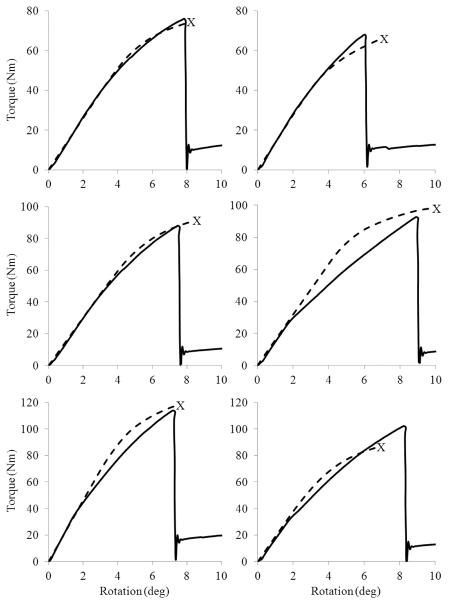
Despite its robust predictive ability, our FE modeling procedure did a relatively poor job at predicting the overall torque-rotation behavior for certain specimens (Figure 7). There are a few limitations of our modeling procedure that may account for this discrepancy. First, owing to the low resolution of clinical CT, we did not directly quantify material anisotropy and a constant anisotropy was assumed throughout the proximal tibia. Although material anisotropy is relatively constant across the density range of proximal tibial trabecular bone (Ashman et al., 1989), the anatomic and material axes do not necessarily coincide as assumed herein. Second, the material behavior of bone was modeled as elastic-plastic using Hill's orthotropic yield criterion. There is evidence that the nonlinear behavior of bone in torsion is better explained as a damaging-elastic material with a continuous modulus reduction associated with microdamage accumulation (Jepsen and Davy, 1997). Additionally, Hill's criterion does not account for tension-compression yield asymmetry (Morgan and Keaveny, 2001) and perhaps implementation of the Tsai-Wu criterion (Tsai and Wu, 1971) – an extension of Hill's criterion that accounts for tension-compression asymmetry – would improve our predictions.
Figure 7.
Measured (solid line) and FE predicted (dashed) torque-rotation curves for representative specimens illustrating relatively good fits (left) and relatively poor fits (right). The point of predicted fracture is labeled with an X.
Our FE modeling procedure did not explicitly model fracture but assumed it occurred when a specific amount of surface elements had failed. This criterion is similar to that employed for geometrical meshes of the proximal femur that assumed fracture coincided with failure of a single surface element (Bessho et al., 2007; Koivumäki et al., 2012). The single element definition could not be employed here as this would underestimate fracture strength due to singularities at surface edges of the voxel based mesh. Similarly, no correction was made to control for the partial volume effects inherent to surface elements of all CT-based FE models (see Figure 4). We did investigate the accuracy of two additional failure algorithms: 1) fracture coinciding with the failure of surface and internally adjacent elements and 2) fracture coinciding with the failure of cortical bone specific elements as defined in QCT analysis. For the training set, error was minimized when 10% (r2 = 0.934) and 7% (r2 = 0.932) of the elements had failed using algorithm 1 and 2, respectively. Ultimately, these algorithms were not implemented because they required additional post-processing time and were no more robust than the surface only algorithm. The voxel based mesh also limits our ability to quantitatively compare experimental and predicted fracture locations. Although experimental fracture and the large majority of element failure were restricted to metaphyseal regions of proximal tibiae (see Figure 5), an accurate comparison would likely require a reduction in surface element solution errors using a post-processing filter (Guldberg et al., 1998) or, alternatively, a geometrical FE mesh. We chose a voxel based mesh because of its ease of generation using custom automated software and the fact that these models are already starting to impact the clinic (Amin et al., 2011; Keaveny et al., 2008; Keaveny et al., 2012; Wang et al., 2012).
The use of formalin fixed cadavers from a non-SCI population may limit the generalizability of our findings. Reports on the effects of formalin fixation on bone mechanical properties are conflicting; whereas some studies have reported significant reductions in elastic modulus (Öhman et al., 2008), others have reported no changes (Unger et al., 2010; van Haaren et al., 2008). Similarly, some studies have reported significant changes in failure properties (Öhman et al., 2008; Unger et al., 2010), while one study reported no influence of fixation even after a one year storage period (van Haaren et al., 2008). Although it is possible that fixation may have influenced absolute values in this study, it would not be expected to change the observed correlations and thus the interpretation of our results. Regarding SCI, there is some evidence that bone undergoes micro-structural changes following prolonged disuse (Lee et al., 1997; Modlesky et al., 2004). Although our models cannot account for specific micro-characteristics pertaining to trabecular architecture, collagen cross-linking, and remodeling space, it is unclear how strongly these details would influence whole-bone fracture strength. On the other hand, our FE models can account for macro-structural changes in whole bone as well as any micro-structural changes to remodeling space and trabecular architecture that manifest as changes in ρapp, which would be expected to play a considerable role in whole-bone fracture strength. Therefore, our modeling procedure should be able to detect clinically relevant changes in the fracture strength of patients with SCI and our future work will aim to test this hypothesis.
In summary, subject-specific FE models were able to predict torsional stiffness and strength of proximal tibiae better than statistical models based on DXA and QCT parameters. Given the strong correlations observed here between measured and FE predicted stiffness (cross-validation r2= 0.95; error = 10%) and strength (cross-validation r2= 0.91; error = 9%), we believe our modeling procedure has reached a level of accuracy necessary to derive clinically relevant information and help guide clinical decision making.
ACKNOWLEDGEMENTS
The project described was supported by Grant Number F32 AR061964 from NIAMS/NIH. Its contents are solely the responsibility of the authors and do not necessarily represent the official views of the NIAMS or NIH.
APPENDIX
Measures of CSA and TSI were calculated along the longitudinal axis of the proximal tibia and averaged within each region. CSA was calculated as the cumulative sum of voxel area within the periosteal surface boundary. TSI was calculated using the following equations (Lang et al., 2004):
where (Ix + Iy) is the modulus weighted polar moment of inertia of the cross-section, W is the effective bone width, Ei is the elastic modulus for the ith voxel located at (xi, yi), Ec is the elastic modulus of cortical bone, and is the modulus weighted centroid of the cross-section. Elastic moduli were determined using the density-elasticity relationship of Rho et al., (1995). The ρapp of cortical bone was set to 1.8 g/cm3, which is approximately 90% of the density of fully mineralized tissue (Carter and Beaupré, 2001).
Footnotes
Publisher's Disclaimer: This is a PDF file of an unedited manuscript that has been accepted for publication. As a service to our customers we are providing this early version of the manuscript. The manuscript will undergo copyediting, typesetting, and review of the resulting proof before it is published in its final citable form. Please note that during the production process errors may be discovered which could affect the content, and all legal disclaimers that apply to the journal pertain.
CONFLICT OF INTEREST The authors have no conflict of interest
REFERENCES
- Amin S, Kopperdhal DL, Melton LJ, 3rd, Achenbach SJ, Therneau TM, Riggs BL, Keaveny TM, Khosla S. Association of hip strength estimates by finite-element analysis with fractures in women and men. Journal of Bone and Mineral Research. 2011;26:1593–1600. doi: 10.1002/jbmr.347. [DOI] [PMC free article] [PubMed] [Google Scholar]
- Ashman RB, Rho JY, Turner CH. Anatomical variation of orthotropic elastic moduli of the proximal human tibia. Journal of Biomechanics. 1989;22:895–900. doi: 10.1016/0021-9290(89)90073-0. [DOI] [PubMed] [Google Scholar]
- Bayraktar HH, Morgan EF, Niebur GL, Morris GE, Wong EK, Keaveny TM. Comparison of the elastic and yield properties of human femoral trabecular and cortical bone tissue. Journal of Biomechanics. 2004;37:27–35. doi: 10.1016/s0021-9290(03)00257-4. [DOI] [PubMed] [Google Scholar]
- Bessho M, Ohnishi I, Matsuyama J, Matsumoto T, Imai K, Nakamura K. Prediction of strength and strain of the proximal femur by a CT-based finite element method. Journal of Biomechanics. 2007;40:1745–1753. doi: 10.1016/j.jbiomech.2006.08.003. [DOI] [PubMed] [Google Scholar]
- Biering-Sorensen F, Bohr HH, Schaadt OP. Longitudinal study of bone mineral content in the lumbar spine, the forearm and the lower extremities after spinal cord injury. European Journal of Clinical Investigation. 1990;20:330–335. doi: 10.1111/j.1365-2362.1990.tb01865.x. [DOI] [PubMed] [Google Scholar]
- Bonfield W, Grynpas MD. Spiral fracture of cortical bone. Journal of Biomechanics. 1982;15:555–559. doi: 10.1016/0021-9290(82)90068-9. [DOI] [PubMed] [Google Scholar]
- Carter DR, Beaupré GS. Skeletal function and form: mechanobiology of skeletal development, aging, and regeneration. Cambridge University Press; New York, NY: 2001. [Google Scholar]
- Cezayirlioglu H, Bahniuk E, Davy DT, Heiple KG. Anisotropic yield behavior of bone under combined axial force and torque. Journal of Biomechanics. 1985;18:61–69. doi: 10.1016/0021-9290(85)90045-4. [DOI] [PubMed] [Google Scholar]
- Cody DD, Gross GJ, Hou FJ, Spencer HJ, Goldstein SA, Fyhrie DP. Femoral strength is better predicted by finite element models than QCT and DXA. Journal of Biomechanics. 1999;32:1013–1020. doi: 10.1016/s0021-9290(99)00099-8. [DOI] [PubMed] [Google Scholar]
- Comarr AE, Hutchinson RH, Bors E. Extremity fractures of patients with spinal cord injuries. American Journal of Surgery. 1962;103:732–739. doi: 10.1016/0002-9610(62)90256-8. [DOI] [PubMed] [Google Scholar]
- Crawford RP, Cann CE, Keaveny TM. Finite element models predict in vitro vertebral body compressive strength better than quantitative computed tomography. Bone. 2003;33:744–750. doi: 10.1016/s8756-3282(03)00210-2. [DOI] [PubMed] [Google Scholar]
- Currey JD. Tensile yield in compact bone is determined by strain, post-yield behaviour by mineral content. Journal of Biomechanics. 2004;37:549–556. doi: 10.1016/j.jbiomech.2003.08.008. [DOI] [PubMed] [Google Scholar]
- Dalstra M, Huiskes R, Odgaard A, van Erning L. Mechanical and textural properties of pelvic trabecular bone. Journal of Biomechanics. 1993;26:523–535. doi: 10.1016/0021-9290(93)90014-6. [DOI] [PubMed] [Google Scholar]
- Dragomir-Daescu D, Op Den Buijs J, McEligot S, Dai Y, Entwistle RC, Salas C, Melton LJ, 3rd, Bennet KE, Khosla S, Amin S. Robust QCT/FEA models of proximal femur stiffness and fracture load during a sideways fall on the hip. Annals of Biomedical Engineering. 2011;39:742–755. doi: 10.1007/s10439-010-0196-y. [DOI] [PMC free article] [PubMed] [Google Scholar]
- Edwards WB, Troy KL. A linear-actuated torsional device to replicate clinically relevant spiral fractures in long bones. Proceedings of the Institution of Mechanical Engineers, Part H, Journal of Engineering in Medicine. 2012 doi: 10.1177/0954411912452996. doi: 10.1177/0954411912452996. [DOI] [PMC free article] [PubMed] [Google Scholar]
- Eser P, Frotzler A, Zehnder Y, Denoth J. Fracture threshold in the femur and tibia of people with spinal cord injury as determined by peripheral quantitative computed tomography. Archives of Physical Medicine and Rehabilitation. 2005;86:498–504. doi: 10.1016/j.apmr.2004.09.006. [DOI] [PubMed] [Google Scholar]
- Eser P, Frotzler A, Zehnder Y, Wick L, Knecht H, Denoth J, Schiessl H. Relationship between the duration of paralysis and bone structure: a pQCT study of spinal cord injured individuals. Bone. 2004;34:869–880. doi: 10.1016/j.bone.2004.01.001. [DOI] [PubMed] [Google Scholar]
- Freehafer AA, Hazel CM, Becker CL. Lower extremity fractures in patients with spinal cord injury. Paraplegia. 1981;19:367–372. doi: 10.1038/sc.1981.69. [DOI] [PubMed] [Google Scholar]
- Gray HA, Taddei F, Zavatsky AB, Cristofolini L, Gill HS. Experimental validation of a finite element model of a human cadaveric tibia. Journal of Biomechanical Engineering. 2008;130:031016. doi: 10.1115/1.2913335. [DOI] [PubMed] [Google Scholar]
- Guldberg RE, Hollister SJ, Charras GT. The accuracy of digital image-based finite element models. Journal of Biomechanical Engineering. 1998;120:289–295. doi: 10.1115/1.2798314. [DOI] [PubMed] [Google Scholar]
- Gupta A, Bavraktar HH, Fox JC, Keaveny TM, Papadopoulos P. Constitutive modeling and algorithmic implementation of a plasticity-like model for trabecular bone structures. Computational Mechanics. 2007;40:61–72. [Google Scholar]
- Hill R. A theory of the yielding and plastic flow of anisotropic metals. Proceedings of the Royal Society of London. Series A, Mathematical and Physical Sciences. 1948;193:281–297. [Google Scholar]
- Jepsen KJ, Davy DT. Comparison of damage accumulation measures in human cortical bone. Journal of Biomechanics. 1997;30:891–894. doi: 10.1016/s0021-9290(97)00036-5. [DOI] [PubMed] [Google Scholar]
- Keating JF, Kerr M, Delargy M. Minimal Trauma causing fractures in patients with spinal cord injury. Disability and Rehabilitation. 1992;14:108–109. doi: 10.3109/09638289209167081. [DOI] [PubMed] [Google Scholar]
- Keaveny TM. Strength of trabecular bone. In: Cown Stephen C., editor. Bone Mechanics Handbook. 2nd edition CRC Press; Boca Raton, FL: 2001. pp. 16–(1–42). [Google Scholar]
- Keaveny TM, Hoffmann PF, Singh M, Palermo L, Bilezikian JP, Greenspan SL, Black DM. Femoral bone strength and its relation to cortical and trabecular changes after treatment with PTH, alendronate, and their combination as assessed by finite element analysis of quantitative CT scans. Journal of Bone and Mineral Research. 2008;23:1974–1982. doi: 10.1359/JBMR.080805. [DOI] [PMC free article] [PubMed] [Google Scholar]
- Keaveny TM, McClung MR, Wan X, Kopperdahl DL, Mitlak BH, Krohn K. Femoral strength in osteoporotic women treated with teriparatide or alendronate. Bone. 2012;50:165–170. doi: 10.1016/j.bone.2011.10.002. [DOI] [PubMed] [Google Scholar]
- Keyak JH, Rossi SA, Jones KA, Les CM, Skinner HB. Prediction of fracture location in the proximal femur using finite element models. Medical Engineering & Physics. 2001;23:657–664. doi: 10.1016/s1350-4533(01)00094-7. [DOI] [PubMed] [Google Scholar]
- Koivumäki JE, Thevenot J, Pulkkinen P, Kuhn V, Link TM, Eckstein F, Jämsä T. Ct-based finite element models can be used to estimate experimentally measured failure loads in the proximal femur. Bone. 2012;50:824–829. doi: 10.1016/j.bone.2012.01.012. [DOI] [PubMed] [Google Scholar]
- Lang T, LeBlanc A, Evans H, Lu Y, Genant H, Yu A. Cortical and trabecular bone mineral loss from the spine and hip in long-duration spaceflight. Journal of Bone and Mineral Research. 2004;19:1006–1012. doi: 10.1359/JBMR.040307. [DOI] [PubMed] [Google Scholar]
- Lee TQ, Shapiro TA, Bell DM. Biomechanical properties of human tibias in long-term spinal cord injury. Journal of Rehabilitation Research and Development. 1997;34:295–302. [PubMed] [Google Scholar]
- Lewis G. Properties of acrylic bone cement: state of the art review. Journal of Biomedical Materials Research. 1997;38:155–182. doi: 10.1002/(sici)1097-4636(199722)38:2<155::aid-jbm10>3.0.co;2-c. [DOI] [PubMed] [Google Scholar]
- Martínez AA, Cuenca J, Herrera A, Domingo J. Late lower extremity fractures in patients with paraplegia. Injury. 2002;33:583–586. doi: 10.1016/s0020-1383(02)00163-8. [DOI] [PubMed] [Google Scholar]
- Modlesky CM, Majumdar S, Narasimhan A, Dudley GA. Trabecular bone microarchitecture is deteriorated in men with spinal cord injury. Journal of Bone and Mineral Research. 2004;19:48–55. doi: 10.1359/JBMR.0301208. [DOI] [PubMed] [Google Scholar]
- Morgan EF, Keaveny TM. Dependence of yield strain of human trabecular bone on anatomic site. Journal of Biomechanics. 2001;34:569–577. doi: 10.1016/s0021-9290(01)00011-2. [DOI] [PubMed] [Google Scholar]
- Morse LR, Battaglino RA, Stolzmann KL, Hallett LD, Waddimba A, Gagnon D, Lazzari AA, Garshick E. Osteoporotic fractures and hospitalization risk in chronic spinal cord injury. Osteoporosis International. 2009;20:385–392. doi: 10.1007/s00198-008-0671-6. [DOI] [PMC free article] [PubMed] [Google Scholar]
- Öhman C, Dall'Ara E, Baleani M, Van Sint Jan S, Viceconti M. The effects of embalming using a 4% formalin solution on the compressive mechanical properties of human cortical bone. Clinical Biomechanics. 2008;23:1294–1298. doi: 10.1016/j.clinbiomech.2008.07.007. [DOI] [PubMed] [Google Scholar]
- Orwoll ES, Marshall LM, Nielson CM, Cummings SR, Lapidus J, Cauley JA, Ensrud K, Lane N, Hoffmann PR, Kopperdahl DL, Keaveny TM, Osteoporotic Fractures in Men Study Group Finite element analysis of the proximal femur and hip fracture risk in older men. Journal of Bone and Mineral Research. 2009;24:475–483. doi: 10.1359/JBMR.081201. [DOI] [PMC free article] [PubMed] [Google Scholar]
- Rho JY. An ultrasonic method for measuring the elastic properties of human tibial cortical and cancellous bone. Ultrasonics. 1996;34:777–783. doi: 10.1016/s0041-624x(96)00078-9. [DOI] [PubMed] [Google Scholar]
- Rho JY, Hobatho MC, Ashman RB. Relations of mechanical properties to density and CT numbers in human bone. Medical Engineering & Physics. 1995;17:347–355. doi: 10.1016/1350-4533(95)97314-f. [DOI] [PubMed] [Google Scholar]
- Rincon-Kohli L, Zysset PK. Multi-axial mechanical properties of human trabecular bone. Biomechanics and Modeling in Mechanobiology. 2009;8:195–208. doi: 10.1007/s10237-008-0128-z. [DOI] [PubMed] [Google Scholar]
- Roberts BJ, Kopperdahl DL, Thrall E, Muller JA, Keaveny TM, Bouxsein ML. Prediction of femoral strength in a sideways fall configuration using QCT-based finite element analysis. Bone. 2009;44:S72. [Google Scholar]
- Tsai SW, Wu EM. A general theory of strength for anisotropic materials. Journal of Composite Materials. 1971;5:58–80. [Google Scholar]
- Unger S, Blauth M, Schmoelz W. Effects of three different preservation methods on the mechanical properties of human and bovine cortical bone. Bone. 2010;47:1048–1053. doi: 10.1016/j.bone.2010.08.012. [DOI] [PubMed] [Google Scholar]
- van Haaren EH, van der Zwaard BC, van der Veen AJ, Heyligers IC, Wuisman PI, Smit TH. Effect of long-term preservation on the mechanical properties of cortical bone in goats. Acta Orthopaedica. 2008;79:708–716. doi: 10.1080/17453670810016759. [DOI] [PubMed] [Google Scholar]
- Vestergaard P, Krogh K, Rejnmark L, Mosekilde L. Fracture rates and risk factors for fractures in patients with spinal cord injury. Spinal Cord. 1998;36:790–796. doi: 10.1038/sj.sc.3100648. [DOI] [PubMed] [Google Scholar]
- Wang X, Sanyal A, Cawthon PM, Palermo L, Jekir M, Christensen J, Ensrud KE, Cummings SR, Orwoll E, Black DM, Osteoporotic Fractures in Men (MrOS) Research Group. Keaveny TM. Prediction of new clinical vertebral fractures in elderly men using finite element analysis of CT scans. Journal of Bone and Mineral Research. 2012;27:808–816. doi: 10.1002/jbmr.1539. [DOI] [PMC free article] [PubMed] [Google Scholar]
- Zehnder Y, Luthi M, Michel D, Knecht H, Perrelet R, Neto I, Kraenzlin M, Zach G, Lippuner K. Long-term changes in bone metabolism, bone mineral density, quantitative ultrasound parameters, and fracture incidence after spinal cord injury: a cross-sectional observational study in 100 paraplegic men. Osteoporosis International. 2004;15:180–189. doi: 10.1007/s00198-003-1529-6. [DOI] [PubMed] [Google Scholar]


