

Abstract
Precise characterization of chromatin states is an important but difficult task for understanding the regulatory role of chromatin. A number of computational methods have been developed with varying levels of success. However, a remaining challenge is to model epigenomic patterns over multi-scales, as each histone mark is distributed with its own characteristic length scale. We developed a tiered hidden Markov model and applied it to analyze a ChIP-seq dataset in human embryonic stem cells. We identified a two-tier structure containing 15 distinct bin-level chromatin states grouped into three domain-level states. Whereas the bin-level states capture the local variation of histone marks, the domain-level states detect large-scale variations. Compared to bin-level states, the domain-level states are more robust and coherent. We also found active regions in intergenic regions that upon closer examination were expressed non-coding RNAs and pseudogenes. These results provide insights into an additional layer of complexity in chromatin organization.
Keywords: hidden Markov model, chromatin, computational biology
Introduction
In a multi-cellular organism, virtually all the cells share the same genome, but each cell-type has a distinct gene expression pattern. Chromatin provides an important layer of cell-type specific transcriptional control [1,2]. The basic unit of chromatin is the nucleosome, which wraps a 147 bp sequence of the genome. The nucleosome contains two copies each of four core histone proteins: H2A, H2B, H3 and H4 [3]. Each histone has an N-terminal tail that can be covalently modified at multiple positions. Distinct combinatorial patterns (also known as chromatin states) play important roles in transcriptional regulation [1, 2]. As genome-wide histone modification data are being generated in a rapid speed [4–13], there has been a growing interest in developing computational methods to precisely define chromatin states [10, 14–18]. Previous methods have mainly focused on detecting local chromatin state variation, whereas large-scale patterns (also known as domains) remain poorly characterized. Nevertheless, epigenetic domains have been identified in various data-types [19–25]. To systematically identify domain patterns from multiple histone marks, we recently developed a hidden Markov model, treating each gene as a separate unit [26]. By applying this method to analyze a collection of ChIP-seq datasets in 27 human cell lines, we found that chromatin states can be used to classify cell-types with high accuracy [27].
Rather than focusing on each length scale separately, it is desirable to characterize multi-scale chromatin states in a single computational framework. To this end, we present a new approach called tiered hidden Markov model (THMM). We tested this approach by analyzing a publicly available ChIP-seq dataset from the Roadmap Epigenome Project [8]. Our analysis identified a two-tiered structure of chromatin states, which we call the bin- and domain-level states. Whereas bin-level states can effectively capture local (200 bp) variation of histone modification patterns, the domain-level state detects large-scale (> 1Kb) variations. We show that this two-tier characterization is useful for better understanding the regulatory role of chromatin.
Results
Dataset Collection and Pre-processing
ChIP-seq data from the H1 human embryonic stem (ES) cell line was obtained from the Roadmap Epigenome Project [8] (http://www.epigenomebrowser.org/). Five modifications (H3K4mel, H3K4me3, H3K9me3, H3K27me3 and H3K36me3) with well-known biological functions were chosen for analysis. Raw sequence reads were mapped to non-overlapping 200bp bins via BEDTools [28] and normalized to have the unit of reads per million reads (RPM). Bins that overlapped 50% or more with known repetitive regions [29] were removed due to possible alignment issues. After removing these highly repetitive regions, the remaining 99.97% bins were analyzed further.
For simplicity, we focused on chromatin state organization around genie regions, and truncated the genome by keeping only the promoter and transcribed regions of protein-coding genes according to Refseq [30]. To be precise, in this study we use the term ‘promoter’ to include the region 2KB upstream from the transcription start site, whereas the ‘gene body’ is defined as the region from transcription start site to transcription end site. We thus excluded most intergenic regions, which consist of the majority of the genome, from our initial analysis. This truncated genome contains a total of 6,332,441 bins (1.27 Gb).
Tiered Chromatin States in Human ES Cells
We applied our THMM approach to characterize the chromatin states on the truncated genome in human ES cells based on the five histone modification marks mentioned above. Because of its smaller size, we first determined the optimal number of bin-level states by using the data on chromosome 22. Since the log-likelihood of the model increases monotonically with model complexity, we used permuted data as a control, and evaluated the difference of log-likelihood for observed and permuted data, which was generated by randomly reordering all bin locations on chromosome 22 without changing the corresponding sequence reads. This strategy is similar to the gap-statistic commonly used for k-means clustering [31]. We varied the number of bin-level states from three to twenty eight, and found that the log-likelihood differences between the observed and permuted data plateaus around K = 15 (Supplemental Figure 1), suggesting that the optimal number of bin-level states is around 15. As an additional validation, we found that 94% of truncated genome falls into one of the 15 most abundant combinatorial patterns (Supplemental Figure 2). We compared three non-degenerative tiered structures that are consistent with this constraint, corresponding to a “3 × 5” model (that is, three domains with five bin-level states per domain), a “4 × 4 “ model, and a “5 × 3 “ model, respectively. The “3 × 5” model has the best performance but quite similar to the “5 × 3 “ model (Supplemental Figure 3). For simplicity and interpretability, we selected the “3 × 5” model as the final model. We then refined the parameter value estimate by fitting the entire truncated genome (Table 1) and used it for the rest of the analysis in this paper (see Material and Methods for details).
Table 1.
Mean-level ChIPseq counts (RPM) for each chromatin state in the final THMM
| domain-level | non-active | null | active | ||||||||||||
|---|---|---|---|---|---|---|---|---|---|---|---|---|---|---|---|
|
| |||||||||||||||
| bin-level | 1 | 2 | 3 | 4 | 5 | 6 | 7 | 8 | 9 | 10 | 11 | 12 | 13 | 14 | 15 |
| H3K4me1 | 88.3 | 137.1 | 131.9 | 103.4 | 71.0 | 24.8 | 4.0 | 2.6 | 3.7 | 6.6 | 53.9 | 4.3 | 27.3 | 244.7 | 102.3 |
| H3K4me3 | 23.1 | 194.4 | 1921.4 | 35.7 | 7138.4 | 16.9 | 15.0 | 14.8 | 15.1 | 15.2 | 22.1 | 15.3 | 16797.0 | 5273.4 | 2017.1 |
| H3K9me3 | 9.2 | 148.4 | 7.5 | 5.5 | 5.4 | 5.3 | 5.0 | 2.8 | 13.2 | 4.6 | 77.7 | 6.0 | 6.1 | 398.0 | 6.3 |
| H3K27me3 | 51.9 | 9151.6 | 1044.3 | 7.6 | 36.1 | 6.4 | 4.7 | 4.4 | 6.0 | 9.7 | 7.7 | 4.3 | 7.0 | 173.1 | 7.6 |
| H3K36me3 | 6.2 | 44.5 | 4.4 | 7.6 | 2.4 | 9.2 | 23.8 | 3.3 | 6.0 | 2.7 | 80.2 | 138.8 | 4.6 | 614.1 | 15.2 |
We found certain similarities among the bin-level states associated with a common domain-level state; most bin-level states within a domain share similar histone modification patterns. The bin-level states associated with Domain 1 (States 1–5) are generally associated with high levels of H3K27me3; Domain 2 (States 6–10) is generally absent of all histone marks; while Domain 3 (States 11–15) is enriched with H3K4me3 and H3K36me3 and depleted of H3K27me3 (Table 1 and Figure 2). Following our previous work [26, 27], we annotated Domains 1–3 as non-active, null, and active, respectively.
Figure 2.
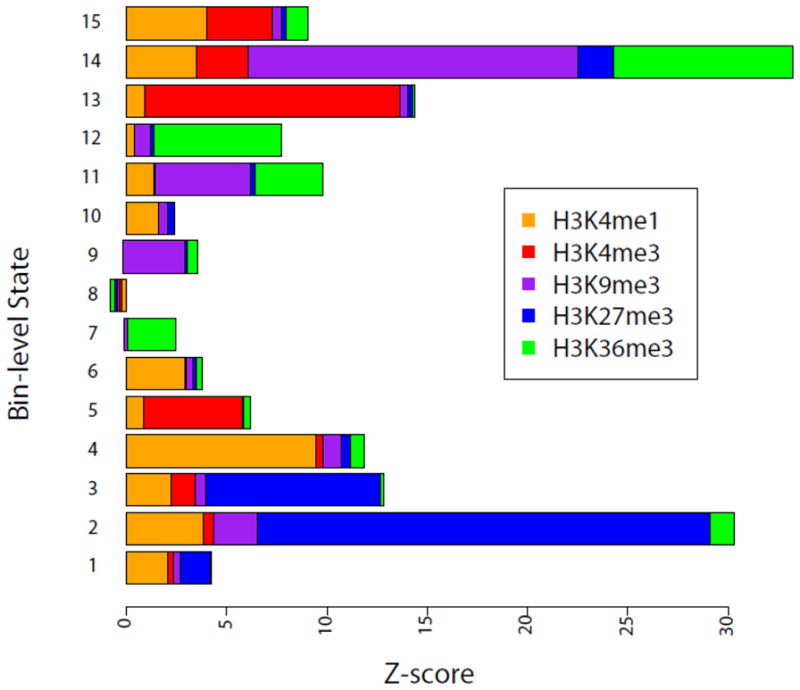
The combinatorial histone modification patterns associated with different chromatin states. The sequence counts are normalized by converting to Z-scores defined as follows:
where Xik is the average count for histone modification i=1, 2, 3, 4, 5 within state k=l, 2,…15, μi is the average modification level in the truncated genome, and σi is the standard deviation of histone modification i in the truncated genome.
Next we examined the overall distribution of the domain-level states. The majority (95.6%) of the truncated genome is assigned to the null domain (Figure 3, Supplemental Figure 4), which is also the largest on average, with a mean length of 53.9 bins (10.8 Kb), but the domain size is highly variable with a standard deviation (SD) of 79.3 bins (15.9 Kb). In comparison, the active (average length ± SD: 5.4 ± 8.3 Kb) and non-active (average length ± SD: 2.3 ± 2.6 KB) domains are smaller on average, and also have less absolute variability (though the relative variability is comparable). The null domains are primarily associated with introns, whereas the non-active domains are enriched in the promoter regions (Figure 4).
Figure 3.
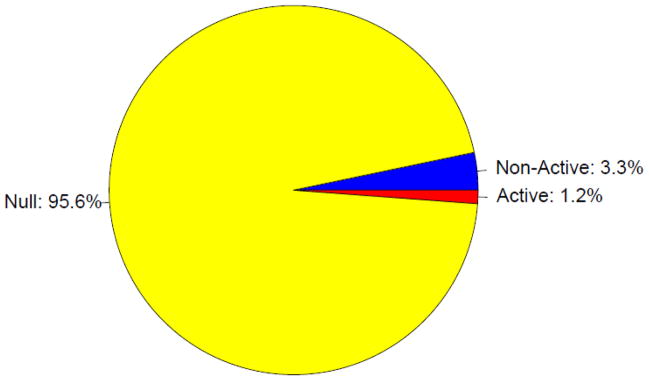
Proportion of the truncated genome in each domain. Domain colors are the same as in Figure 1.
Figure 4.
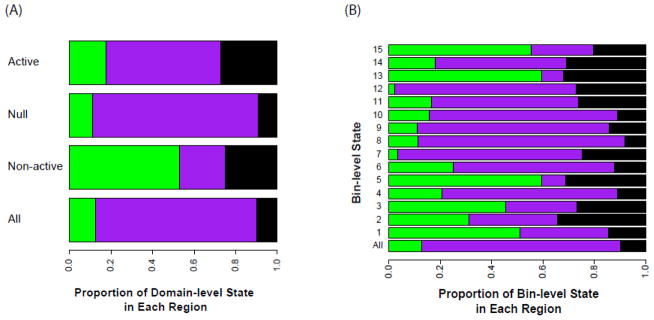
The proportion of each (A) domain-level and (B) bin-level state found in promoter (green), introns (purple) and exons (black) regions.
While chromatin states are defined based on histone modification data alone, they are useful only if the resulting annotations are also functionally meaningful. It is well known that chromatin plays an important role in gene regulation, and previous studies have shown that active and inactive genes are associated with different sets of histone marks [5]. For example, while H3K36me3 is enriched in highly transcribed genes, the H3K27me3 mark is associated with transcriptionally inactive genes. To test whether our unsupervised chromatin state annotation methods can recapitulate such differences, we analyzed an ES RNA-seq dataset [32], focusing on domain-level states. Raw sequence reads were processed as for the ChIP-seq data and scaled to reads per million reads (RPM). The active domain (States 11–15) is indeed enriched with significantly higher expression levels (average RNA-seq level ± SD: 1.1E4 ± 8.3E4 RPM) compared to other domains (two sample t-test versus null and non-active domain p-values < 0.0001) (Figure 5A), followed by the non-active domains (average RNA-seq level ± SD: 9.8E2 ± 1.7E4 RPM), and the null states have the lowest transcription level (average RNA-seq level ± SD: 3.9E3 ± 7.8E3 RPM). These transcription associated changes are consistent with a role of H3K27me3 in gene silencing [33]. Taken together, these results have provided a functional validation of our method.
Figure 5.
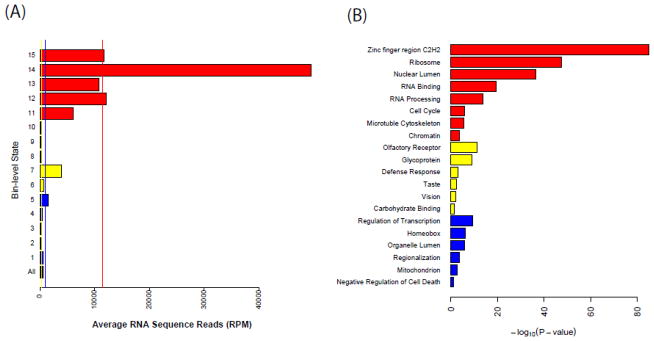
Functional characterization of the chromatin states. (A) The average RNA-seq values for each bin-level state. Vertical lines represent the mean value for each domain. The bottom track is the truncated genome-wide average. (B) Representative enriched functions and pathways identified using DAVID. P-values for enrichment in the corresponding DAVID category are determined by the Fisher exact test and adjusted for multiple testing by Benjamini-Hochberg procedure. Small p-values indicate evidence of an association with the corresponding DAVID category. Colors of each state correspond to domain membership as in Figure 1.
In addition, we applied the DAVID software to identify enriched functional categories that are associated with each domain type [34]. To avoid overlapping annotations, a gene striding multiple domain-level states was assigned to the most enriched one along that gene. As a result, we obtained 9,484 non-active, 11,703 null and 2,130 active genes for ES cells. The active genes are enriched with cell maintenance related functions such as the zinc finger region, ribosome, RNA binding, and cell cycle (Figure 5B), which are all known to be active in ES cells. Genes characterized by the null domains are involved in functions related to fully differentiated tissues such as olfactory receptor, defense response, taste and vision. In contrast, the non-active genes are related to development and cell growth such as the regulation of transcription, homeobox gene clusters, mitochondrion and, the negative regulation of cell death.
Bin-level state differences within each domain
While the bin-level states within each domain share similar properties, there still exist critical differences between them. For example, while all five bin-level states within the active domain are enriched in active genes, two (States 13 and 15) are more enriched in promoter regions (Figure 4B). State 13 is especially enriched with H3K4me3 and tends to colocalize with transcription start sites. In contrast, the other three states (States 11, 12, 14) are mainly located inside gene-bodies (Figure 4B). State 14 is especially enriched with the H3K36me3 mark (Figure 2) and, as expected, corresponds to the most actively transcribed regions (Figure 5A). These bin-level differences strongly suggest the utility of our two-tiered approach in detecting complex chromatin patterns associated with a common functional element.
Similarly, the bin-level states within the non-active domain are also different, with States 1, 3 and 5 more strongly enriched in promoter regions than the other two states (Figure 4B). Interestingly, State 3 has the signature of bivalent domains [35], enriched with both H3K4me3 and H3K27me3 marks. State 2 is highly enriched with H3K27me3 but devoid of H3K4me3 (Figure 2), corresponding to strong repression (Figure 5A). The null states are similar in general and are associated with low transcriptional activity, although State 7 is more enriched with H3K36me3 and transcribed at a higher level.
Robustness of domain-level states
Noise in experimental data leads to uncertainty of chromatin state annotations. Since the sensitivity of chromatin states on measurement error should decrease with respect to length scale, we expect that the domain-level states are more robust than the bin-level states. To test this hypothesis, we fit a THMM model independently on each of two replicates and quantified the accordance with Cohen’s κ [36] (see Methods for details). Indeed, we found that the domain-level states (κ = 0.81, p-value<0.0001; Supplemental Table 2) are more robust than the bin-level states (κ = 0.47, p-value<0.0001; Figure 6A). Compared to a single-scale approach, our THMM has provided the flexibility to prioritize either spatial-resolution or robustness, depending on the specific biological questions at hand.
Figure 6.
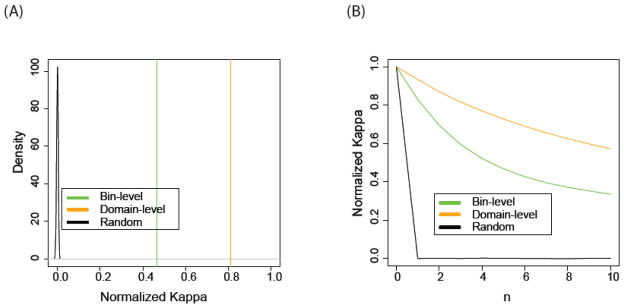
Comparison between the (A) robustness and (B) coherency of the bin-level and domain-level states. (A) The robustness of bin-level (green) or domain-level (yellow) chromatin states are evaluated by the agreement between assignment obtained independently from two replicates, and compared with random background (black curve). (B) The spatial coherence of bin-level (green) and domain-level (yellow) chromatin states are evaluated by the agreement between bin-pairs separated by a fixed lag n, where n is the number of 200bp bins.
Though each of our domains has an average length larger than 2 Kb, we wanted to compare the spatial coherency of the bin-level states to those of the domain-level states. To this end, we quantified κ from comparing the chromatin state of each bin with another one that is n bins away in the genome. We found that the domain-level states are more coherent than the bin-level states (Figure 6B). Even at a distance of 2 Kb, the domain-level states still retain a κ of 0.58, compared to 0.33 for bin-level states (and zero expected by chance).
Chromatin States in Intergenic Regions
We extended our investigation by applying the THMM to predict genome-wide chromatin states, including all the intergenic regions. In total, our analysis covered 15,863,683 bins (corresponding to 3.17 Gb) (Supplemental Table 3). As expected, the vast majority (98.8%) of intergenic bins were assigned to one of the null domain associated states (Figure 7, Supplemental Figure 5). The intergenic null domains (mean length ± SD = 26.4 ± 486.1 Kb) are typically larger (two-sample t-statistic p-value < 0.0001) than those in the truncated genome (mean length ± SD = 10.8 ± 15.9 Kb).
Figure 7.
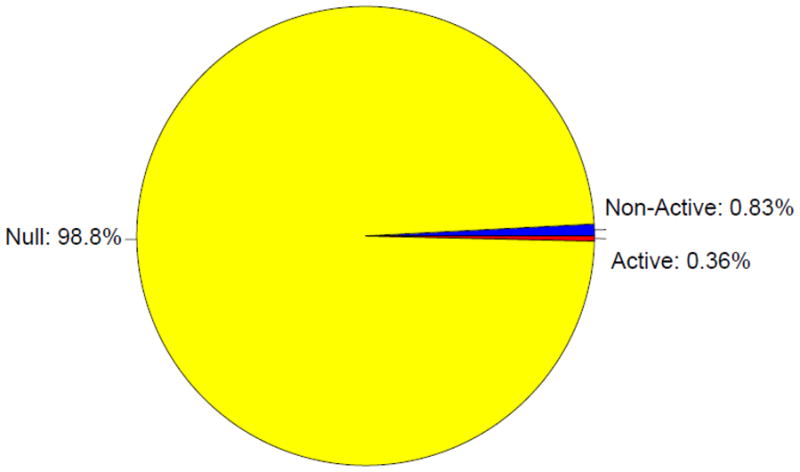
The distribution of domain assignment for the intergenic genome. 98.8% of the truncated genome is assigned to the null domain, 0.83% to the non-active domain, and 0.36% to the active domain. Domain colors are the same as in Figure 1.
Previous studies have identified large domains that are associated with lamina proteins[19]. These lamina-associated domains (LADs) are generally associated gene silencing. Interestingly, we found that the vast majority of LAD-associated bins are assigned to the null domain (Supplemental Figure 6), suggesting that the histone defined chromatin states are closely associated with the higher-order chromatin structure.
Of note, there are 34,024 intergenic bins that fall into the active domains. These domains are much shorter on average than in the truncated genome (mean size = 2.8 Kb and 5.4 Kb, respectively). We selected the RNA sequence reads that are mapped to intergenic regions, and then compared those mapped to the active domains with the intergenic background. We found that on average the expression level at the active domains is 25 times higher (mean value = 1.6E3 RPM and 66.4 RPM, respectively) (Supplemental Figure 7). For reference, the expression level in active domains in the truncated genome is much higher (mean value = 1.1E4 RPM, two-sample t-test p-value<0.0001).
One important class of non-coding RNA is long intergenic non-coding RNAs (lincRNAs), which have been increasingly recognized as key regulators of diverse cellular processes [37–39]. We mapped the above RNA-seq with known lincRNA annotations [40] to identify actively transcribed lincRNA in ES cells and found that they are highly enriched in active domains (χ2 = 2.8E2, df = 2, p-value < 0.0001). Moreover, the expression levels of lincRNAs are relatively high (mean value = 4.6E3 RPM) (Supplemental Figure 8).
Another interesting class of features in intergenic regions is pseudogenes, which has traditionally been thought as dysfunctional fossils of coding genes [41]. However, recent studies have suggested that a subset of pseudogenes still have functional roles, for example, by regulating the expression level of its parental allele [42, 43]. It remains unclear whether there are distinct epigenetic signatures associated with different classes of pseudogenes. While the majority of the pseudogenes (as annotated in http://pseudogene.org) are embedded in the null domain, a larger portion (2.54%) than the truncated genome (1.2%, two-sample test of proportions p-value < 0.0001) is mapped to the active domains. We annotated each pseudogene as active, null, or non-active, in the same way as for coding genes, and calculated the enrichment score of each subtype relative to the whole population of pseudogenes. Interestingly, we found that three immunoglobulin-related subtypes are highly enriched with active domains (Supplemental Figure 9, Supplemental Table 4). A functional role for immunoglobin pseudogenes has been proposed for more than a decade. These pesudogenes are highly conserved, have open reading frames, and retain canonical structure sequence patterns [42]. Our results suggest that active chromatin states may play a role in maintenance of their functional capacity. Taken together, the above results suggest that the domain-level states may be useful for detecting functional elements in intergenic regions.
Discussion
We have developed a THMM approach to systematically detect chromatin states over multiple length scales. There are a number of advantages of this two-tiered approach compared to the regular HMM approach used in previous studies: (1) the two-tiered chromatin states can be naturally interpreted as large- and small-scale chromatin structures, respectively, facilitating future biological investigations of the chromatin structures or interactions; (2) compared to a coarse-grained HMM model, the two-tiered approach preserves spatial resolution at the bin-level; and (3) the two-tiered approach is more robust than using a single-tier. Similar to our previous work [26, 27], we identified three domain-level chromatin states in ES cells, corresponding to active, non-active, and null domains, respectively. Furthermore, this new approach also allowed us to identify refined bin-level patterns within each domain, thereby increasing the spatial resolution. As such, our THMM approach has provided insights into an additional layer of complexity in chromatin state organizations.
While our analysis was mainly focused on the truncated genome containing only the protein-coding genes, we also found interesting patterns in intergenic regions by applying the THMM to predict whole-genome chromatin states. Specifically, we found that a large number of bins are characterized by a chromatin state within active domains. Closer examination suggests that a certain fraction of these domains are associated with either noncoding RNAs or pseudogenes. While similar results have been obtained by other methods in recent literature [38, 43], our two-tiered approach provided more refined description of the chromatin states. Our results suggest that chromatin state information may serve as a useful guide for detecting functional elements in intergenic regions.
Material and Methods
THMM Model
We have developed a THMM approach to model chromatin states at multiple length scales. THMM is a special kind of hidden Markov models (HMM) that contains a two-tiered hidden-state structure, which is suitable for detecting both bin- and domain-level states.
We started by fitting a fully connected HMM with K hidden states. Following previous work [18, 44], we modeled the emission probabilities as multivariate normal emission distributions; that is, the probability of observing the M-length vector Yj at the tth bin is:
where Ht is the hidden state, and μk and Σk are the mean and covariance of emission probability distribution for state k, respectively. We recognize that the sequence reads data may be better modeled with a Poisson or negative binomial distribution, but it is mathematically challenging to extend to multivariable setting and to incorporate into the HMM framework.
Let Yk be a matrix of the observed Yj’s assigned to state k; the log likelihood of the K means and covariances given the data is the sum of the corresponding log-likelihoods for each of the K states:
The model parameters were estimated by using the Baum-Welch algorithm [45]; the Viterbi algorithm [45] was used to obtain the maximum-likelihood estimate of the chromatin state at each bin location. In order to account for the trend of better fitting with more complex models, we determined the number of hidden states, K, by the log-likelihood difference between the observed and permutated data, as motivated by the gap-statistic for K-means clustering [31]. Specifically, for each value of K chosen between three and twenty eight, we computed the log-likelihood difference between the models for fitting the observed and permuted data. The permuted data were generated by permuting the bin locations across the truncated genome. While that the value of log-likelihood increases monotonically with K, saturation occurs around K = 15. As a compromise between model performance and complexity, we selected K = 15 or 16 in our final model.
As discussed in the main text, one limitation of this initial model is that it only models histone modification on a single length-scale (i.e., 200bp). To overcome this limitation, we divided the hidden states into clusters with the properties that intra-cluster states are fully connected, whereas inter-cluster transitions are confined to a specific state selected from each cluster. For clarification, we call these clusters the domain-level states, whereas the individual hidden states are referred to as the bin-level states. As shown in Figure 1, the resulting model is a special case of HMM whose topology is characterized by a tiered structure, hence called the tiered hidden Markov model (HMM).
Figure 1.

The topology of our THMM. Each bin-level state is represented by a circled color-coded according to its corresponding domain-level state (represented by a box). Note that transitions between different domain-level states can only occur via a special bin-level state from each domain. States within the null domain are represented by the color yellow; states within the active domain are shown in red; states within the non-active domain are in blue.
In order to infer the optimal THMM structure, we initialized the emission probability of each bin-level state based on our fully connected HMM. To determine how many bin-level states should be included in each domain, we made the simplifying assumption that the number of bin-level states in each domain is identical. Under this assumption, there are only three non-trivial possibilities, corresponding to three, four, or five domains, respectively. To determine which configuration is the best, we fitted each model to the data and evaluated the corresponding log-likelihood values. The configuration corresponding to the highest log-likelihood value was selected as the final model.
Quantification of agreement between different annotations
We used Cohen’s κ–statistic [36] to quantify the agreement between a pair of annotations along the genome, which may correspond to either the chromatin states identified from our computational model or functional annotations from curated databases. The κ–statistic is defined as
where Pa is the proportion of agreement between the two annotations, and Pe is the expected agreement due to chance as estimated by random permutation. Typically (but not always), the value of κ is between zero (no agreement) to one (perfect agreement). Values over 0.75 are often considered excellent, whereas those below 0.40 are considered poor. P-values are not typically calculated as small values of κ can be significantly different from zero [46]. To account for differences of the prevalence of different annotations, κ was further normalized by dividing by the maximum value κmax. We applied this approach to evaluate the reproducibility of chromatin state assignment to compare with known functional annotations.
Supplementary Material
Highlights.
We present a first computational model for multi-scale chromatin state identification.
We have identified a two-tier chromatin state structure in human embryonic stem cells.
We found that different domain types are associated with distinct biological functions.
Domain-levels states are more robust and functional coherent than bin-level states.
LincRNAs and Immunoglobin-related pseudogenes are highly enriched with active domains.
Acknowledgments
We are grateful to Drs. Manolis Kellis, Jason Ernst, Mark Gerstein, and Pradipta Ray for helpful discussions. This research was supported by the NIH grant HG006778 to GY.
Footnotes
Publisher's Disclaimer: This is a PDF file of an unedited manuscript that has been accepted for publication. As a service to our customers we are providing this early version of the manuscript. The manuscript will undergo copyediting, typesetting, and review of the resulting proof before it is published in its final citable form. Please note that during the production process errors may be discovered which could affect the content, and all legal disclaimers that apply to the journal pertain.
Contributor Information
Jessica L. Larson, Email: larsonj5@gene.com.
Curtis Huttenhower, Email: chuttenh@hsph.harvard.edu.
John Quackenbush, Email: johnq@jimmy.harvard.edu.
Guo-Cheng Yuan, Email: gcyuan@jimmy.harvard.edu.
References
- 1.Jenuwein T, Allis CD. Translating the histone code. Science. 2001;293:1074–1080. doi: 10.1126/science.1063127. [DOI] [PubMed] [Google Scholar]
- 2.Kouzarides T. Chromatin modifications and their function. Cell. 2007;128:693–705. doi: 10.1016/j.cell.2007.02.005. [DOI] [PubMed] [Google Scholar]
- 3.Kornberg RD, Lorch Y. Twenty-five years of the nucleosome, fundamental particle of the eukaryote chromosome. Cell. 1999;98:285–294. doi: 10.1016/s0092-8674(00)81958-3. [DOI] [PubMed] [Google Scholar]
- 4.Mikkelsen TS, Ku M, Jaffe DB, Issac B, Lieberman E, Giannoukos G, Alvarez P, Brockman W, Kim TK, Koche RP, Lee W, Mendenhall E, O’Donovan A, Presser A, Russ C, Xie X, Meissner A, Wernig M, Jaenisch R, Nusbaum C, Lander ES, Bernstein BE. Genome-wide maps of chromatin state in pluripotent and lineage-committed cells. Nature. 2007;448:553–560. doi: 10.1038/nature06008. [DOI] [PMC free article] [PubMed] [Google Scholar]
- 5.Barski A, Cuddapah S, Cui K, Roh TY, Schones DE, Wang Z, Wei G, Chepelev I, Zhao K. High-resolution profiling of histone methylations in the human genome. Cell. 2007;129:823–837. doi: 10.1016/j.cell.2007.05.009. [DOI] [PubMed] [Google Scholar]
- 6.The ENCODE Project Consortium. Identification and analysis of functional elements in 1% of the human genome by the ENCODE pilot project. Nature. 2007;447:799–816. doi: 10.1038/nature05874. [DOI] [PMC free article] [PubMed] [Google Scholar]
- 7.Heintzman ND, Hon GC, Hawkins RD, Kheradpour P, Stark A, Harp LF, Ye Z, Lee LK, Stuart RK, Ching CW, Ching KA, Antosiewicz-Bourget JE, Liu H, Zhang X, Green RD, Lobanenkov VV, Stewart R, Thomson JA, Crawford GE, Kellis M, Ren B. Histone modifications at human enhancers reflect global cell-type-specific gene expression. Nature. 2009;459:108–112. doi: 10.1038/nature07829. [DOI] [PMC free article] [PubMed] [Google Scholar]
- 8.Bernstein BE, Stamatoyannopoulos JA, Costello JF, Ren B, Milosavljevic A, Meissner A, Kellis M, Marra MA, Beaudet AL, Ecker JR, Farnham PJ, Hirst M, Lander ES, Mikkelsen TS, Thomson JA. The NIH Roadmap Epigenomics Mapping Consortium. Nat Biotechnol. 2010;28:1045–1048. doi: 10.1038/nbt1010-1045. [DOI] [PMC free article] [PubMed] [Google Scholar]
- 9.Ernst J, Kheradpour P, Mikkelsen TS, Shoresh N, Ward LD, Epstein CB, Zhang X, Wang L, Issner R, Coyne M, Ku M, Durham T, Kellis M, Bernstein BE. Mapping and analysis of chromatin state dynamics in nine human cell types. Nature. 2011;473:43–49. doi: 10.1038/nature09906. [DOI] [PMC free article] [PubMed] [Google Scholar]
- 10.Kharchenko PV, Alekseyenko AA, Schwartz YB, Minoda A, Riddle NC, Ernst J, Sabo PJ, Larschan E, Gorchakov AA, Gu T, Linder-Basso D, Plachetka A, Shanower G, Tolstorukov MY, Luquette LJ, Xi R, Jung YL, Park RW, Bishop EP, Canfield TK, Sandstrom R, Thurman RE, MacAlpine DM, Stamatoyannopoulos JA, Kellis M, Elgin SC, Kuroda MI, Pirrotta V, Karpen GH, Park PJ. Comprehensive analysis of the chromatin landscape in Drosophila melanogaster. Nature. 2011;471:480–485. doi: 10.1038/nature09725. [DOI] [PMC free article] [PubMed] [Google Scholar]
- 11.Bernstein BE, Birney E, Dunham I, Green ED, Gunter C, Snyder M. An integrated encyclopedia of DNA elements in the human genome. Nature. 2012;489:57–74. doi: 10.1038/nature11247. [DOI] [PMC free article] [PubMed] [Google Scholar]
- 12.Xu J, Shao Z, Glass K, Bauer DE, Pinello L, Van Handel B, Hou S, Stamatoyannopoulos JA, Mikkola HK, Yuan GC, Orkin SH. Combinatorial Assembly of Developmental Stage-Specific Enhancers Controls Gene Expression Programs during Human Erythropoiesis. Dev Cell. 2012;23:796–811. doi: 10.1016/j.devcel.2012.09.003. [DOI] [PMC free article] [PubMed] [Google Scholar]
- 13.Rada-Iglesias A, Bajpai R, Prescott S, Brugmann SA, Swigut T, Wysocka J. Epigenomic Annotation of Enhancers Predicts Transcriptional Regulators of Human Neural Crest. Cell Stem Cell. 2012 doi: 10.1016/j.stem.2012.07.006. [DOI] [PMC free article] [PubMed] [Google Scholar]
- 14.Hon G, Ren B, Wang W. ChromaSig: a probabilistic approach to finding common chromatin signatures in the human genome. PLoS Comput Biol. 2008;4:e1000201. doi: 10.1371/journal.pcbi.1000201. [DOI] [PMC free article] [PubMed] [Google Scholar]
- 15.Schuettengruber B, Ganapathi M, Leblanc B, Portoso M, Jaschek R, Tolhuis B, van Lohuizen M, Tanay A, Cavalli G. Functional anatomy of polycomb and trithorax chromatin landscapes in Drosophila embryos. PLoS Biol. 2009;7:e13. doi: 10.1371/journal.pbio.1000013. [DOI] [PMC free article] [PubMed] [Google Scholar]
- 16.Filion GJ, van Bemmel JG, Braunschweig U, Talhout W, Kind J, Ward LD, Brugman W, de Castro IJ, Kerkhoven RM, Bussemaker HJ, van Steensel B. Systematic protein location mapping reveals five principal chromatin types in Drosophila cells. Cell. 2010;143:212–224. doi: 10.1016/j.cell.2010.09.009. [DOI] [PMC free article] [PubMed] [Google Scholar]
- 17.Ernst J, Kellis M. Discovery and characterization of chromatin states for systematic annotation of the human genome. Nat Biotechnol. 2010;28:817–825. doi: 10.1038/nbt.1662. [DOI] [PMC free article] [PubMed] [Google Scholar]
- 18.Hoffman MM, Buske OJ, Wang J, Weng Z, Bilmes JA, Noble WS. Unsupervised pattern discovery in human chromatin structure through genomic segmentation. Nat Methods. 2012 doi: 10.1038/nmeth.1937. [DOI] [PMC free article] [PubMed] [Google Scholar]
- 19.Guelen L, Pagie L, Brasset E, Meuleman W, Faza MB, Talhout W, Eussen BH, de Klein A, Wessels L, de Laat W, van Steensel B. Domain organization of human chromosomes revealed by mapping of nuclear lamina interactions. Nature. 2008;453:948–951. doi: 10.1038/nature06947. [DOI] [PubMed] [Google Scholar]
- 20.Lian H, Thompson WA, Thurman R, Stamatoyannopoulos JA, Noble WS, Lawrence CE. Automated mapping of large-scale chromatin structure in ENCODE. Bioinformatics. 2008;24:1911–1916. doi: 10.1093/bioinformatics/btn335. [DOI] [PMC free article] [PubMed] [Google Scholar]
- 21.Wen B, Wu H, Shinkai Y, Irizarry RA, Feinberg AP. Large histone H3 lysine 9 dimethylated chromatin blocks distinguish differentiated from embryonic stem cells. Nat Genet. 2009;41:246–250. doi: 10.1038/ng.297. [DOI] [PMC free article] [PubMed] [Google Scholar]
- 22.Hawkins RD, Hon GC, Lee LK, Ngo Q, Lister R, Pelizzola M, Edsall LE, Kuan S, Luu Y, Klugman S, Antosiewicz-Bourget J, Ye Z, Espinoza C, Agarwahl S, Shen L, Ruotti V, Wang W, Stewart R, Thomson JA, Ecker JR, Ren B. Distinct epigenomic landscapes of pluripotent and lineage-committed human cells. Cell Stem Cell. 2010;6:479–491. doi: 10.1016/j.stem.2010.03.018. [DOI] [PMC free article] [PubMed] [Google Scholar]
- 23.Hansen KD, Timp W, Bravo HC, Sabunciyan S, Langmead B, McDonald OG, Wen B, Wu H, Liu Y, Diep D, Briem E, Zhang K, Irizarry RA, Feinberg AP. Increased methylation variation in epigenetic domains across cancer types. Nat Genet. 2011;43:768–775. doi: 10.1038/ng.865. [DOI] [PMC free article] [PubMed] [Google Scholar]
- 24.Lieberman-Aiden E, van Berkum NL, Williams L, Imakaev M, Ragoczy T, Telling A, Amit I, Lajoie BR, Sabo PJ, Dorschner MO, Sandstrom R, Bernstein B, Bender MA, Groudine M, Gnirke A, Stamatoyannopoulos J, Mirny LA, Lander ES, Dekker J. Comprehensive mapping of long-range interactions reveals folding principles of the human genome. Science. 2009;326:289–293. doi: 10.1126/science.1181369. [DOI] [PMC free article] [PubMed] [Google Scholar]
- 25.Dixon JR, Selvaraj S, Yue F, Kim A, Li Y, Shen Y, Hu M, Liu JS, Ren B. Topological domains in mammalian genomes identified by analysis of chromatin interactions. Nature. 2012;485:376–380. doi: 10.1038/nature11082. [DOI] [PMC free article] [PubMed] [Google Scholar]
- 26.Larson JL, Yuan GC. Epigenetic domains found in mouse embryonic stem cells via a hidden Markov model. BMC Bioinformatics. 2010;11:557. doi: 10.1186/1471-2105-11-557. [DOI] [PMC free article] [PubMed] [Google Scholar]
- 27.Larson JL, Yuan GC. Chromatin states accurately classify cell differentiation stages. PloS one. 2012;7:e31414. doi: 10.1371/journal.pone.0031414. [DOI] [PMC free article] [PubMed] [Google Scholar]
- 28.Quinlan AR, Hall IM. BEDTools: a flexible suite of utilities for comparing genomic features. Bioinformatics. 2010;26:841–842. doi: 10.1093/bioinformatics/btq033. [DOI] [PMC free article] [PubMed] [Google Scholar]
- 29.Smit A, Hubley R, Green P. RepeatMasker Open-3.0. 1996–2010 [Google Scholar]
- 30.Pruitt KD, Tatusova T, Maglott DR. NCBI reference sequences (RefSeq): a curated non-redundant sequence database of genomes, transcripts and proteins. Nucleic Acids Res. 2007;35:D61–65. doi: 10.1093/nar/gkl842. [DOI] [PMC free article] [PubMed] [Google Scholar]
- 31.Tibshirani R, Walther G, Hastie T. Estimating the number of clusters in a data set via the gap statistic. Journal of the Royal Statistical Society, Series B. 2001;63:411–423. [Google Scholar]
- 32.Trapnell C, Williams BA, Pertea G, Mortazavi A, Kwan G, van Baren MJ, Salzberg SL, Wold BJ, Pachter L. Transcript assembly and quantification by RNA-Seq reveals unannotated transcripts and isoform switching during cell differentiation. Nat Biotechnol. 2010;28:511–515. doi: 10.1038/nbt.1621. [DOI] [PMC free article] [PubMed] [Google Scholar]
- 33.Guenther MG, Young RA. Transcription. Repressive transcription. Science. 2010;329:150–151. doi: 10.1126/science.1193995. [DOI] [PMC free article] [PubMed] [Google Scholar]
- 34.Huang da W, Sherman BT, Lempicki RA. Bioinformatics enrichment tools: paths toward the comprehensive functional analysis of large gene lists. Nucleic Acids Res. 2009;37:1–13. doi: 10.1093/nar/gkn923. [DOI] [PMC free article] [PubMed] [Google Scholar]
- 35.Bernstein BE, Mikkelsen TS, Xie X, Kamal M, Huebert DJ, Cuff J, Fry B, Meissner A, Wernig M, Plath K, Jaenisch R, Wagschal A, Feil R, Schreiber SL, Lander ES. A bivalent chromatin structure marks key developmental genes in embryonic stem cells. Cell. 2006;125:315–326. doi: 10.1016/j.cell.2006.02.041. [DOI] [PubMed] [Google Scholar]
- 36.Cohen J. A coefficient of agreement for nominal scales. Educational and Psychological Measurement. 1960;20:37–46. [Google Scholar]
- 37.Rinn JL, Kertesz M, Wang JK, Squazzo SL, Xu X, Brugmann SA, Goodnough LH, Helms JA, Farnham PJ, Segal E, Chang HY. Functional demarcation of active and silent chromatin domains in human HOX loci by noncoding RNAs. Cell. 2007;129:1311–1323. doi: 10.1016/j.cell.2007.05.022. [DOI] [PMC free article] [PubMed] [Google Scholar]
- 38.Guttman M, Amit I, Garber M, French C, Lin MF, Feldser D, Huarte M, Zuk O, Carey BW, Cassady JP, Cabili MN, Jaenisch R, Mikkelsen TS, Jacks T, Hacohen N, Bernstein BE, Kellis M, Regev A, Rinn JL, Lander ES. Chromatin signature reveals over a thousand highly conserved large non-coding RNAs in mammals. Nature. 2009;458:223–227. doi: 10.1038/nature07672. [DOI] [PMC free article] [PubMed] [Google Scholar]
- 39.Khalil AM, Guttman M, Huarte M, Garber M, Raj A, Rivea Morales D, Thomas K, Presser A, Bernstein BE, van Oudenaarden A, Regev A, Lander ES, Rinn JL. Many human large intergenic noncoding RNAs associate with chromatin-modifying complexes and affect gene expression. Proc Natl Acad Sci U S A. 2009;106:11667–11672. doi: 10.1073/pnas.0904715106. [DOI] [PMC free article] [PubMed] [Google Scholar]
- 40.Loewer S, Cabili MN, Guttman M, Loh YH, Thomas K, Park IH, Garber M, Curran M, Onder T, Agarwal S, Manos PD, Datta S, Lander ES, Schlaeger TM, Daley GQ, Rinn JL. Large intergenic non-coding RNA-RoR modulates reprogramming of human induced pluripotent stem cells. Nat Genet. 2010;42:1113–1117. doi: 10.1038/ng.710. [DOI] [PMC free article] [PubMed] [Google Scholar]
- 41.Mighell AJ, Smith NR, Robinson PA, Markham AF. Vertebrate pseudogenes. FEBS letters. 2000;468:109–114. doi: 10.1016/s0014-5793(00)01199-6. [DOI] [PubMed] [Google Scholar]
- 42.Balakirev ES, Ayala FJ. Pseudogenes: are they “junk” or functional DNA? Annual review of genetics. 2003;37:123–151. doi: 10.1146/annurev.genet.37.040103.103949. [DOI] [PubMed] [Google Scholar]
- 43.Pei B, Sisu C, Frankish A, Howald C, Habegger L, Mu XJ, Harte R, Balasubramanian S, Tanzer A, Diekhans M, Reymond A, Hubbard TJ, Harrow J, Gerstein MB. The GENCODE pseudogene resource. Genome biology. 2012;13:R51. doi: 10.1186/gb-2012-13-9-r51. [DOI] [PMC free article] [PubMed] [Google Scholar]
- 44.Day N, Hemmaplardh A, Thurman RE, Stamatoyannopoulos JA, Noble WS. Unsupervised segmentation of continuous genomic data. Bioinformatics. 2007;23:1424–1426. doi: 10.1093/bioinformatics/btm096. [DOI] [PubMed] [Google Scholar]
- 45.Durbin R, Eddy S, Krogh A, Mitchison G. Biological sequence analysis. Cambridge University Press; 1998. [Google Scholar]
- 46.Fleiss J. Measuring nominal scale agreement among many raters. Psychological Bulletin. 1971;76:378–382. [Google Scholar]
Associated Data
This section collects any data citations, data availability statements, or supplementary materials included in this article.