

Abstract
The noninvasive measurement of the mechanical properties of brain tissue using magnetic resonance elastography (MRE) has emerged as a promising method for investigating neurological disorders. To date, brain MRE investigations have been limited to reporting global mechanical properties, though quantification of the stiffness of specific structures in the white matter architecture may be valuable in assessing the localized effects of disease. This paper reports the mechanical properties of the corpus callosum and corona radiata measured in healthy volunteers using MRE and atlas-based segmentation. Both structures were found to be significantly stiffer than overall white matter, with the corpus callosum exhibiting greater stiffness and less viscous damping than the corona radiata. Reliability of both local and global measures was assessed through repeated experiments, and the coefficient of variation for each measure was less than 10%. Mechanical properties within the corpus callosum and corona radiata demonstrated correlations with measures from diffusion tensor imaging pertaining to axonal microstructure.
Keywords: elastography, brain, white matter, corpus callosum, microstructure
1. Introduction
Alteration of white matter microstructure caused by inflammation, demyelination, destruction of axons, or disruption of the glial matrix is a hallmark of many neurological diseases and disorders. Although several methods have been developed to infer microstructural information using magnetic resonance imaging (MRI), the correlation between imaging and clinical measures remains weak (Sahraian and Eshaghi, 2010). A more sensitive and direct assessment of the health of the parenchyma, or a multi-modal approach to examine intra- and extra-axonal integrity of brain tissue (Oishi et al., 2011), will enable measures to better distinguish early onset of disease (Mueller et al., 2005), aid in differential diagnosis (Miller et al., 2008), or monitor disease progression (Mueller et al., 2006).
The most common technique for noninvasively investigating white matter microstructure is diffusion tensor imaging (DTI). DTI probes restricted diffusion of water in tissue, and can reflect axonal organization, integrity, and myelination. However, most DTI measures depend on both intra-axonal membranes and myelin sheath and thus often lack specificity in disease. For example, radial diffusivity measures from DTI captured cuprizone-induced demyelination in the corpus callosum of mice (Song et al., 2005; Sun et al., 2006), though not in the early stages of demyelination due to the additional presence of axonal damage and inflammation (Wang et al., 2011). Measures based on the mechanical properties of brain tissue, on the other hand, can be more sensitive to both intra- and extra-axonal microstructure, and may provide diagnostic specificity in a number of diseases where diffusion measures are inadequate. In a similar study of cuprizone in mice, alterations to extracellular matrix integrity were marked by a decrease in viscoelastic damping ratio (Schregel et al., 2012), while another study of experimental autoimmune encephalomyelitis found a loss of shear modulus, or stiffness, with inflammation while damping ratio remained unchanged (Riek et al., 2012). These results indicate that measuring the mechanical properties of the brain white matter may provide additional information about extra-axonal microstructural characteristics, and may be useful in identifying or evaluating the early stages of diseases like multiple sclerosis, especially when coupled with other modalities like DTI.
The emergence of magnetic resonance elastography (MRE) (Muthupillai et al., 1995) provides researchers with a powerful tool to noninvasively investigate the mechanical properties of the human brain in vivo (Sack et al., 2011; Weaver et al., 2012; Zhang et al., 2011). Recent reports of MRE suggest a decrease in viscoelastic properties of the human brain in a number of neuroinflammatory and neurodegenerative disorders, including Alzheimer's disease (Murphy et al., 2011), multiple sclerosis (Streitberger et al., 2012; Wuerfel et al., 2010), and normal pressure hydrocephalus (Freimann et al., 2012; Streitberger et al., 2011), as well as in normal physiological aging (Sack et al., 2011; 2009). However, the lack of spatially resolved property maps generated in these studies limits the clinical applicability of brain MRE. To date, MRE studies have reported mechanical properties averaged over the whole brain or over broad regions of interest, thus missing potentially significant localized effects. Global mechanical measures are also not likely to be very specific since they exhibit the same trends (decrease in shear modulus) in the neurological conditions investigated to date. Reliably estimating local mechanical properties may improve both sensitivity and specificity to disease, since many neurological disorders have localized origins or distinct regions of tissue disruption.
Technical considerations associated with imaging constraints often impede the measurement of local mechanical properties in humans with MRE. For example, the requirement of short scan times leads to the use of acquisitions with poor spatial resolution that under-sample the 3D shear displacement field. It is also challenging to capture shear deformations of fine wavelength with high signal-to-noise ratio (SNR) as high frequency vibration amplitude attenuates rapidly in the center of the brain. These acquisitions effectively obscure fine-scale features in the tissue and compromise the reliability of MRE measures of white matter tracts. Recently, we introduced an acquisition technique capable of acquiring three-dimensional, full vector field MRE displacement data with improved spatial resolution while maintaining adequate SNR to produce highly-resolved mechanical property maps when coupled with finite-element based inversion (Johnson et al., 2012). We demonstrated that estimating focal mechanical properties with displacement data at higher spatial resolution and nonlinear inversion (NLI) is advantageous in resolving local stiffness variations in the brain. However, the reliability of these observed fine-scale features and their correlation with white matter structure has yet to be explored.
This paper reports the first in vivo measurement of the local variations in mechanical properties of the human brain revealed by MRE. Using a white matter atlas (Mori et al., 2008), we present MRE property maps which quantify the stiffness of the corpus callosum and corona radiata in healthy subjects, and demonstrate the reliability of these measures by performing repeated experiments on the same subject. Additionally, we show that the MRE mechanical characteristics of tissue within the corpus callosum and corona radiata demonstrate high correlations with measures of underlying microstructure obtained from DTI and corroborated by histological data available in the literature.
2. Materials and Methods
A group of seven healthy volunteers (age range: 24–53 years; median age: 30 years; all male) provided written informed consent for this study approved by our Institutional Review Board. The imaging protocol consisted of MRE, DTI, and structural acquisitions, with all scanning performed on a Siemens 3T Allegra head-only scanner (Siemens Medical Solutions; Erlangen, Germany). One volunteer (24 years old) visited six times over two months for testing the reliability of elastography measures.
2.1. MRE Acquisition and NLI
A remote electromagnetic shaker generated shear displacements in the brain by driving a long rod attached to a custom head rocker, similar to systems previously described (Johnson et al., 2012; Sack et al., 2009; Wuerfel et al., 2010). Acquisition of MRE displacement data utilized a multishot, variable-density spiral sequence with trapezoidal bipolar gradient pairs matched to vibration period on either side of the spin-echo refocusing pulse (Johnson et al., 2012). Repetition of imaging with gradients applied on three orthogonal axes over eight time points resulted in three-dimensional, full vector field complex displacements at 50 Hz with 2 × 2 × 2 mm3 isotropic spatial resolution. The imaging volume comprised twenty axial slices with 2 mm thickness covering the ventricles, corpus callosum, and corona radiata. Acquisition time for a complete MRE dataset totaled 9 minutes 36 seconds. We used the octahedral shear strain-based SNR measure (OSS-SNR) to determine the quality of each dataset for inclusion in the study (McGarry et al., 2011). Based on the OSS-SNR value averaged over the entire imaging volume, we eliminated the data from one volunteer and from one visit of the repeated subject, as these datasets did not meet the required OSS-SNR threshold of 3.0.
NLI estimated the mechanical properties of tissue from displacement data using a viscoelastic material model (Van Houten et al., 2001). The mechanical properties reported in this paper are the storage and loss moduli, G' and G”, respectively, which were reconstructed at the same spatial resolution as the displacement data (McGarry et al., 2012), and the damping ratio, ξ, which is equal to G”/2G'. Previous works by our group provide full details on the data acquisition and inversion methods applied in this study (Johnson et al., 2012; McGarry et al., 2012).
Each imaging session included the acquisition of DTI data acquired over the same imaging volume and with the same spatial resolution as the MRE scans. DTI scans used a b-value of 1000 s/mm2 and twelve directions in a single-shot echo-planar imaging acquisition. The FDT diffusion toolkit in FSL (Jenkinson et al., 2012) fit diffusion data to the tensor model and extracted DTI metrics, including fractional anisotropy (FA) and radial diffusivity (RD). The Diffusion Toolkit and TrackVis programs tracked and visualized fiber pathways in the brain from DTI data (Wang et al., 2007). Additionally, a high-resolution MPRAGE acquisition produced T1-weighted anatomical images with 1 × 1 × 1 mm3 isotropic voxels for segmentation.
2.2. Image Segmentation
Image registration and segmentation used FSL. Skull-stripping of the T1-weighted anatomical images used the BET tool (Smith, 2002), then the FAST tool was used to segment cortical gray matter (GM), white matter (WM), and cerebrospinal fluid (Zhang et al., 2001). Linear registration of the anatomical images to the MRE data with the FLIRT tool (Jenkinson et al., 2002) allowed for creation of GM and WM masks for each dataset using a partial volume threshold of 0.7. Any contribution from deep gray matter structures was manually removed from GM masks and not quantified.
Segmentation of individual structures in the white matter architecture utilized the ICBM-DTI-81 white matter atlas and parcellation map (Mori et al., 2008). Registration of the ICBM-152 template (Mazziotta et al., 2001) to anatomical T1-weighted images used the FNIRT tool (Andersson et al., 2008), and application of the same transformation also registered the white matter atlas. Further registration using the FLIRT transforms generated individual masks of the corpus callosum (CC) and corona radiata (CR) for each dataset.
3. Results and Discussion
Figure 1 provides an overview of the typical MRE results, along with anatomical structure for comparison. A multishot MRE acquisition captures shear wave displacements generated in the brain with improved spatial resolution (Johnson et al., 2012), and the finite element-based NLI (Van Houten et al., 2001) uses these shear wave displacements to generate maps of the mechanical properties of the tissue. The algorithm returns the storage and loss moduli, G' and G”, respectively (Figures 1C–D). We calculate the damping ratio, ξ, as well, which describes the level of motion attenuation in the tissue. ξ is similar in meaning to the mechanical phase angle (Schregel et al., 2012) or fractional springpot parameter (Sack et al., 2009) used to previously investigate motion attenuation properties of tissue.
Figure 1.

Spatial variations in mechanical properties juxtaposed with structures in the white matter architecture. (A) Magnitude image from MRE dataset; (B) T1-weighted anatomical image after registration to MRE data; (C) map of storage modulus, G'; (D) map of loss modulus, G”; and (E) color fractional anisotropy map from DTI after registration to MRE data. Representative masks for the corpus callosum and corona radiata are outlined in red and blue, respectively, on B, C, and D. (F) Visualization of white matter fibers through the corpus callosum and corona radiata with tractography from DTI data where color corresponds to G' from MRE. Different image boundaries of property maps, C and D, are due to manual data mask applied prior to inversion and don't affect registration.
Starting from the spatially resolved mechanical properties from MRE, we used the ICBM-DTI-81 white matter atlas (Mori et al., 2008) on the ICBM-152 template (Mazziotta et al., 2001) to investigate the CC and CR. Registration of the atlas to an individual MRE dataset involves first registering the template to the high-resolution T1-weighted images, which are then registered to the magnitude images from the MRE data (Figure 1A). The registered T1-weighted images (Figure 1B) allow for individual masks of the CC and CR to be drawn on the MRE property maps (Figures 1C–D). Figure 1E provides the corresponding FA image from DTI for comparison. Clearly visible are the left-right fibers of the CC in red and the superior-inferior fibers of the CR in blue, lateral to the CC. The locations of each structure agree well with the atlas-based masks.
Tractography from DTI data enables the tracking of white matter fiber bundles in 3D. We overlaid the spatial maps of the mechanical properties on the estimated tracks to visualize the correlation with fiber structure. Figure 1F presents the tracking of fibers in the left hemisphere passing through the CC and CR, with color representing storage modulus, G', from MRE. The fibers of the CR, fanning out lateral to the CC, are softer than the CC, whose fibers are potentially packed more tightly in its highly organized structure. Significant heterogeneity is apparent, especially in the CC where the genu, body, and splenium exhibit different stiffness. Fibers of the forceps anterior and posterior extending from the genu and splenium, respectively, appear as stiff bundles. Additionally, as the fibers of the CR extend into more superficial white matter they become softer. In the following sections we first evaluate the repeatability of the MRE measures from displacement images with 2 mm isotropic spatial resolution, then we quantify local and global mechanical properties and discuss the spatial heterogeneity in mechanical properties.
3.1. Repeatability of Local MRE Measures
We acquired five MRE datasets on a single subject to investigate the repeatability of the global and local MRE measures. Figure 2 presents one slice of the average MRE property images with corresponding standard deviation maps for the repeated subject after co-registration to the T1-weighted anatomical dataset. Also presented are maps of coefficient of variation, defined as the standard deviation over the mean, for each property (Figures 2G–I). The anatomical features of a single experiment (Figure 1) – including low G' in the lateral ventricles, elevated G' of the CC and CR, and lower G” of the CC – are still evident in the averaged data. Standard deviation maps demonstrate that property variation across experiments is very small and show no significant peaks corresponding to anatomical structure, except for ξ in the lateral ventricles (Figure 2F). The ventricles are structures filled with cerebrospinal fluid and were not excluded during the inversion. In fact they were treated as solid tissue continuous with the brain parenchyma, which leads to errors from model-data mismatch. However, we did exclude the ventricles in our post-processing property analysis through segmentation, so these model-data errors do not propagate to the surrounding tissues (because of the local zoning approach used by NLI (Van Houten et al., 2001)), and thus, do not affect the results presented in the following sections.
Figure 2.

Demonstration of MRE measurement repeatability. Top row: property maps of (A) G', (B) G”, and (C) ξ co-registered and averaged over five examinations of the repeated subject. Middle row: standard deviation maps of the same properties: (D) G', (E) G”, and (F) ξ. Bottom row: coefficient of variation maps, defined as standard deviation divided by mean, for each property: (G) G', (H) G”, and (I) ξ. Local property values are consistent across repeat examinations, and all properties exhibit modest variation. Higher variations at the edge of the brain are due to co-registration of datasets with different masks.
We quantified the repeatability of mechanical property measures of both global and local regions in the brain. Global regions are GM and WM, while local regions include the body of the CC and the superior segment of the CR. We only compared the central segment of each structure, since the limited image acquisition volume resulted in the anterior and posterior segments of each structure being partially captured in each MRE exam. Both structures also exhibited significant heterogeneity between segments, which further motivated this decision and will be discussed later.
Table 1 lists the coefficient of variation for each regional mechanical measure from repeated exams of the same subject. Coefficients of variation are less than 10% for each measure demonstrating the excellent repeatability of the MRE results. Especially notable is the high repeatability of the CC and CR properties, two clinically important structures in the brain not previously studied with MRE due to lack of spatial resolution in previous measurements. These results indicate that MRE with improved imaging resolution is capable of capturing anatomical variations in the form of highly reliable mechanical property maps.
Table 1.
Coefficient of variation, defined as standard deviation over mean, for each regional mechanical property measure determined from five separate examinations of the same subject.
| GM | WM | CC | CR | |
|---|---|---|---|---|
| G' | 4.59% | 5.71% | 8.71% | 5.79% |
| G ” | 5.84% | 6.33% | 5.42% | 7.17% |
| ξ | 3.83% | 5.58% | 9.15% | 7.25% |
3.2. Comparison of Local and Global MRE Measures
We also examined six healthy subjects, and Figure 3 presents the average G', G”, and ξ property values for each region across the subjects. Two-way analyses of variance (ANOVA), with subject and region as independent variables, indicated significant difference between regions for all properties (p < 0.05). Individual post hoc Wilcoxon signed-rank tests compared different regions with significance set at p < 0.05. Table 2 collects all average property values and their standard deviations.
Figure 3.
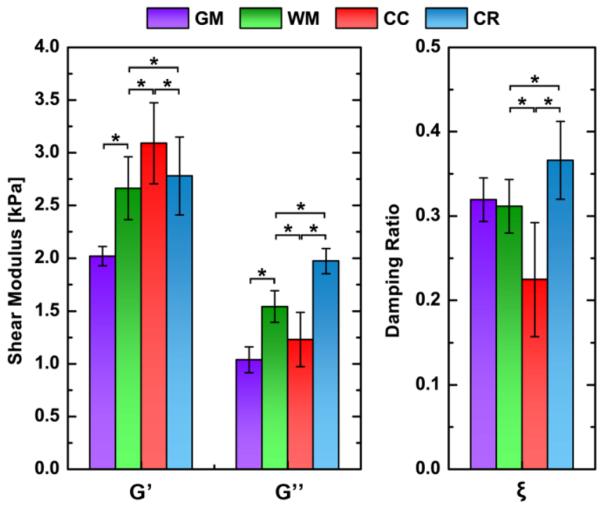
Global (GM and WM) and local (CC and CR) property values averaged over the subject population; * denotes statistically significant difference (p < 0.05). WM is significantly different from GM in G' and G”, though not in ξ. CC and CR differ significantly from WM and each other in all properties, demonstrating that they are mechanically distinct structures. Note that CC refers to the body of the CC, and CR refers to the superior segment of the CR.
Table 2.
Average values and standard deviations for regional mechanical properties across all subjects.
| GM | WM | CC | CR | |
|---|---|---|---|---|
| G' [kPa] | 2.02 ± 0.09 | 2.66 ± 0.30 | 3.09 ± 0.39 | 2.78 ± 0.37 |
| G” [kPa] | 1.04 ± 0.12 | 1.54 ± 0.15 | 1.23 ± 0.26 | 1.97 ± 0.12 |
| ξ | 0.32 ± 0.03 | 0.31 ±0.03 | 0.23 ± 0.07 | 0.37 ± 0.05 |
Global comparisons of WM vs. GM show significantly greater G' and G” for WM, though they do not demonstrate a significant difference in the damping ratio, ξ. Shear modulus values for WM compare well with recent brain MRE studies (Green et al., 2008; Zhang et al., 2011), although the difference between WM and GM is somewhat greater in the present study. We previously reported this finding and attributed the difference to the improved spatial resolution of our acquisition in resolving material properties of the GM (Johnson et al., 2012). Here, we find WM approximately 32% stiffer than GM, a relationship that matches the ex vivo literature (van Dommelen et al., 2010). However, whether in vivo MRE, as implemented here, can accurately quantify the mechanical properties of GM remains to be established, due to the thin structure of the cortex (Papazoglou et al., 2012). Given the statistical difference with WM and the high repeatability of the GM measures, we conclude that MRE displacement data with 2 mm isotropic resolution and NLI is capable of producing reliable and useful estimates of GM properties, though future work will be needed to evaluate residual bias in the property estimates of GM that may occur from under-sampling due to spatial resolution limits.
Global WM values differ significantly from those of individual WM structures. G' is significantly lower in overall WM than both the CC and the CR. The finding that the CC has a greater G' than WM agrees well with recent in vivo elastography studies on rodent brains which reported the CC to be a relatively stiff structure (Mace et al., 2011; Schregel et al., 2012). The CC is a tight bundle of highly aligned fibers, which should provide more structural rigidity than superficial white matter. The CR also exhibits these characteristics, though to a lesser extent since its fibers fan out and are not as highly aligned. The CC has significantly higher G' than the CR, which agrees with the organizational and compositional characteristics of each structure.
More interestingly, WM has greater G” than the CC, though less than the CR. These relationships hold true for ξ as well, which reflects the relative amount of motion attenuation in the structure. Microscale interactions in tissue cause attenuation, which increases with inter-connectedness in composite materials, such as connections of glial cells and axons in a matrix (Guo et al., 2012; Posnansky et al., 2012). Certain structures in the brain consist of fibers arranged in a grid pattern (Wedeen et al., 2012), including the CR crossed by the rostro-caudal fibers of the superior longitudinal fasciculus, which may result in more attenuation from the added connections. These crossings do not exist in the CC, which has significantly lower G” and ξ than the CR.
In general, very limited data exists from invasive or ex vivo mechanical testing of specific white matter structures. A previous study of ex vivo porcine brain in tension (Velardi et al., 2006) reported that the CC is stiffer than the CR, while other studies using large shear deformations (Prange and Margulies, 2002) and microindentation (Elkin et al., 2011) found the opposite trend. These studies cannot be directly compared to each other or to in vivo results from MRE on human subjects due to the differences in mechanical testing regimes and the change in tissue properties after brain death and excision.
Both the CC and CR are characterized by mechanically anisotropic microstructure (Prange and Margulies, 2002; Velardi et al., 2006). To invert displacement data in the present work, we use an isotropic material model that returns an effective shear modulus that is a composite of the direction-dependent shear moduli in anisotropic tissues (Qin et al., 2013). The propagation direction of excited shear waves influences this effective shear modulus (Mace et al., 2011; Perreard et al., 2010), and differences in propagation direction relative to fiber orientation could contribute to the mechanical relationship between the CC and CR reported here. However, actuation in brain MRE results in multi-aspect excitation (Clayton et al., 2012; Hamhaber et al., 2007; Romano et al., 2012) and it is unlikely that differences in wave propagation in the structures play a significant role in our conclusions. This is supported by the high repeatability of the extracted mechanical properties and that the CC is consistently stiffer and less viscous than the CR in all subjects, although each experiment exhibits unique displacement fields. Although the development of anisotropic inversion techniques (Qin et al., 2013; Romano et al., 2012) may remove any effect from wave propagation direction, it is outside the scope of the present study.
3.3. Heterogeneity in Structure Properties
The CC and CR are large structures consisting of multiple fiber pathways with distinct anatomy and function. We observed mechanical heterogeneity within each structure, and Figures 4A–B highlight this heterogeneity by presenting sagittal slices of G' distributions in the CC and CR averaged across all subjects after co-registration to the ICBM-152 template. An apparent gradient in G' from posterior-to-anterior exists for both structures; however, the CR exhibits higher stiffness in its anterior segment, while the anterior segment of the CC, the genu, is softer than the body. The ICBM-DTI-81 atlas defines three separate segments for both the CC (splenium, body, and genu) and CR (posterior, superior, and anterior), and we quantified the properties of each individual segment. Figures 4C–E plot the properties of each segment of the CC and CR against their posterior-to-anterior position.
Figure 4.

Demonstration of mechanical property heterogeneity in white matter structures: average G' for (A) CC and (B) CR across all subjects overlaid on corresponding paramedial slices of the ICBM-152 template. Distinct segments as defined by the ICBM-DTI-81 atlas are marked and labeled (from posterior-to-anterior): splenium, body, and genu of the CC; and posterior, superior, and anterior segments of the CR. Only a single slice of each 3D structure is presented here for illustration purposes. Mechanical properties of each segment are quantified and plotted: (C) G', (D) G”, and (E) ξ. CC properties are in red while CR properties are in blue. Values are staggered on the x-axis to avoid overlap. Statistically significant differences between segments of a structure are marked with * in the appropriate color above the line (p < 0.05). The genu differs from the body of the CC in all properties, while the posterior segment differs from the superior in the CR for all properties.
Table 3 presents the MRE (G', G”, and ξ) and DTI (FA and RD) values for each segment of the CC and CR. Two-way ANOVA of properties against both segments and subjects indicated heterogeneity within both the CC and CR for all properties (p < 0.05). We investigated this heterogeneity by post hoc testing the properties of the anterior and posterior segments of each structure against its central segment using Wilcoxon signed-rank tests with significance set at p < 0.05.
Table 3.
Average values and standard deviations for MRE and DTI measures in segments of the CC and CR across all subjects.
| Genu (CC) | Body (CC) | Splenium (CC) | |
|---|---|---|---|
| G' [kPa] | 2.67 ± 0.69 (*) | 3.09 ± 0.39 | 3.11 ± 0.35 |
| G” [kPa] | 1.55 ± 0.36 (*) | 1.23 ± 0.26 | 1.03 ± 0.19 |
| ξ | 0.34 ± 0.13 (*) | 0.22 ± 0.07 | 0.18 ± 0.04 |
| FA | 0.68 ± 0.04 (*) | 0.62 ± 0.04 | 0.60 ± 0.06 |
| RD [mm2/s 10−3] | 0.38 ± 0.03 (*) | 0.44 ± 0.03 | 0.47 ± 0.05 |
| Anterior (CR) | Superior (CR) | Posterior (CR) | |
|---|---|---|---|
| G' [kPa] | 2.96 ± 0.60 | 2.78 ± 0.37 | 2.39 ± 0.19 (*) |
| G” [kPa] | 1.92 ± 0.34 | 1.97 ± 0.12 | 1.39 ± 0.08 (*) |
| ξ | 0.38 ± 0.13 | 0.37 ± 0.05 | 0.30 ± 0.04 (*) |
| FA | 0.51 ± 0.03 | 0.50 ± 0.01 | 0.48 ± 0.01 (*) |
| RD [mm2/s 10−3] | 0.48 ± 0.02 | 0.48 ± 0.01 | 0.55 ± 0.02 (*) |
denotes significant difference with central segment (body of CC; superior of CR).
The genu has significantly lower G' than the body of the CC, and significantly higher G” and ξ. The splenium of the CC does not differ significantly from the body in any mechanical property. The same segments exhibit significantly different DTI properties. The body shows lower FA and higher RD than the genu, though no differences with the splenium.
The posterior segment of the CR has significantly lower G', G”, and ξ than the superior segment. We found no significant mechanical differences between the anterior and superior segments of the CR. Performing similar comparisons with the DTI measures again yielded relationships similar to those from MRE. FA is higher in the superior segment compared to the posterior, while RD is lower. Again, the anterior and superior segments are not significantly different in either FA or RD.
3.4. Correlation of Mechanical and Diffusivity Measures
Pairwise comparisons indicated that mechanical measures from MRE and diffusivity measures from DTI similarly identify differences in segments within both the CC and CR. This generated the hypotheses that DTI measures (FA and RD) may describe the difference in MRE measures (G' and G”) between segments. We tested these hypotheses using analyses of covariance (ANCOVA) between all combinations of individual MRE and DTI measures, grouped by subject. We treated segments within each structure as repeated measures and tested the CC and CR separately. Significance of correlations was determined at p < 0.05.
Figure 5A plots G' and G” of each segment of the CC against FA, while Figure 5B plots the properties against RD. Different color markers differentiate subjects and plotted trendlines are determined from ANCOVA analysis. In the CC, RD values of the individual segments significantly correlate with both G' and G”. Higher RD indicates higher G' and lower G”. MRE properties also exhibit correlations with FA, though these meet only trend level significance (p < 0.1).
Figure 5.

DTI measures of individual segments of white matter structures correlate with mechanical measures from MRE. G' and G” for each segment of the CC (genu, body, and splenium) plotted against (A) FA and (B) RD; and for each segment of the CR (anterior, superior, posterior) against (C) FA and (D) RD. Different colors represent measures from different subjects. Trendlines were generated through ANCOVA, which treated segments as repeated measures, and * in the legend indicates significant correlation (p < 0.05). In the CC, G' and G” both correlate with RD, though with opposite dependencies. For the CR, G” is positively correlated with FA and negatively with RD.
It is not surprising that MRE and DTI measures correlate well as they are both sensitive to underlying tissue microstructure and may be reflecting similar microstructural characteristics in this case. We hypothesize that in the CC both MRE and DTI measures are highly influenced by axon diameter distribution. Larger axons will provide structural rigidity to the tissue (Arbogast and Margulies, 1999) and generate higher G' values. Regions of smaller axons exhibit greater G” values likely due to a greater number of lateral connections and tethering resulting from a tighter glial matrix as these areas have a higher axon number density. A recent study shows that axon diameter within the CC affects DTI measures; it is negatively correlated with FA and positively associated with RD (Barazany et al., 2009). The results presented in Figure 5A support this argument as larger axons would lead to higher RD and G', though a lower G”.
We can compare our findings from MRE and DTI with histology studies of axon diameter distributions in different segments of the CC (Aboitiz and Montiel, 2003; Aboitiz et al., 1992; LaMantia and Rakic, 1990). The CC body comprises highly myelinated axons of large diameter connecting motor, somatosensory, and auditory regions for fast signal transmission. Fibers of the genu, which connect the frontal regions of the brain, typically have smaller diameters and less myelination (Aboitiz and Montiel, 2003). The splenium consists of both large axons of the visual pathway and smaller temporoparietal axons. This supports our hypothesis about MRE and DTI measures reflecting axon diameter in the CC. We found the genu to differ significantly from the body in measures that would suggest a smaller average axon diameter and a larger number of axons. The heterogeneous distribution of splenium axons confounds this effect and is likely responsible for the lack of significant difference with the body.
We also analyzed the dependence of G' and G” in the CR on FA (Figure 5C) and RD (Figure 5D). G” of the CR segments correlates positively with FA and negatively with RD, though we found no significant correlation between G' and either DTI measure. It is difficult to interpret the correlation of FA and RD with G” in terms of underlying CR microstructure. The CR comprises fiber tracts that fan towards the cortex and are subject to significant crossings from other fiber structures (Wedeen et al., 2012). DTI assumes a single fiber orientation and does not characterize fanning and crossing features well (Wedeen et al., 2005), thus measures like FA and RD cannot be tied directly to specific characteristics as in the CC. We hypothesized in a previous section that the crossing fiber populations of the CR result in high viscosity, and it is possible that the FA and RD are reflecting these crossings thus leading to the correlation with G”.
4. Conclusions
Improvements in brain MRE acquisition and inversion techniques have enabled the investigation of brain tissue mechanics on a scale previously unavailable in vivo. In this work, we measured the mechanical properties of the corpus callosum and corona radiata in healthy volunteers using MRE with 2 mm isotropic spatial resolution and atlas-based segmentation, and demonstrated the measurement reliability through repeated experiments. Overall, we show that global white matter was softer on average than either the corpus callosum or the corona radiata, whereas, the corpus callosum exhibited a higher stiffness and lower viscous damping compared to the corona radiata. This report of the localized, spatially resolved mechanical properties is the first to characterize the corpus callosum and corona radiata in the human brain in vivo. Quantification of the stiffness of specific structures in the white matter architecture may aid researchers in studying the localized effects of neurological conditions, and has the potential to enhance the sensitivity and specificity of mechanical measures to disease. Comparison of MRE and DTI measures of segments of the corpus callosum yielded correlations between radial diffusivity and both storage and loss modulus, likely stemming from axon diameter distribution. We found similar correlations between loss modulus and DTI measures in the corona radiata that may reflect fiber orientation and crossing. However, the lack of clear microstructural basis for a systematic interpretation of both MRE and DTI measures in the corona radiata points to the need for further investigation in that direction.
Highlights
-
■
MR elastography generates spatially resolved mechanical property maps of the brain
-
■
Mechanical properties of human corpus callosum and corona radiata are quantified
-
■
Structures are mechanically distinct and stiffer than white matter in general
-
■
Strong correlations exist between MRE and DTI properties within each structure
Acknowledgements
The Biomedical Imaging Center of the Beckman Institute for Advanced Science and Technology and the Richard W. Kritzer Fund at the University of Illinois at Urbana-Champaign provided support for this work. CLJ acknowledges support from the Beckman Graduate Fellows Program of the Beckman Institute. NIH/NIBIB grant R01-EB004632-04 supported development of the inversion algorithm.
Abbreviations
- MRE
magnetic resonance elastography
- DTI
diffusion tensor imaging
- SNR
signal-to-noise ratio
- OSS-SNR
octahedral shear strain-based signal-to-noise ratio
- NLI
nonlinear inversion
- FA
fractional anisotropy
- RD
radial diffusivity
- WM
white matter
- GM
gray matter
- CC
corpus callosum
- CR
corona radiata
- G'
storage modulus, or real shear modulus
- G”
loss modulus, or imaginary shear modulus
- ξ
damping ratio
Footnotes
Publisher's Disclaimer: This is a PDF file of an unedited manuscript that has been accepted for publication. As a service to our customers we are providing this early version of the manuscript. The manuscript will undergo copyediting, typesetting, and review of the resulting proof before it is published in its final citable form. Please note that during the production process errors may be discovered which could affect the content, and all legal disclaimers that apply to the journal pertain.
6. References
- Aboitiz F, Montiel J. One hundred million years of interhemispheric communication: the history of the corpus callosum. Braz J Med Biol Res. 2003;36:409–420. doi: 10.1590/s0100-879x2003000400002. [DOI] [PubMed] [Google Scholar]
- Aboitiz F, Scheibel AB, Fisher RS, Zaidel E. Fiber composition of the human corpus callosum. Brain Res. 1992;598:143–153. doi: 10.1016/0006-8993(92)90178-c. [DOI] [PubMed] [Google Scholar]
- Andersson J, Smith S, Jenkinson M. FNIRT - FMRIB's non-linear image registration tool. Fourteenth Annual Meeting of the Organization for Human Brain Mapping; Melbourne, Australia. 2008. p. 496. [Google Scholar]
- Arbogast KB, Margulies SS. A fiber-reinforced composite model of the viscoelastic behavior of the brainstem in shear. J Biomech. 1999;32:865–870. doi: 10.1016/s0021-9290(99)00042-1. [DOI] [PubMed] [Google Scholar]
- Barazany D, Basser PJ, Assaf Y. In vivo measurement of axon diameter distribution in the corpus callosum of rat brain. Brain. 2009;132:1210–1220. doi: 10.1093/brain/awp042. [DOI] [PMC free article] [PubMed] [Google Scholar]
- Clayton EH, Genin GM, Bayly PV. Transmission, attenuation and reflection of shear waves in the human brain. J R Soc Interface. 2012;9:2899–2910. doi: 10.1098/rsif.2012.0325. [DOI] [PMC free article] [PubMed] [Google Scholar]
- Elkin BS, Ilankovan AI, Morrison B. Dynamic, Regional Mechanical Properties of the Porcine Brain: Indentation in the Coronal Plane. J Biomech Eng-T ASME. 2011;133:071009. doi: 10.1115/1.4004494. [DOI] [PubMed] [Google Scholar]
- Freimann FB, Streitberger K-J, Klatt D, Lin K, McLaughlin JR, Braun J, Sprung C, Sack I. Alteration of brain viscoelasticity after shunt treatment in normal pressure hydrocephalus. Neuroradiology. 2012;54:189–196. doi: 10.1007/s00234-011-0871-1. [DOI] [PubMed] [Google Scholar]
- Green MA, Bilston LE, Sinkus R. In Vivo Brain Viscoelastic Properties Measured by Magnetic Resonance Elastography. NMR Biomed. 2008;21:755–764. doi: 10.1002/nbm.1254. [DOI] [PubMed] [Google Scholar]
- Guo J, Posnansky O, Hirsch S, Scheel M, Taupitz M, Braun J, Sack I. Fractal network dimension and viscoelastic powerlaw behavior: II. An experimental study of structure-mimicking phantoms by magnetic resonance elastography. Phys Med Biol. 2012;57:4041–4053. doi: 10.1088/0031-9155/57/12/4041. [DOI] [PubMed] [Google Scholar]
- Hamhaber U, Sack I, Papazoglou S, Rump J, Klatt D, Braun J. Three-dimensional analysis of shear wave propagation observed by in vivo magnetic resonance elastography of the brain. Acta Biomater. 2007;3:127–137. doi: 10.1016/j.actbio.2006.08.007. [DOI] [PubMed] [Google Scholar]
- Jenkinson M, Bannister PR, Brady M, Smith S. Improved Optimization for the Robust and Accurate Linear Registration and Motion Correction of Brain Images. NeuroImage. 2002;17:825–841. doi: 10.1016/s1053-8119(02)91132-8. [DOI] [PubMed] [Google Scholar]
- Jenkinson M, Beckmann CF, Behrens TEJ, Woolrich MW, Smith SM. FSL. NeuroImage. 2012;62:782–790. doi: 10.1016/j.neuroimage.2011.09.015. [DOI] [PubMed] [Google Scholar]
- Johnson CL, McGarry MDJ, Van Houten EEW, Weaver JB, Paulsen KD, Sutton BP, Georgiadis JG. Magnetic resonance elastography of the brain using multishot spiral readouts with self-navigated motion correction. Magn Reson Med. 2012 doi: 10.1002/mrm.24473. [DOI] [PMC free article] [PubMed] [Google Scholar]
- LaMantia A-S, Rakic P. Cytological and Quantitative Characteristics of Four Cerebral Commissures in the Rhesus Monkey. J Comp Neurol. 1990;291:520–537. doi: 10.1002/cne.902910404. [DOI] [PubMed] [Google Scholar]
- Mace E, Cohen I, Montaldo G, Miles R, Fink M, Tanter M. In Vivo Mapping of Brain Elasticity in Small Animals Using Shear Wave Imaging. IEEE T Med Imaging. 2011;30:550–558. doi: 10.1109/TMI.2010.2079940. [DOI] [PubMed] [Google Scholar]
- Mazziotta J, Toga AW, Evans A, Fox P, Lancaster J, Zilles K, Woods R, Paus T, Simpson G, Pike B, Holmes C, Collins L, Thompson PM, MacDonald D, Iacoboni M, Schormann T, Amunts K, Palomero-Gallagher N, Geyer S, Parsons L, Narr K, Kabani N, Le Goualher G, Boomsma D, Cannon T, Kawashima R, Mazoyer B. A probabilistic atlas and reference system for the human brain: International Consortium for Brain Mapping (ICBM) Philos T R Soc B. 2001;356:1293–1322. doi: 10.1098/rstb.2001.0915. [DOI] [PMC free article] [PubMed] [Google Scholar]
- McGarry MDJ, Van Houten EEW, Johnson CL, Georgiadis JG, Sutton BP, Weaver JB, Paulsen KD. Multiresolution MR elastography using nonlinear inversion. Med Phys. 2012;39:6388–6396. doi: 10.1118/1.4754649. [DOI] [PMC free article] [PubMed] [Google Scholar]
- McGarry MDJ, Van Houten EEW, Perriñez PR, Pattison AJ, Weaver JB, Paulsen KD. An Octahedral Shear Strain-Based Measure of SNR for 3D MR Elastography. Phys Med Biol. 2011;56:N153–N164. doi: 10.1088/0031-9155/56/13/N02. [DOI] [PMC free article] [PubMed] [Google Scholar]
- Miller D, Weinshenker BG, Filippi M, Banwell BL, Cohen JA, Freedman MS, Galetta SL, Hutchinson M, Johnson RT, Kappos L, Kira J, Lublin FD, McFarland HF, Montalban X, Panitch H, Richert JR, Reingold SC, Polman CH. Differential diagnosis of suspected multiple sclerosis: a consensus approach. Mult Scler. 2008;14:1157–1174. doi: 10.1177/1352458508096878. [DOI] [PMC free article] [PubMed] [Google Scholar]
- Mori S, Oishi K, Jiang H, Jiang L, Li X, Akhter K, Hua K, Faria AV, Mahmood A, Woods R, Toga AW, Pike GB, Neto PR, Evans A, Zhang J, Huang H, Miller MI, van Zijl PCM, Mazziotta J. Stereotaxic white matter atlas based on diffusion tensor imaging in an ICBM template. NeuroImage. 2008;40:570–582. doi: 10.1016/j.neuroimage.2007.12.035. [DOI] [PMC free article] [PubMed] [Google Scholar]
- Mueller SG, Schuff N, Weiner MW. Evaluation of treatment effects in Alzheimer's and other neurodegenerative diseases by MRI and MRS. NMR Biomed. 2006;19:655–668. doi: 10.1002/nbm.1062. [DOI] [PMC free article] [PubMed] [Google Scholar]
- Mueller SG, Weiner MW, Thal LJ, Petersen RC, Jack CR, Jagust W, Trojanowski JQ, Toga AW, Beckett L. Ways toward an early diagnosis in Alzheimer's disease: The Alzheimer's Disease Neuroimaging Initiative (ADNI) Alzheimers Dement. 2005;1:55–66. doi: 10.1016/j.jalz.2005.06.003. [DOI] [PMC free article] [PubMed] [Google Scholar]
- Murphy MC, Huston J, III, Jack CR, Jr, Glaser KJ, Manduca A, Felmlee JP, Ehman RL. Decreased Brain Stiffness in Alzheimer's Disease Determined by Magnetic Resonance Elastography. J Magn Reson Imaging. 2011;34:494–498. doi: 10.1002/jmri.22707. [DOI] [PMC free article] [PubMed] [Google Scholar]
- Muthupillai R, Lomas DJ, Rossman PJ, Greenleaf JF, Manduca A, Ehman RL. Magnetic Resonance Elastography by Direct Visualization of Propagating Acoustic Strain Waves. Science. 1995;269:1854–1857. doi: 10.1126/science.7569924. [DOI] [PubMed] [Google Scholar]
- Oishi K, Akhter K, Mielke M, Ceritoglu C, Zhang J, Jiang H, Li X, Younes L, Miller MI, van Zijl PCM, Albert M, Lyketsos CG, Mori S. Multi-modal MRI analysis with disease-specific spatial filtering: initial testing to predict mild cognitive impairment patients who convert to Alzheimer's disease. Front Neur. 2011;2:54. doi: 10.3389/fneur.2011.00054. [DOI] [PMC free article] [PubMed] [Google Scholar]
- Papazoglou S, Hirsch S, Braun J, Sack I. Multifrequency inversion in magnetic resonance elastography. Phys Med Biol. 2012;57:2329–2346. doi: 10.1088/0031-9155/57/8/2329. [DOI] [PubMed] [Google Scholar]
- Perreard IM, Pattison AJ, Doyley MM, McGarry MDJ, Barani Z, Van Houten EEW, Weaver JB, Paulsen KD. Effects of frequency-and direction-dependent elastic materials on linearly elastic MRE image reconstructions. Phys Med Biol. 2010;55:6801–6815. doi: 10.1088/0031-9155/55/22/013. [DOI] [PMC free article] [PubMed] [Google Scholar]
- Posnansky O, Guo J, Hirsch S, Papazoglou S, Braun J, Sack I. Fractal network dimension and viscoelastic powerlaw behavior: I. A modeling approach based on a coarse-graining procedure combined with shear oscillatory rheometry. Phys Med Biol. 2012;57:4023–4040. doi: 10.1088/0031-9155/57/12/4023. [DOI] [PubMed] [Google Scholar]
- Prange M, Margulies SS. Regional, directional, and age-dependent properties of the brain undergoing large deformation. J Biomech Eng-T ASME. 2002;124:244–252. doi: 10.1115/1.1449907. [DOI] [PubMed] [Google Scholar]
- Qin EC, Sinkus R, Geng G, Cheng S, Green MA, Rae CD, Bilston LE. Combining MR elastography and diffusion tensor imaging for the assessment of anisotropic mechanical properties: A phantom study. J Magn Reson Imaging. 2013;37:217–226. doi: 10.1002/jmri.23797. [DOI] [PubMed] [Google Scholar]
- Riek K, Millward JM, Hamann I, Mueller S, Pfueller CF, Paul F, Braun J, Infante-Duarte C, Sack I. Magnetic resonance elastography reveals altered brain viscoelasticity in experimental autoimmune encephalomyelitis. NeuroImage Clin. 2012;1:81–90. doi: 10.1016/j.nicl.2012.09.003. [DOI] [PMC free article] [PubMed] [Google Scholar]
- Romano A, Scheel M, Hirsch S, Braun J, Sack I. In vivo waveguide elastography of white matter tracts in the human brain. Magn Reson Med. 2012;68:1410–1422. doi: 10.1002/mrm.24141. [DOI] [PubMed] [Google Scholar]
- Sack I, Beierbach B, Wuerfel J, Klatt D, Hamhaber U, Papazoglou S, Martus P, Braun J. The impact of aging and gender on brain viscoelasticity. NeuroImage. 2009;46:652–657. doi: 10.1016/j.neuroimage.2009.02.040. [DOI] [PubMed] [Google Scholar]
- Sack I, Streitberger K-J, Krefting D, Paul F, Braun J. The Influence of Physiological Aging and Atrophy on Brain Viscoelastic Properties in Humans. PLoS One. 2011;6:e23451. doi: 10.1371/journal.pone.0023451. [DOI] [PMC free article] [PubMed] [Google Scholar]
- Sahraian MA, Eshaghi A. Role of MRI in diagnosis and treatment of multiple sclerosis. Clin Neurol Neurosur. 2010;112:609–615. doi: 10.1016/j.clineuro.2010.03.022. [DOI] [PubMed] [Google Scholar]
- Schregel K, Wuerfel E, Garteiser P, Gemeinhardt I, Prozorovski T, Aktas O, Merz H, Petersen D, Wuerfel J, Sinkus R. Demyelination reduces brain parenchymal stiffness quantified in vivo by magnetic resonance elastography. P Natl Acad Sci USA. 2012;109:6650–6655. doi: 10.1073/pnas.1200151109. [DOI] [PMC free article] [PubMed] [Google Scholar]
- Smith SM. Fast robust automated brain extraction. Hum Brain Mapp. 2002;17:143–155. doi: 10.1002/hbm.10062. [DOI] [PMC free article] [PubMed] [Google Scholar]
- Song S-K, Yoshino J, Le TQ, Lin S-J, Sun S-W, Cross AH, Armstrong RC. Demyelination increases radial diffusivity in corpus callosum of mouse brain. NeuroImage. 2005;26:132–140. doi: 10.1016/j.neuroimage.2005.01.028. [DOI] [PubMed] [Google Scholar]
- Streitberger K-J, Sack I, Krefting D, Pfüller C, Braun J, Paul F, Wuerfel J. Brain Viscoelasticity Alteration in Chronic-Progressive Multiple Sclerosis. PLoS One. 2012;7:e29888. doi: 10.1371/journal.pone.0029888. [DOI] [PMC free article] [PubMed] [Google Scholar]
- Streitberger K-J, Wiener E, Hoffmann J, Freimann FB, Klatt D, Braun J, Lin K, McLaughlin JR, Sprung C, Klingebiel R, Sack I. In Vivo Viscoelastic Properties of the Brain in Normal Pressure Hydrocephalus. NMR Biomed. 2011;24:385–392. doi: 10.1002/nbm.1602. [DOI] [PubMed] [Google Scholar]
- Sun S-W, Liang H-F, Trinkaus K, Cross AH, Armstrong RC, Song S-K. Noninvasive detection of cuprizone induced axonal damage and demyelination in the mouse corpus callosum. Magn Reson Med. 2006;55:302–308. doi: 10.1002/mrm.20774. [DOI] [PubMed] [Google Scholar]
- van Dommelen JAW, van der Sande TPJ, Hrapko M, Peters GWM. Mechanical properties of brain tissue by indentation: Interregional variation. J Mech Behav Biomed. 2010;3:158–166. doi: 10.1016/j.jmbbm.2009.09.001. [DOI] [PubMed] [Google Scholar]
- Van Houten EEW, Miga MI, Weaver JB, Kennedy FE, Paulsen KD. Three-dimensional subzone-based reconstruction algorithm for MR elastography. Magn Reson Med. 2001;45:827–837. doi: 10.1002/mrm.1111. [DOI] [PubMed] [Google Scholar]
- Velardi F, Fraternali F, Angelillo M. Anisotropic constitutive equations and experimental tensile behavior of brain tissue. Biomech Model Mechan. 2006;5:53–61. doi: 10.1007/s10237-005-0007-9. [DOI] [PubMed] [Google Scholar]
- Wang R, Benner T, Sorensen AG, Wedeen VJ. Diffusion Toolkit: A Software Package for Diffusion Imaging Data Processing and Tractography. Proceedings of the 15th Annual Meeting of ISMRM; Berlin, Germany. 2007. p. 3720. [Google Scholar]
- Wang Y, Wang Q, Haldar JP, Yeh FC, Xie M, Sun P, Tu TW, Trinkaus K, Klein RS, Cross AH, Song S-K. Quantification of increased cellularity during inflammatory demyelination. Brain. 2011;134:3590–3601. doi: 10.1093/brain/awr307. [DOI] [PMC free article] [PubMed] [Google Scholar]
- Weaver JB, Pattison AJ, McGarry MDJ, Perreard IM, Swienckowski JG, Eskey CJ, Lollis SS, Paulsen KD. Brain mechanical property measurement using MRE with intrinsic activation. Phys Med Biol. 2012;57:7275–7287. doi: 10.1088/0031-9155/57/22/7275. [DOI] [PMC free article] [PubMed] [Google Scholar]
- Wedeen VJ, Hagmann P, Tseng W-YI, Reese TG, Weisskoff RM. Mapping complex tissue architecture with diffusion spectrum magnetic resonance imaging. Magn Reson Med. 2005;54:1377–1386. doi: 10.1002/mrm.20642. [DOI] [PubMed] [Google Scholar]
- Wedeen VJ, Rosene DL, Wang R, Dai G, Mortazavi F, Hagmann P, Kaas JH, Tseng W-YI. The geometric structure of the brain fiber pathways. Science. 2012;335:1628–1634. doi: 10.1126/science.1215280. [DOI] [PMC free article] [PubMed] [Google Scholar]
- Wuerfel J, Paul F, Beierbach B, Hamhaber U, Klatt D, Papazoglou S, Zipp F, Martus P, Braun J, Sack I. MR-elastography reveals degradation of tissue integrity in multiple sclerosis. NeuroImage. 2010;49:2520–2525. doi: 10.1016/j.neuroimage.2009.06.018. [DOI] [PubMed] [Google Scholar]
- Zhang J, Green MA, Sinkus R, Bilston LE. Viscoelastic properties of human cerebellum using magnetic resonance elastography. J Biomech. 2011;44:1909–1913. doi: 10.1016/j.jbiomech.2011.04.034. [DOI] [PubMed] [Google Scholar]
- Zhang Y, Brady M, Smith S. Segmentation of brain MR images through a hidden Markov random field model and the expectation-maximization algorithm. IEEE T Med Imaging. 2001;20:45–57. doi: 10.1109/42.906424. [DOI] [PubMed] [Google Scholar]