

Abstract
Many historical and contemporary theorists have proposed that population-level behavioral and brain asymmetries are unique to humans and evolved as a consequence of human-specific adaptations such as language, tool manufacture and use, and bipedalism. Recent studies in nonhuman animals, notably primates, have begun to challenge this view. Here, I summarize comparative data on neuroanatomical asymmetries in the planum temporale (PT) and inferior frontal gyrus (IFG) of humans and chimpanzees, regions considered the morphological equivalents to Broca’s and Wernicke’s areas. I also review evidence of population-level handedness in captive and wild chimpanzees. When similar methods and landmarks are used to define the PT and IFG, humans and chimpanzees show similar patterns of asymmetry in both cortical regions, though humans show more pronounced directional biases. Similarly, there is good evidence that chimpanzees show population-level handedness, though, again, the expression of handedness is less robust compared to humans. These results stand in contrast to reported claims of significant differences in the distribution of handedness in humans and chimpanzees, and I discuss some possible explanations for the discrepancies in the neuroanatomical and behavioral data.
Keywords: brain asymmetry, language, handedness
A fundamental aspect of the human central nervous system is hemispheric specialization. Hemispheric specialization refers to sensory, motor, or cognitive functions that are differentially processed by the left and right cerebral hemispheres. The two most commonly studied and documented specializations in the human brain are language and handedness. It has been well documented that, though there is some cultural variation, a significant majority of humans self-report preferring to use the right hand for a variety of actions.1-3 In addition, clinical, experimental, and functional imaging studies have shown that some, though not all, aspects of language and speech are lateralized to the left hemisphere, 4-8 particularly among right-handedness individuals.9 Specifically, the left inferior frontal gyrus (IFG), as well as the left posterior temporal lobe of the human brain, which include Broca’s and Wernicke’s areas, play important roles in the production and comprehension of gestural and spoken language.5 There is also evidence of neuroanatomical asymmetries in humans for both the inferior frontal gyrus and the posterior temporal lobe, which many believe may underlie the functional specializations found for Broca’s and Wernicke’s areas.10-13 Specifically, in humans, the IFG is morphologically composed of three regions: the pars opercularis, pars triangularis and pars orbitalis, and there is some evidence indicating that this region of the brain is larger in the left than the right hemisphere, particularly among right-handed individuals, though this depends on whether the volume of the entire gyrus is quantified or only the portion composed of gray matter 14-16 (see below). Less controversial is the evidence of leftward neuroanatomical asymmetries in the posterior temporal lobe, specifically the planum temporale (PT). The PT is the flat bank of tissue that lies posterior to Heschl’s gyrus (HG), and numerous studies have shown that there is a leftward asymmetry in approximately 70–75% of human brains, though a smaller proportion of left-lateralized individuals have been reported among left-handed subjects 17-20.
The functional and anatomical association between left-lateralization of the IFG and PT, handedness, and language have led some to suggest that population-level asymmetries in these brain regions are uniquely human, and a consequence of evolutionary selection for increased motor control for language and speech that evolved after the split between humans and chimpanzees approximately 5–6 million years ago.21-25 Population-level asymmetry refers to consistent directional asymmetries in a significant proportion of the subjects within a sample. It has been known for many years that most animals show individual limb preferences (paw or hand preference),21,26 but the evolutionary debate has centered around the emergence of population-level behavioral and brain asymmetries. With specific reference to population-level handedness, a number of different evolutionary models have been proposed, with each emphasizing the significance of human-specific adaptations that may have selected for increasing left hemisphere control of motor actions, including hand preferences. Some of these traits include bipedalism, tool manufacture and use, manual gestures, and speech.27-30 For example, Annett31 has proposed the right-shift theory of handedness, which hypothesizes that genes which code for the motor control of speech are expressed in the left hemisphere and that right-handedness develops as a consequence of increasing motor control for speech. When humans began to walk upright, the hands became free from their primary locomotor functions and could subsequently be used for complex manual actions that might have included tool manufacture and use, bimanual role differentiation of the hands associated with feeding, or manual gestural communication. Common to each of these scenarios is discontinuity in evolution of the expression of behavioral and brain asymmetries; that is to say, there are little by way of antecedent conditions in the phylogenetic record that resemble the human condition or expression of asymmetry in structure and function. Thus, some single or co-occurring set of events resulted in the sudden appearance of population-level functional and brain asymmetries after the split from the common ancestor.
The discontinuity view of the evolution of behavioral and brain asymmetry has recently come under scrutiny. Several bodies of research have contributed to this evolving view of the origins of hemispheric specialization. First, there is now very good evidence of population-level cognitive, sensory, and motor asymmetries in a number of nonhuman animals from a variety of taxa.32-34 For example, several species of birds show asymmetries in visual discrimination for different classes of stimuli.35 Toads prefer to use their right paws to remove adhesive substrates placed centrally on their heads,36 and some species of fish show eye dominance when viewing different stimuli, such as predators.37,38 In primates, several studies have shown that Old World monkeys and apes show asymmetries in facial expressions associated with different classes of vocalizations.39-44 Moreover, it has been shown that split-brained monkeys show right hemisphere asymmetries in the discrimination of facial stimuli and left asymmetries in line orientation discrimination.45 The specializations found in split-brain monkeys were unrelated to the monkeys’ hand preferences, and this led Hamilton and Vermiere45 to conclude that cognitive asymmetries may have evolved independently of factors selecting for the evolution of handedness.
Turning to studies on brain asymmetry in primates, previously published and more recent research has clearly shown evidence of population-level asymmetries, particularly in great apes.46 For example, Yeni-Komshian and Benson47 reported left asymmetries in sylvian fissure length in humans and chimpanzees but not rhesus monkeys.48-51 More recently, population-level petalia (shape of the skull) asymmetries measured from computerized tomography (CT) scans have been reported in great apes (gorilla, chimpanzee, bonobo, orangutan).52 Similarly, evidence of leftward asymmetries in the PT, as measured from post-mortem brains53 and MRI, as well as in the parietal operculum, 54,55 have been found in chimpanzees, and the distribution of left-lateralized individuals is similar to that reported in humans (see below). A recent comparative study of asymmetries in gray matter volume in the posterior temporal gyrus also revealed significant leftward asymmetries in chimpanzees but not in other, more distantly related Old World monkeys including macaques and vervet monkeys.51,56
The growing body of evidence for population-level behavioral and neuroanatomical asymmetries in nonhuman animals clearly challenges the long held view that they are unique to humans. Notwithstanding these positive findings, the question of whether nonhuman primates, and specifically chimpanzees, show population-level handedness remains a topic of intense debate. Indeed, on the topic of handedness, many continue to argue that there are qualitative differences in the expression of asymmetry between humans and all other animals and this debate has particularly centered on findings with chimpanzees. In the past 25 years, there have been numerous published studies on handedness in nonhuman primates and the collective results are difficult to interpret from a comparative perspective.57-62 A number of factors have contributed to the difficulties in interpretation of nonhuman primate handedness findings including (1) the types of tasks used to assess handedness, (2) the methods and statistical quantification of individual handedness, and (3) the settings in which the data have been collected (captive versus wild).63
In this paper, I argue that there is continuity in the behavioral and brain asymmetries in chimpanzees and humans and that differences between these two species are quantitative not qualitative. Initially, I summarize the data on neuroanatomical asymmetries in chimpanzees with specific reference to the IFG and PT as they relate to findings reported in the human literature. Though asymmetries may exists for many brain regions in human and nonhuman primates,64-66 I have focused on these two brain regions because of their importance in the human neuropsychological literature and their significance to theories linking handedness with the emergence of hemispheric specialization for language. The review centers on studies that have examined asymmetries in the PT and IFG at the macro- and microstructural levels of analysis, as well as those that have directly or indirectly quantified connectivity. I next selectively review data on handedness in captive and wild chimpanzees, with an eye toward evaluating whether comparing results between these two settings leads to different findings or interpretations regarding the existence of population-level hand preferences. I further point out some of the problems in comparing handedness between species, and argue that without resolving differences in the methods and approaches to the assessment of handedness in human and nonhuman primates, a true understanding of the biology and evolution of hemispheric specialization will remain elusive. I conclude by discussing several potential evolutionary factors that may account for the evolution of behavioral and brain asymmetries in primates.
Neuroanatomical asymmetries in the planum temporale and inferior frontal gyrus
Planum temporale and posterior superior temporal gyrus
The majority of the data presented in this summary comes from measurements of structural magnetic resonance images (MRI) that have been acquired in my laboratory over the past 10 years. All of the data have come from chimpanzees housed at two facilities: the Yerkes National Primate Research Center (YNPRC) and the University of Texas M. D. Anderson Cancer Center (UTMDACC). The methods and scanning parameters have been described in detail elsewhere.51,67
The anatomical landmarks used to delineate the PT and the posterior superior temporal gyrus (pSTG) in the chimpanzee brain are similar, if not identical, to those employed with human brains. The PT is defined as the surface area posterior to HG. HG is sometimes difficult to identify in chimpanzee brains, but in previous studies, we noticed that the HG is nearly always positioned at the posterior termination point of the inferior branch of the insular sulcus.29,45 Therefore, we have defined the anterior border of the PT as the slice in the coronal plane in which the inferior branch of the insular sulcus terminates. From that point, we trace the depth of the sylvian fissure (SF) from its most lateral point medially on the cortical surface to its most medial endpoint. The depth of the SF is traced posteriorly on all slices until it terminates. The individual depth measures are summed across all slices to estimate the surface area (mm2) of the PT region for each hemisphere.
The pSTG is defined using the same anterior and posterior terminal points as the PT; however, the entire gyrus is traced rather than only the surface area. For the pSTG, the superior border is the SF and the inferior border is the superior temporal sulcus (STS). The entire gyrus between the SF and STS is traced on all slices until the SF terminates and the object map or mask is then saved for each hemisphere (Fig. 1). To quantify the pSTG gray and white matter volumes, each subject’s native T1-weighted scan is segmented into gray and white matter using FSL.68 The previously traced object maps are then applied to the individually segmented gray and white matter volumes47 (Fig. 2). The left and right hemisphere volumes (mm3) are computed by summing all the voxels found within the object map.
Figure 1.
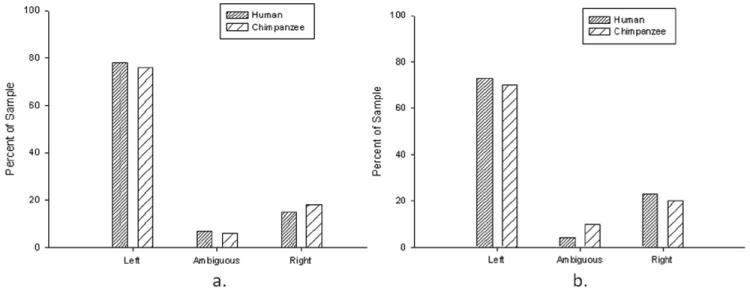
Distribution of asymmetries in humans and chimpanzees for (a) the planum temporale (PT) and (b) posterior superior temporal gyrus (pSTG).
Figure 2.
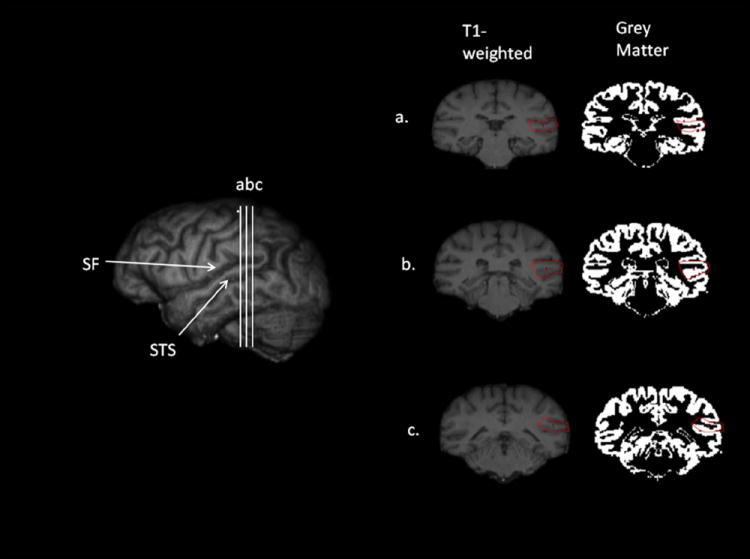
3D reconstruction of a chimpanzee brain with the sylvian fissure (SF) and superior temporal sulcus (STS) identified on the lateral surface. (a-c) are the points along the posterior superior temporal gyrus that have been rotated into the coronal plane to show the landmarks used to delineate the pSTG.
For both the PT and pSTG, an asymmetry quotient (AQ) was calculated following the formula AQ = (R − L) / ((R + L) × .5), where R and L represent the right and left hemisphere surface area or volume. For comparison to the human data, we also computed the percentage differences in the size of the left compared to right hemisphere following the formula % Leftward = ((L − R) / (L + R)) × 100]. In addition, subjects were classifies as left- or right lateralized or ambiguous, based on cut-points applied to the AQ scores. As has been done in studies on human brain asymmetries,69 subjects with AQ scores ≥ .025 or ≤ −.025 were classified as right-and left-lateralized, respectively. All other individuals were classified as ambiguously lateralized.
To date, my laboratory has quantified the PT and pSTG from in vivo MRI in nearly 190 chimpanzees, and the results are shown in Table 1. Significant leftward asymmetries are evident for the PT surface area t(189) −9.456, p < .001. In Table 1, the distribution of left- and right-lateralized and ambiguous subjects are also shown for the PT surface area and pSTG. Χ2 goodness-of-fit tests largely confirmed the leftward asymmetries found with the one-sample t-tests. There were significantly more left-lateralized than ambiguous (Χ2 (1, n = 155) = 104.06, p < .001) or right lateralized (Χ2 (1, n = 176) = 63.84, p < .001) chimpanzees for the PT surface area. Likewise, there were significantly more left-lateralized than ambiguous (Χ2 (1, n = 146) = 101.94, p < .001 and right-lateralized Χ2 (1, n = 177) = 46.79, p < .001) chimpanzees for the pSTG gray matter volume. For comparison to the findings from our laboratory, we have also provided the data on PT surface area asymmetries reported by Gannon et al.53 in post-mortem brains and Gilissen et al.54 in MRI scans. As can be seen, significant leftward asymmetries were also found in these two separate, independent studies.
Table 1.
Neuroanatomical asymmetries in posterior temporal lobe including the planum temporale
| Region and Author(s) | #L | #A | #R | AQ | s.e. | %Leftward |
|---|---|---|---|---|---|---|
| PT Surface Area | ||||||
| (C) This study | 141 | 14 | 35 | −.136 | .014 | 7.05 |
| (C) Gannon et al.53 | 17 | 0 | 1 | −475 | .088 | 24.81 |
| (C) Gilissen et al.54 | 7 | 1 | 2 | NA | NA | NA |
| (H) Shapleske et al.18 | 520 | 53 | 93 | NA | NA | 13.2 |
| pSTG | ||||||
| (C)This study | 120 | 19 | 39 | −.106 | .013 | 5.89 |
| (H) Knaus et al.70 | 34 | 2 | 12 | NA | NA | 10.60 |
| Cytoarchitectonic (BA22) | ||||||
| (C)Spocter et al.80 | 9 | 0 | 3 | −.256 | .135 | 12.08 |
| (H) Galaburda & Sanides79 | 3 | 0 | 0 | −.796 | .401 | 39.81 |
| White Matter Volume and Connectivity | ||||||
| (C,F) Cantalupo et al.85 | 30 | 1 | 3 | −.191 | .025 | 19.07 |
| (C,P) Cantalupo et al.85 | 30 | 2 | 2 | −.091 | .011 | 9.10 |
| (C,T) Cantalupo et al.85 | 34 | 0 | 0 | −.116 | .010 | 11.66 |
| (C,O) Cantalupo et al.85 | 25 | 7 | 2 | −.137 | .032 | 13.61 |
| (H, F) Pujol et al.123 | 90 | 10 | 0 | NA | NA | 11.79 |
| (H, P) Pujol et al.123 | 83 | 17 | 0 | NA | NA | 10.96 |
| (H, T) Pujol et al.123 | 91 | 8 | 1 | NA | NA | 12.78 |
| (C) Rilling et al.86 | NA | NA | NA | −.66 | .07 | NA |
| (H) Rilling et al.86 | NA | NA | NA | −.42 | .11 | NA |
#L = number left, #A = number ambiguous, #R = number right. AQ = asymmetry quotient, s.e. = standard error, %Leftward = percentage larger left hemisphere
Figure 1a shows the percentage of left- and right-lateralized and ambiguous chimpanzees in comparison to humans for the PT surface area. The human data are from a meta-analysis of studies on asymmetries in the PT in a sample of 666 human subjects conducted by Shapleske et al.13 A Χ2 test of independence failed to reveal a significant species difference in the distribution of PT asymmetries between humans and chimpanzees (Χ2 (2, n = 842) = 1.487, n.s.). However, we did find that the percentage difference between the left and right PT surface areas was significantly smaller in chimpanzees (Mean difference = 7.09) than the value reported in humans (Mean difference = 13.2; t(189) = −8.250, p < .001). Thus, though the proportion of left lateralized individuals does not differ between species, humans appear to show a larger leftward asymmetry in the PT surface area compared to chimpanzees.
For the pSTG gray matter, a significant population-level leftward asymmetry was found (t(188) = −7.747, p < .001), similar to the findings for the PT surface area. The number of left-lateralized individuals was significantly higher than the number of ambiguous (Χ2 (1, n = 146) = 101.95, p < .001) and right lateralized (Χ2 (1, n = 177) = 46.78, p < .001) apes. For comparison to the chimpanzee data, we used the findings from Knaus et al.,70 who characterized individual asymmetries in the pSTG in a sample of 60 subjects using the cut-points adopted in this paper. The distribution of left-lateralized, ambiguous, and right-lateralized humans and chimpanzees is shown in Figure 1b. A Χ2 test of independence failed to reveal a significant species difference between chimpanzees and humans in the distribution of asymmetries in the pSTG (Χ2 (2, n = 226) = 1.948, n.s.). Notwithstanding, as with the PT surface area, we did find that the percentage of difference between the left and right hemispheres for the pSTG gray matter was significantly larger in humans (Mean difference = 9.21) compared to the chimpanzees (Mean difference = 5.37; see Figure 3B; t(188) = −5.77, p < .001).
Figure 3.
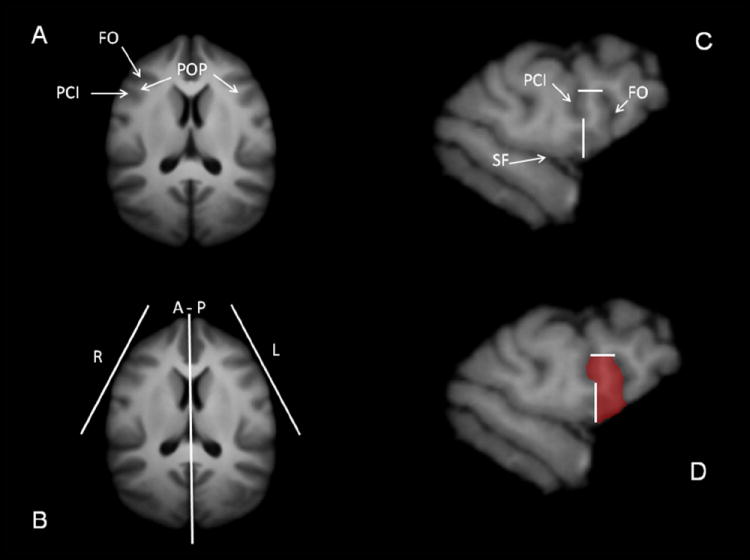
(A) Location of the FO and PCI sulci in relation to the curvature of the frontal cortex as seen in an axial view of the chimpanzee brain template. (B) Orientation of the para-sagittal planes of cutting for the right (R) and left (L) POP. (C) Example of a para-sagittal slice showing the borders defining the POP region. (D) Manual tracing of the POP on the same para-sagittal slice. FO = Fronto-Orbital Sulcus; PCI = Pre-Central Inferior Sulcus; POP = Pars Opercularis; A–P = Anterior-Posterior Axis; SF = Sylvian Fissure
Pars opercularis
Before summarizing the results of asymmetries in the pars opercularis (POP), it is important to note that the anatomical landmarks used to define Broca’s area are different between humans and chimpanzees.71 However, the pars opercularis can be defined using the same or similar landmarks. The anterior border of the POP in chimpanzees is the fronto-orbital sulcus (FO), the posterior border is the precentral inferior sulcus (PCI), and the superior border is the inferior frontal sulcus (IFS) (Fig. 3). In humans, the anterior of the POP is the ascending ramus (AR), the posterior border is the PCI, and the superior border is the IFS. In the human brain, Broca’s area is also composed of the pars triangularis and pars orbitalis, but these regions cannot be reliably defined using sulci or anatomical landmarks in the chimpanzee brain.50 Thus, the only reliable anatomical comparisons that can be made between humans and chimpanzees within the inferior frontal gyrus must focus on the pars opercularis.
In one of the original studies on the POP, Cantalupo and Hopkins72 measured the entire volume of the POP in a sample of 26 great apes and found a significant leftward asymmetry (Table 2). In a follow-up study, Hopkins et al.73 measured the volume of the POP in a sample of 31 chimpanzees and did not find population-level asymmetry, though the trend was toward a left-hemisphere bias. One difference between these studies was the extent to which the ventral portion of the POP was included in the measurement. Cantalupo and Hopkins51 included the ventral region by quantifying the POP in the para-sagittal plane, whereas Hopkins et al.52 did not include the ventral portion and limited the measurement to the portion of the POP visible between the PCI and FO sulci when viewed in the horizontal plane. To resolve these discrepancies, Cantalupo, Bogart and Hopkins74 recently quantified the POP in both the para-sagittal and horizontal planes in a sample of 72 chimpanzees and compared the results for the two methods. In terms of overall POP volume, there was no statistical difference in the AQ scores between methods but the AQ scores for the para-sagittal method approached conventional levels of significance with a leftward bias (p < .10) (Table 2).
Table 2.
Distribution of pars opercularis asymmetries in chimpanzees and humans
| #L | #A | #R | AQ | s.e. | %Leftward | |
|---|---|---|---|---|---|---|
| Surface Volume | ||||||
| (C)Cantalupo & Hopkins72 | 20 | 1 | 6 | −.179 | .070 | 8.97 |
| (C)Hopkins et al.73 | 20 | 2 | 9 | −.074 | .040 | 4.78 |
| (C)Cantalupo et al.74 | 35 | 7 | 27 | −.079 | .047 | 3.96 |
| (C)Cantalupo et al.74 | 30 | 3 | 40 | .029 | .035 | −1.42 |
| (H)Foundas et al.76 | 12 | 9 | 11 | NA | NA | NA |
| (H)Foundas et al.75 | NA | NA | NA | -0.082 | 0.035 | NA |
| Gray Matter Volume | ||||||
| (C)Cantalupo et al.74 | 32 | 6 | 31 | −.057 | .044 | .045 |
| (C)Cantalupo et al.74 | 28 | 6 | 31 | .051 | .033 | −.039 |
| (C)Keller et al.71 | 12 | 0 | 18 | −.021 | .139 | −2.62 |
| (H) Knaus et al.70 | ||||||
| (H)Keller et al.14 | 31 | 2 | 17 | NA | NA | NA |
| (H)Keller et al.11 | 14 | 0 | 16 | −.015 | .112 | −1.13 |
| (H)Tomaiuolo et al.15 | 17 | 4 | 29 | .084 | .074 | NA |
(C) = chimpanzee, (H) = humans, #L = number left, #A = number ambiguous, #R = number right, AQ = asymmetry quotient, s.e. = standard error, %Leftward = percentage larger left hemisphere, NA = data not available
In humans, Foundas and colleagues have quantified the overall volume of the POP in the sagittal plane in two separate studies. In one study, Foundas et al.75 compared the POP in a sample of individuals who stuttered and a control group and found no difference between them; however, for the entire sample, they reported a small but significant leftward asymmetry. In a separate study, Foundas et al.76 examined asymmetries in the POP in relation to handedness in a sample of 16 left- and 16 right-handed individuals. No population-level asymmetries were found for the POP, but a significant association was found between handedness and POP asymmetry. A significantly greater proportion of right-handed individuals showed a leftward POP asymmetry (9/16 = 56%) compared to left-handed subjects (3/16 = 19%).
To determine whether volumetric asymmetries in the POP might similarly be influenced by handedness in chimpanzees, I compared the distribution of left- and right-lateralized and ambiguous subjects based on their overall handedness when considered across multiple measures of hand use. Specifically, for this analysis, chimpanzees were classified as right-handed, left-handed, or ambidextrous based on their consistency in hand use across four measures (see below). Chimpanzees that use the same hand for three or four of four tasks were classified as right- or left-handed. Chimpanzees that preferred their left hand on two tasks and the right on the remaining two were classified as ambidextrous. The distribution of left-, right-, or ambiguously lateralized chimpanzees that were classified as right- or left-handed or ambidextrous is shown in Table 3. For comparison, we have provided the findings from Foundas et al.76 in humans. In both humans and chimpanzees, the proportion of left-lateralized subjects is higher for the right- than the left-handed individuals.
Table 3.
Handedness and volumetric asymmetries in POP in humans and chimpanzees
| #L | #A | #R | |
|---|---|---|---|
| Chimpanzees | |||
| Right-Handed | 20 | 4 | 7 |
| Ambidextrous | 8 | 2 | 10 |
| Left-Handed | 6 | 1 | 7 |
| Human | |||
| Right-Handed | 9 | 4 | 3 |
| Left-Handed | 3 | 5 | 8 |
Human data are from Foundas et al.76
Gray matter volume
Rather than quantify the entire POP gyrus, several investigators have focused on quantifying asymmetries in gray matter within this region. In one study, Keller et al. measured the POP in a sample of 50 human subjects and found a small but significant leftward bias. In a follow up comparative study, they measured the gray matter volume of the POP in a sample of 30 humans and 30 chimpanzees and found no evidence of population-level asymmetries in either species (Table 2). Cantalupo et al. also quantified the gray matter volumes of the POP in a sample of 72 chimpanzees and found no population-level asymmetries when measured in the horizontal or para-sagittal planes. The para-sagittal methods used by Cantalupo et al.74 were similar to those used by Knaus et al.,70 who traced the POP in a sample of 60 humans and the distributions of the left- and right-lateralized and ambiguous subjects are shown in Table 2. A Χ2 test of independence failed to reveal significant species differences in POP gray matter asymmetries between chimpanzees and human subjects based on this study.
Cytoarchitectonic asymmetries
Besides morphological asymmetries, several studies have examined asymmetries in the cytoarchitectonic regions corresponding to Broca’s and Wernicke’s areas in humans and chimpanzees57. Broca’s area is comprises Brodmann’s areas 44 and 45 (BA44, BA45) and Wernicke’s area corresponds to BA22, which is sometimes referred to as area Tpt. The distribution of volumetric asymmetries in BA44, BA45 and area Tpt in humans and chimpanzees are shown in Tables 1 and 2. In humans, Uylings et al.77 quantified the volume of BA44 and BA45 in 10 human post-mortem brains and found a significant leftward asymmetry in BA44 and a smaller leftward bias for BA45. In contrast, Schenker et al.78 measured BA44 and BA45 in 12 post-mortem chimpanzee brains and found no population-level bias for either region (Table 2). For area Tpt, data are only available for three human subjects, and each of them showed a leftward asymmetry.79 Spocter et al.80 found a significant leftward asymmetry in area Tpt in 12 post-mortem chimpanzee brains (Table 1).
White matter distribution and connectivity
An important aspect of cortical organization that is often ignored is the presence of asymmetries in white matter. White matter reflects more heavily mylelinated axons, and it has been suggested that asymmetries in white matter may reflect variation in cortical connectivity between hemispheres and between regions within the same hemisphere.81 There are a variety of software programs available that use algorithms to automatically segment T1-weighted MRI scans into gray and white matter, which allows region of interest or voxel-based morphometry methodologies to assess asymmetry in white matter.82,83 More recently, structural magnetic imaging procedures such as diffusion tensor imaging (DTI) have been developed that more directly measure white matter integrity and allow for calculation of tractography in the brain.84
Cantalupo and colleagues85 measured the volume of gray and white matter in the perisylvian regions of the left and right cerebral hemispheres of 34 chimpanzees. The perisylvian regions include the inferior frontal gyrus and lateral portions of the temporal, parietal, and occipital lobes. Significant leftward asymmetries were found in the proportion of white to gray matter in all four regions (see Table 1). Furthermore, the proportion of white to gray matter was significantly higher in the inferior frontal gyrus compared to all other regions. More recently, Rilling et al.86 used DTI probabilistic tractography to measure the degree of asymmetry in the dorsal and ventral pathways between the inferior frontal gyrus and posterior temporal lobe in a sample of 26 humans and chimpanzees. The dorsal pathway corresponds to the arcuate fasciculus, a major white matter tract that connects Broca’s and Wernicke’s areas. Rilling and colleagues found significant leftward asymmetries in the dorsal pathway and no population-level bias in the ventral pathway for both humans and chimpanzees (see Table 1). Rilling et al. further found that the ratio of fiber numbers in the dorsal relative to the ventral pathway was more pronounced in humans compared to chimpanzees, which they concluded may have evolved in humans due to increasing selection for semantic and phonological processing.
Summary of neuroanatomical findings
The results of the neuroanatomical data presented here are not consistent with the discontinuity view of the evolution of neuroanatomical and (by inference) behavioral asymmetries in nonhuman primates. Instead, the comparative data presented here suggest quantitative rather than qualitative differences in the expression of asymmetries in the PT, pSTG and POP between humans and chimpanzees. There are no differences in the proportion of individuals showing leftward, ambiguous, or rightward asymmetries for the PT surface area, pSTG gray matter volume, and the POP total gray matter volume. However, when population-level asymmetries were evident, humans appear to show asymmetries of larger magnitude than chimpanzees, reinforcing the interpretation that the differences are quantitative rather than qualitative. Similarly, both humans and chimpanzees showed leftward asymmetries in white matter in the perisylvian and specifically the arcuate fasciculus, suggesting some homology in connectivity between Broca’s and Werncike’s areas, but the human pathways clearly differ from chimpanzees.
The one major difference between humans and chimpanzees is the cytoarchitectonic data for BA44 and BA45. Based on the published data, humans show a pronounced leftward asymmetry in these regions, particularly for BA44, whereas chimpanzees do not (Tables 1 and 2). This does not appear to be the case for the area Tpt, where chimpanzees, like humans, show a leftward asymmetry (as least for the three human subjects that were studied). Areas BA44 and BA45 are seven times larger in the human than the chimpanzee brain,87 while the human brain is roughly three times larger than the chimpanzee brain. There appears to have been intense selection for expansion of Broca’s area in the human brain, perhaps associated with the evolution of motor and cognitive functions needed for language and speech.
The findings on cytoarchitectonic asymmetries in BA44 and BA45 are difficult to reconcile from the standpoint of intra- and interspecies comparisons. Neither humans nor chimpanzees show population-level asymmetries in the gray matter volumes of the POP, the morphological region corresponding to BA44; however, humans showed a leftward asymmetry in BA44 and chimpanzees did not. If there was a one-to-one correspondence between the cytoarchitectonic boundaries of BA44 and the POP region, one would expect to find significant leftward asymmetries in the human brain. This is not the case and the most parsimonious explanation is that the sulcal boundaries that define the POP do not correspond well to the cytoarchitectonic regions at the individual level of analysis, an explanation for which there is some empirical support.88, 89 The discrepancy between the morphological and cytoarchitectonic findings in humans raises some significant challenges for comparative analyses of brain asymmetries, and there is a need for further study on this topic.
It should be noted that in both chimpanzees and humans, consistent leftward asymmetries were found in the posterior temporal lobe in terms of the PT surface area and the pSTG gray matter volume. In contrast, for the POP, humans and chimpanzees show small but significant leftward asymmetries in the total volume of the region and no population-level bias in gray matter volume. Furthermore, for the total POP volume, at least some evidence suggests that handedness may modulate the pattern of asymmetry in both humans and chimpanzees (Table 3). I would emphasize here that it is often claimed that humans show leftward neruoanatomical asymmetry in Broca’s area,14 but it is a rather nuanced asymmetry which largely depends on whether the total volume or just the gray matter is quantified within the region.7-11, 49, 56
Hand preferences in chimpanzees
In my laboratory, hand preference has been assessed for a variety of different measures with various motor and cognitive demands. Most of the data have come from chimpanzees housed at the YNPRC and UTMDACC facilities but additional data for some measures have come from chimpanzees originally housed at the Primate Foundation of Arizona (PFA) and Alamogordo Primate Facility (APF).
Task-specific variation
Handedness has been assessed in at least 50 individuals for nine behaviors: (1) simple reaching; (2) bimanual feeding; (3) grooming; two measures of coordinated bimanual actions referred to as the (4) TUBE and (5) BALL tasks, (6) tool use; (7) coconut opening; (8) manual gestures; and (9) throwing. The mean HI scores and distribution of hand preferences for each task are shown in Table 4. There are two important sets of results in Table 4. First, population-level right-handedness is evident for throwing, manual gestures, bimanual feeding, bimanual grooming, and for the TUBE and BALL tasks, whereas no overall biases were found for simple reaching, simulated termite fishing, coconut opening, and unimanual grooming. Thus, some tasks are better at eliciting individual and population-level handedness than others. Second, the ratio of right-to-left handed individuals is small, at best 3:1. This is contrast to the 8:1 or 9:1 ratio typically reported for human handedness.
Table 4.
Task-specific handedness in captive chimpanzees
| Measure | #R | #A | #L | HI | s.e. | t-value |
|---|---|---|---|---|---|---|
| Throwing (n = 89) | 50 | 16 | 23 | .30 | .091 | 3.81** |
| Gesture (n = 347) | 169 | 133 | 45 | .26 | .025 | 10.17** |
| TUBE (n= 542) | 272 | 118 | 152 | .14 | .024 | 5.69** |
| Ball (n = 54) | 31 | 14 | 9 | .28 | .083 | 3.59 ** |
| Reaching (n = 345) | 105 | 161 | 79 | .03 | .022 | 1.49 |
| Tool Use (n =192) | 63 | 52 | 74 | −.06 | .040 | −1.42 |
| Coconut (n = 157) | 61 | 32 | 64 | −.01 | .054 | −0.23 |
| Bimanual Feeding (n = 185) | 73 | 65 | 47 | .08 | .032 | 2.34 * |
| (T) Grooming (n = 200) | 48 | 49 | 103 | .03 | .032 | 0.95 |
| (B) Grooming (n= 125) | 28 | 84 | 13 | .13 | .042 | 2.95 ** |
| (U) Grooming (n = 178) | 52 | 78 | 48 | -.01 | .036 | −0.17 |
p < .05
p < .01.
(T) reflects total frequency in right and left hand use for grooming, (B) bimanual grooming, (U) unimanual grooming. #R = number or right-handed, #A = number of ambiguously-handed, #L = number of left-handed. Hand preference classification were based on z-scores calculated on the basis of frequencies in left and right hand use for each task. Subjects with z-scores ≥ 1.96 were classified as right-handed, those with z-scores ≤ −1.96 were classified as left-handed. All others were classified as ambiguously-handed.
Consistency across measures
One claim in the comparative research on handedness is that hand preferences in nonhuman primates are task-specific, whereas humans shows true handedness.63,90 True handedness is defined as consistent hand use across all tasks and most individuals within a sample.63 Recently, Hopkins et al.91 measured hand use in 300 chimpanzees on four tasks including simple reaching, the TUBE task, manual gestures, and tool use, and quantified the consistency in their hand use across the four tasks. They found that the number of chimpanzees that preferred their right for all four tasks was significantly higher than the number who preferred their left hand for all measures (Fig. 4). Compared to what is typically reported in humans, they found a relatively high proportion of ambidextrous individuals. Additionally, the shape of the hand preference distribution was skewed to the right but did not take on a J-shape, which is the typical description of hand preference data for humans.1 The mode of handedness grouping for humans is strongly right-handed compared to the chimpanzee sample, where moderate right-handedness is the modal pattern.
Figure 4.
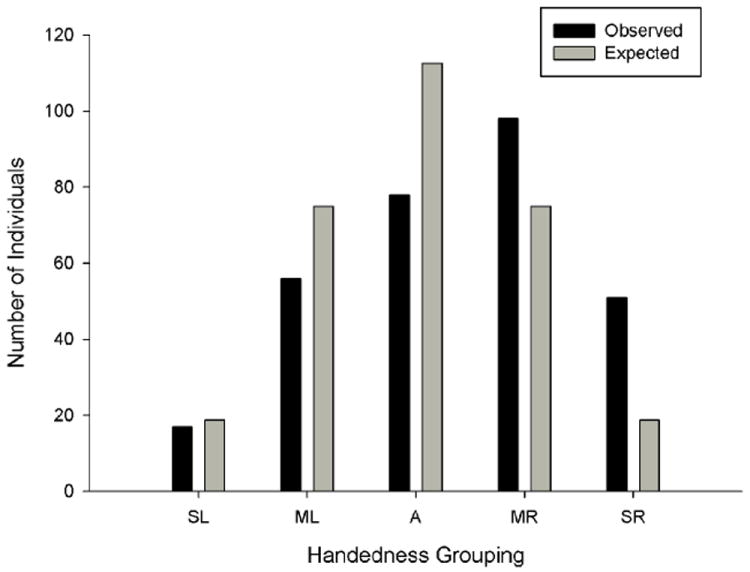
Distribution of handedness in a sample of 300 chimpanzees based on consistency in hand use across four different measures. SR = strongly right-handed, MR = moderately right-handed, A = ambidextrous, ML = moderately left-handed, SL = strongly left-handed.
Consistency across captive settings
Data have been collected for several measures of hand preference from captive chimpanzees residing at different facilities including research facilities, zoos, and sanctuaries. Comparing the handedness data from these different chimpanzee populations allows for an assessment of consistency in hand preferences in apes living in a variety of settings. Figure 5 depicts the mean HI scores for the TUBE task in 642 chimpanzees residing at five different facilities.92-94 The mean HI scores are comparable across settings and no significant differences are found in the data between these cohorts. The degree of right-handedness is small in each sample but is nonetheless consistent and significant. Thus, whatever the significance of the TUBE task as a measure of hand preference, it is consistent across a variety of settings in chimpanzees and therefore likely reflects a species-specific trait.
Figure 5.
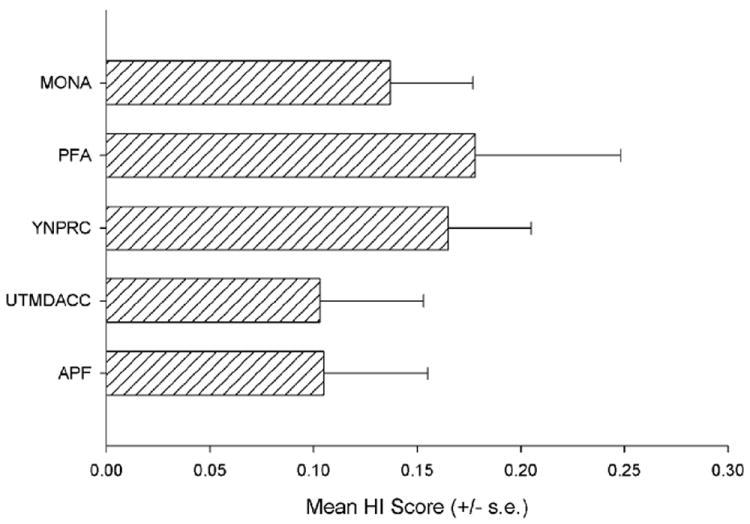
Mean HI scores (+/− s.e.) for the TUBE tasks for five separate chimpanzee samples. MONO = Mono Foundation Santuary and Chimfunshi Wildlife Orphanage, PFA= Primate foundation of Arizona, YNPRC = Yerkes National Primate Research Center, UTMDACC = University of Texas M. D. Anderson Cancer Center, APF = Alamogordo Primate Facility.
Handedness in wild chimpanzees
One of the major differences in interpretation regarding handedness in chimpanzees centers on comparisons between captive and wild individuals. It has been claimed that wild chimpanzees are either (1) ambilateral, meaning that most individuals show no significant hand preference for a specific task,95-98 or (2) they fail to show population-level hand preferences for any specific task.27,90 The claim of a lack of population-level asymmetry in wild compared to captive chimpanzees has led some to suggest that the results in captive individuals may be attributable to the experiences of the apes being raised by humans in a right-handed human world.63 These experiences may have shaped the hand preferences of the chimpanzees to be a more human-like pattern of right-handedness, albeit not to the full extent as seen in humans. Unfortunately, this claim is not supported by the data. There is no evidence that chimpanzees raised by humans show different patterns of hand preference compared to those raised in chimpanzee groups.92,94 Presumably, if human handling influences hand preference, there should be a much greater preponderance of right handedness among the human-raised individuals.
In my view, the claim that wild chimpanzees do not show population-level handedness is not supported, particularly for tasks that elicit significant individual hand preferences, such as tool use. Table 5 shows are the published data on hand preferences for tool use in wild chimpanzees. Within any individual hand preference study, determining population-level handedness is difficult because of a lack of statistical power, particularly as handedness is assumed to be a small effect in nonhuman primates.61 However, when data on similar or identical tasks are combined across individuals from different studies, residing in the same community or combined across different field sites, an interesting picture emerges. Population-level left-handedness is found for termite fishing while right handedness appears for ant-dipping and wadge-dipping/leaf-sponging. For pestle-pounding, no overall bias is found for the pounding action but a right-hand bias is found for reaching to extract the pulp from the hole. No population-level bias is found for nut cracking and throwing. There are too few subjects to reasonably test for asymmetry in algae dipping. There are a notable number of non-preferent individuals in some studies but it is unclear if this is attributable to small samples sizes or an actual lack of preference. It is also interesting to note that the ratio of right- to left-handedness (or left- to right-handedness) is similar to what has been reported in captive chimpanzees.
Table 5.
Summary of Handedness Data for Tool Use from Wild Chimpanzees
| #L | #R | #A | Mean HI | t-value | |
|---|---|---|---|---|---|
| Termite Fishing 124 | 46 | 24 | 7 | −.237 | −2.77 * |
| Ant Dipping 98 | 7 | 22 | 10 | .292 | 2.21 * |
| Wadge Dip/Leaf Sponge 99, 125 | 9 | 27 | 4 | .336 | 3.10 * |
| Nut Cracking 99, 126 | 32 | 44 | 13 | .117 | 1.51 |
| Pestle Pounding127 | |||||
| Pound Action | 7 | 10 | 2 | .012 | 0.78 |
| Reach Action | 4 | 15 | 1 | .341 | 2.34 * |
| Algae Dip 127 | 5 | 9 | 0 | .037 | 0.21 |
| Throwing96 | 1 | 3 | 12 | .089 | 1.65+ |
indicates significant population-level handedness at p < .05.
indicates population-level bias at p < .10. Analyses were based on one-sample t-tests on the HI scores.
The results presented in Table 5 do not include hand preference data from wild chimpanzees for several studies that have focused on hand use for non-tool-use actions such as bimanual feeding, grooming, or so-called spontaneous actions.95,97,99,100 With respect to the studies on spontaneous hand use, I believe there are some serious limitations to these results that warrant some caution. My concern is that most of the behaviors measured in these reports failed to elicit consistent hand preferences at the individual level. The authors rightly concluded that the apes were ambi-lateral based on the data they collected but I would suggest that instead of arguing the apes are ambi-lateral as a species, an alternative interpretation is that the behaviors observed are poor measures of hand preference. From a purely psychometric perspective, it seems to me that if one wants to measure hand preference, then one must record behaviors that elicit consistent hand preference at the individual level.101 None of the behaviors in these studies meet this minimal criterion. More importantly, we know that chimpanzees residing at the same field sites show individual hand preference for other types of actions like bimanual feeding and tool use. For instance, chimpanzees from Mahale show robust individual hand preferences for bimanual feeding with more than 90% of the sample showing a significant hand preference,100 whereas fewer than 10% of the Mahale chimpanzees showed a significant hand preference for spontaneous actions. In short, while I agree that chimpanzees are ambi-lateral for many spontaneous actions, I do not believe that one should conclude that chimpanzees are ambi-preferent as a species based on these findings. I believe the more parsimonious explanation is that the behaviors measured in these studies are poor indicators of manual specialization.
Summary of handedness in chimpanzees
I believe that there is compelling evidence of population-level handedness in both wild and captive chimpanzees, and perhaps in other species as well.93, 102-104 The pattern of expression of handedness in chimpanzees differs from humans in two important ways. First, the proportion of the population that is strongly right-handed is much higher than in chimpanzees. Second, consistency in hand use across multiple measures is much greater in humans than in chimpanzees. The explanation of these differences is not obvious, and I recommend caution when speculating about their potential evolutionary significance in light of the fundamental challenges in comparative studies of handedness. Two fundamental differences in the assessment of handedness in human and nonhuman primates present challenges in their comparison.
First, hand preference in humans is primarily measured by consistency in hand use across multiple measures or items on a questionnaire. That is to say, subjects are judged as right- or left-handed based on how consistently they use the same hand for a series of actions of such as writing, throwing, teeth brushing, etc. In contrast, nonhuman primate handedness assessment relies on frequency in hand use for a specific task and the subsequent classification of subject handedness based on statistical criteria (i.e., significant z-scores).105 No one uses z-scores to assess individual handedness in adult humans for a specific task; z-scores are used sometimes in the assessment of handedness in preverbal children, but in many of these cases, more liberal statistical criteria are used to classify subjects as right- or left-handed.106 These basic methodological and statistical differences in the assessment of individual hand preferences make comparisons between humans and other primates very difficult, because the scales of measurement and the criteria for characterizing individual hand preferences are completely different.
Second, many studies of handedness in nonhuman primates select tasks or behaviors on the basis of convenience rather than any conceptual or empirical criteria.101 Researchers measuring hand preferences in nonhuman primates tend to select tasks that are easy to observe and record but not necessarily behaviors that elicit consistent hand preferences at the individual level of analysis. For instance, in the recent paper by Hopkins et al.,91 chimpanzee hand preferences were characterized across four measures that were selected because more data were available for these tasks than any other criteria. In contrast, in the measurement of human hand preference, instruments are developed to accurately measure the construct handedness.107 Items on a handedness questionnaire are not selected by convenience, but rather by their ability to accurately discriminate left- and right-handed individuals. Indeed, questionnaire items that are not effective in distinguishing different handedness groups are removed from the instrument. These inherent differences in how scientists approach the measure of handedness can potentially lead to very different patterns of hand preference within and between species. In this case, potential species differences in consistency in hand use across multiple measures many not reflect inherent biological or evolutionary factors, but may rather be a manifestation of differences in the approach to handedness assessment.
Implications for the evolution of hemispheric specialization
In my view, the findings on neuroanatomical asymmetry and handedness point to the existence of population-level asymmetries in chimpanzees. Chimpanzees appear to show the same pattern of asymmetry as humans, though the magnitude of the asymmetry is more pronounced in humans. Thus, the difference between human and chimpanzee asymmetry, at least as reported here, is quantitative not qualitative, as is argued by those advocating a view of discontinuity in lateralization. In the final portion of this paper, I discuss several evolutionary scenarios that might explain the emergence of anatomical and functional asymmetries in primates.
Anatomical and functional asymmetries as a consequence of brain size
It has been hypothesized that anatomical and behavioral asymmetries, particularly among mammals,108 and specifically primates,81 evolved as a consequence of increasing brain size.77 Comparative studies of the corpus callosum (CC) have shown that as brain size increased in primate evolution, the size of the CC did not keep pace.81 Thus, humans have a relatively small CC for an organism of their brain size compared to other primates (Fig. 6). Homotopic and heterotopic fibers connecting homologous brain regions in the left and right hemispheres traverse the CC, 109,110 and therefore a relatively smaller CC presumably has fewer fibers connecting these regions. In short, each hemisphere became increasingly independent or split with the evolution of larger brains, and this presumably resulted in increased anatomical and functional specializations within each hemisphere.81,111 The findings presented here are consistent with this theory: chimpanzees exhibit population-level asymmetries that are quantitatively smaller than those found in humans, as would be predicted given their smaller brain size. Furthermore, the evidence of white matter asymmetries in the perisylvian regions, and specifically for white matter tracts connecting the IFG and PT, are consistent with the view that functional specializations of the brain may be more strongly linked to intrahemispheric rather than interhemispheric connectivity. The one limitation of this theory is that it fails to explain the evolution of population-level asymmetries. Thus, increasing brain size might be inversely related to the size of the CC, and this may have facilitated a division of function between the two hemispheres, but it does not explain why certain functions went to the same hemisphere in a majority of individuals.
Figure 6.
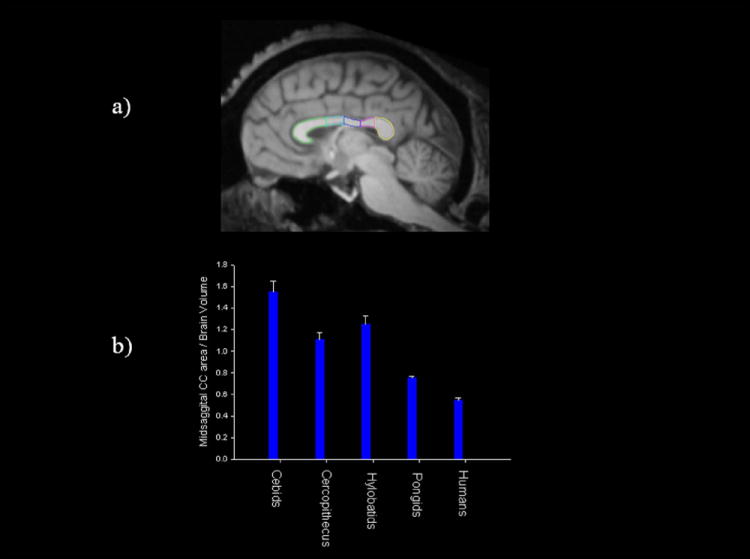
(a) Midsagittal view of the corpus callosum in a chimpanzee MRI scans. Different colors indicate different regions of the corpus callosum. Green = genu, cyan = anterior midbody, blue = central midbody, red = isthmus, yellow = splenium. (b) Mean ratio (+/− s.e.) in corpus callosum size to total brain volume in different primate families (data regraphed from Rilling et al.81).
Socio-cultural evolution
It is also possible that handedness is simply a more malleable trait than brain asymmetry. From this perspective, the distribution of brain asymmetries in humans and chimpanzees reflect their natural biological manifestation, whereas handedness is a combination of both the biological expression of hemispheric specialization and an additive effect of socio-cultural mechanisms. Thus, there is a biological disposition for an approximate 2:1 or 3:1 ratio of dominant-to-nondominant individuals, which is evident in both chimpanzees and humans; however, there is an additive influence of socio-cultural conformity toward right handedness in humans that is absent in chimpanzees and other nonhuman primates.112 In short, there is no cultural pressure to conform to a specific handedness pattern in chimpanzees. One body of evidence in support of this view is the data on heritability in handedness in humans and chimpanzees. Family studies and research with twins in humans suggest that about 35% to 40% of the variability in handedness is attributable to genetic factors, while the remaining is explained by shared and non-shared environmental factors.113 For example, Warren et al.114 estimated the heritability of handedness for 10 handedness items in a sample of more than 500 Mexican-Americans and found that the values ranged from .06 to .17, with significant heritability for 6 of the 10 items. Furthermore, there were significant genetic and environmental correlations in hand use for the individual items. Recently, using the extended pedigree database of captive chimpanzee populations, my colleagues and I have estimated the heritability in hand preference for three measures of hand use including simple reaching, bimanual coordination, and manual gestures. The range of genetic contributions to preferences were between .24 and .42,115 which are well within and in some cases exceed the values reported by Warren et al. in humans. This finding appears to rule out the possibility that some mutation in the human genome resulted in the emergence of behavioral and brain asymmetries. Instead, it suggests that comparable genetic and nongenetic factors play roles in handedness but, for unknown reasons, the nongenetic factors push humans to the extreme right end of the handedness spectrum.
The significance of tool use
Much of the debate regarding the evolution of handedness in primates has centered around the question of motor control for systems related to language and speech; however, it should be stated that complex praxic functions are also controlled by the left hemisphere, and clinical and functional imaging studies have revealed evidence that motor planning for the execution of movements by both the right and left hands is carried out by the left hemisphere.116 Thus, when human subjects are asked to imagine carrying out complex motor actions by both the left and right hands, significant patterns of activation are found in premotor and primary motor regions (as well as other areas) within the left hemisphere. I describe these findings in human subjects because scientists working with nonhuman primates use hand preferences as a proxy for inferring hemispheric specialization in motor action and skill. Thus, evidence of significantly more right- than left-handed subjects is interpreted as evidence that the left hemisphere is dominant for motor skill, but this assumption has seldom been tested. More importantly, from an evolutionary standpoint, selection for the cognitive and motor skills needed for actions like tool use were presumably more uniform than the specific motor demands themselves and their hand use. Thus, tool use is widespread in chimpanzees,117 but the forms of tool use vary substantially. During primate evolution, there may have been selection for increasing motor control for the planning of complex praxic movements, such as those involved in various forms of tool use, rather than for the specific actions themselves or associated hand preferences. This may explain why there is variability in hand preferences for different forms of tool use in wild chimpanzees (Table 5). In sum, there might be too much emphasis on measuring hand preference and too little effort on measuring hand skill in both captive and wild chimpanzees (and other primates).
Limitations
At least two limitations or qualifications regarding behavioral and brain asymmetries should be acknowledged in this paper. First, I have focused on anatomical asymmetries in the brain, but functional specialization is also an important aspect of cortical organization to consider. Though there have been several recent functional imaging studies in chimpanzees and monkeys,118-122 none of these studies had sample sizes that would allow for any reasonable inferences to be made regarding population-level asymmetries. For this reason, I have not included them in this review, but I strongly believe that this should be the focus in future research. Second, I have focused entirely on behavioral and neuroanatomical asymmetries in chimpanzees and have largely ignored data from other great apes and monkeys. Ultimately, any unified theory on the evolution of behavioral and brain asymmetries will need to incorporate data from a larger range of primate species.
Concluding remarks
In the past 20 years, there has been a plethora of studies on behavioral and brain asymmetries in nonhuman animals. The collective findings, including those presented here, clearly challenge the long-held belief that population-level asymmetries are uniquely human. In my view, the question is no longer whether population-level asymmetries are present in nonhuman primates, but instead, what evolutionary forces selected for asymmetry and what mechanisms underlie their expression. Further, future work should focus on the extent to which neuroanatomical asymmetries are linked to behavioral and cognitive processes. Among primates, advances in in vivo anatomical and functional imaging technologies have provided an unprecedented framework and methodology for comparative studies in brain asymmetries in human and nonhuman primates. Non-invasive imaging technology has allowed, and will continue to allow, for examination of the relation between behavioral and brain asymmetries in primates, studies that were historically difficult to conduct and often involved invasive procedures. It is my belief that continued research with nonhuman primates, and particularly chimpanzees, will further advance our knowledge of the phylogeny and role of genetic and non-genetic factors on the expression of behavioral and brain asymmetries.
Acknowledgments
This research was supported in part by NIH Grants NS-42867, NS-73134, HD-60563 and HD-56232. The Yerkes Center is fully accredited by the American Association for Accreditation of Laboratory Animal Care. American Psychological Association and Institute of Medicine guidelines for the ethical treatment of animals were adhered to during all aspects of this study. I am grateful to the helpful assistance of the entire veterinary staff at the Yerkes Center for their assistance in collection of the MRI scans.
References
- 1.Porac C, Coren S. Lateral preferences and human behavior. Springer; New York: 1981. [Google Scholar]
- 2.Raymond M, Pontier D. Is there geographical variation in human handedness? Laterality. 2004;9:35–51. doi: 10.1080/13576500244000274. [DOI] [PubMed] [Google Scholar]
- 3.Perelle IB, Ehrman L. An international study of human handedness : The data. Behavior Genetics. 1994;24:217–227. doi: 10.1007/BF01067189. [DOI] [PubMed] [Google Scholar]
- 4.Cooper DL. Broca’s Arrow: Evolution, prediction and language in the brain. The Anatomical Record (Part B: New Anatomy) 2006;289B:9–24. doi: 10.1002/ar.b.20088. [DOI] [PubMed] [Google Scholar]
- 5.Horwitz B, et al. Activation of Broca’s area during the production of spoken and signed language: a combined cytoarchitectonic mapping and PET analysis. Neuropsychologia. 1999;41:1868–1876. doi: 10.1016/s0028-3932(03)00125-8. [DOI] [PubMed] [Google Scholar]
- 6.Josse G, Tzouio-Mazoyer N. Hemispheric specialization for language. Brain Research Reviews. 2004;44:1–12. doi: 10.1016/j.brainresrev.2003.10.001. [DOI] [PubMed] [Google Scholar]
- 7.Bookheimer S. Functional MRI of language: New approaches to understanding the cortical organization of semantic processing. Annual Review of Neuroscience. 2002;25:151–188. doi: 10.1146/annurev.neuro.25.112701.142946. [DOI] [PubMed] [Google Scholar]
- 8.Schirmer A, Fox PM, Grandjean D. On the spatial organization of sound processing in the human temporal lobe: A meta-analysis. NeuroImage. 2012;63 doi: 10.1016/j.neuroimage.2012.06.025. [DOI] [PubMed] [Google Scholar]
- 9.Knecht S, et al. Handedness and hemispheric language dominance in healthy humans. Brain. 2000;123:2512–2518. doi: 10.1093/brain/123.12.2512. [DOI] [PubMed] [Google Scholar]
- 10.Josse G, et al. Predicting language lateralization from gray matter. Journal of Neuroscience. 2009;29:13516–13523. doi: 10.1523/JNEUROSCI.1680-09.2009. [DOI] [PMC free article] [PubMed] [Google Scholar]
- 11.Josse G, et al. Left planum temporale: an anatomical marker of left hemispheric specialization for language comprehension. Cognitive Brain Research. 2003;18:1–14. doi: 10.1016/j.cogbrainres.2003.08.007. [DOI] [PubMed] [Google Scholar]
- 12.Nishitani N, et al. Broca’s region: From action to language. Physiology. 2005;20:60–67. doi: 10.1152/physiol.00043.2004. [DOI] [PubMed] [Google Scholar]
- 13.Toga AW, Thompson M. Mapping Brain Asymmetry. Nature. 2003;4:37–48. doi: 10.1038/nrn1009. [DOI] [PubMed] [Google Scholar]
- 14.Keller SS, et al. Broca’s area: Nomenclature, anatomy, typology and asymmetry Brain and Language. 2009;109:29–48. doi: 10.1016/j.bandl.2008.11.005. [DOI] [PubMed] [Google Scholar]
- 15.Tomaiuolo F, et al. Morphology, morphometry and probability mapping of the pars opercularis of the inferior frontal gyrus: an in vivo MRI analysis European. Journal of Neuroscience. 1999;11:3033–3046. doi: 10.1046/j.1460-9568.1999.00718.x. [DOI] [PubMed] [Google Scholar]
- 16.Robichon F, et al. Developmental dyslexia: atypical cortical asymmetries and functional significance. Eur J Neurol. 2000;7:35–46. doi: 10.1046/j.1468-1331.2000.00020.x. [DOI] [PubMed] [Google Scholar]
- 17.Beaton AA. The relation of planum temporale asymmetry and morphology of the corpus callosum to handedness, gender and dyslexia: A review of the evidence. Brain and Language. 1997;60:255–322. doi: 10.1006/brln.1997.1825. [DOI] [PubMed] [Google Scholar]
- 18.Shapleske J, et al. The planum temporale: a systematic, quantitative review of its structural, functional and clinical significance. Brain Research Reviews. 1999;29:26–49. doi: 10.1016/s0165-0173(98)00047-2. [DOI] [PubMed] [Google Scholar]
- 19.Sommer I, et al. Sex differences in handedness, asymmetry of the Planum Temporale and functional language lateralization. Brain Research. 2008;1206:76–88. doi: 10.1016/j.brainres.2008.01.003. [DOI] [PubMed] [Google Scholar]
- 20.Sommer I, Ramsey N, Kahn R. Handedness, language lateralisation and anatomical asymmetry in schizophrenia: Meta-analysis. British Journal of Psychiatry. 2001;178:344–351. doi: 10.1192/bjp.178.4.344. [DOI] [PubMed] [Google Scholar]
- 21.Warren JM. Handedness and laterality in humans and other animals. Physiological Psychology. 1980;8:351–359. [Google Scholar]
- 22.Ettlinger GF. Hand preference, ability and hemispheric specialization. How far are these factors related in the monkey? Cortex. 1988;24:389–398. doi: 10.1016/s0010-9452(88)80002-9. [DOI] [PubMed] [Google Scholar]
- 23.Crow T. Directional asymmetry is the key to the origin of modern Homo sapiens (the Broca-Annett axiom): A reply to Rogers’ review of The Speciation of Modern Homo Sapiens. Laterality: Asymmetries of Body, Brain and Cognition. 2004;9:233–242. [Google Scholar]
- 24.Williams NA, et al. Accelerated evolution of Protocadherin 11X/Y: A candidate gene-pair for cerebral asymmetry and language. American Journal of Medical Genetics Part B (Neuropsychiatric Genetics) 2006;141B:623.633. doi: 10.1002/ajmg.b.30357. [DOI] [PubMed] [Google Scholar]
- 25.Schoenemann PT. Evolution of size and functional areas of the human brain. Annual Review of Anthropology. 2006;35:379–406. [Google Scholar]
- 26.Lehman RAW. Manual preference in prosimians, monkeys, and apes. In: Ward JP, Hopkins WD, editors. Primate laterality: Current behavioral evidence of primate asymmetries. Springer-Verlag; New York: 1993. pp. 107–124. [Google Scholar]
- 27.Uomini NT. The prehistory of handedness: Archeological data and comparative ethology. Journal of Human Evolution. 2009;57:411–419. doi: 10.1016/j.jhevol.2009.02.012. [DOI] [PubMed] [Google Scholar]
- 28.Corballis MC. The lopsided brain: Evolution of the generative mind. Oxford University Press; New York: 1992. [Google Scholar]
- 29.Bradshaw B, Rogers L. The evolution of lateral asymmetries, language, tool-use and intellect. Academic Press; San Diego: 1993. [Google Scholar]
- 30.Frost GT. Tool behavior and the origin of laterality. Journal of Human Evolution. 1980;9:447–459. [Google Scholar]
- 31.Annett M. Handedness and brain asymmetry: The right shift theory. Psychology Press; Hove: 2002. [Google Scholar]
- 32.Strockens F, Gunturkun O, Sebastian O. Limb preferences in non-human vertebrates. Laterality. doi: 10.1080/1357650X.2012.723008. in press. [DOI] [PubMed] [Google Scholar]
- 33.Rogers LJ, Andrew JR. Comparative vertebrate lateralization. Cambridge University Press; Cambridge: 2002. [Google Scholar]
- 34.Andrew RJ. The nature of behavioral lateralization in the chick. In: Andrew RJ, editor. Neural and behavioral plasticity The use of the chick as a model. Oxford University Press; Oxford: 1991. pp. 536–554. [Google Scholar]
- 35.Güntürkün O. Avian visual lateralization: A review. Neuroreport. 1997;8:3–11. [PubMed] [Google Scholar]
- 36.Bisazza A, et al. Right pawededness in toads. Nature. 1996;379:404. [Google Scholar]
- 37.Bisazza A, et al. Population lateralization and social behavior: A study with sixteen species of fish. Laterality. 2000;5:269–284. doi: 10.1080/713754381. [DOI] [PubMed] [Google Scholar]
- 38.Bisazza A, Sovrano AV, Vallortigara G. Consistency among different tasks of left-right asymmetries in lines of fish originally selected for opposite direction of lateralization in a detour task. Neuropsychologia. 2001;39:1077–1085. doi: 10.1016/s0028-3932(01)00034-3. [DOI] [PubMed] [Google Scholar]
- 39.Hook-Costigan MA, Rogers LJ. Lateralized use of the mouth in production of vocalizations by marmosets. Neuropsychologia. 1998;36:1265–1273. doi: 10.1016/s0028-3932(98)00037-2. [DOI] [PubMed] [Google Scholar]
- 40.Fernandez-Carriba S, et al. Asymmetry in facial expression of emotions by chimpanzees. Neuropsychologia. 2002;40:1523–1533. doi: 10.1016/s0028-3932(02)00028-3. [DOI] [PubMed] [Google Scholar]
- 41.Wallez C, et al. Contrast of hemispheric lateralization for oro-facial movements between learned attention-getting sounds and species-typical vocalizations in chimpanzees: extension in a second colony. Brain Lang. 2012;123:75–79. doi: 10.1016/j.bandl.2012.07.002. [DOI] [PMC free article] [PubMed] [Google Scholar]
- 42.Wallez C, Vauclair J. Right hemisphere dominance for emotion processing in baboons. Brain Cogn. 2011;75:164–169. doi: 10.1016/j.bandc.2010.11.004. [DOI] [PubMed] [Google Scholar]
- 43.Wallez C, Vauclair J. First evidence of population-level oro-facial asymmetries during the production of distress calls by macaque (Macaca mulatta) and baboon (Papio anubis) infants. Behav Brain Res. 2012;234:69–75. doi: 10.1016/j.bbr.2012.06.004. [DOI] [PubMed] [Google Scholar]
- 44.Losin ER, et al. Left hemisphere specialization for oro-facial movements of learned vocal signals by captive chimpanzees. PlosONE. 2008;3:1–7. doi: 10.1371/journal.pone.0002529. [DOI] [PMC free article] [PubMed] [Google Scholar]
- 45.Hamilton CR, Vermeire BA. Complementary hemispheric specialization in monkeys. Science. 1988;242:1691–1694. doi: 10.1126/science.3201258. [DOI] [PubMed] [Google Scholar]
- 46.Hopkins WD, Vauclair J. Evolution of behavioral and brain asymmetries in primates with specific reference to theories on the origins of language. In: Tallerman M, Gibson K, editors. The Oxford Handbook of Human Evolution. Oxford University Press; Oxford: 2012. pp. 184–197. [Google Scholar]
- 47.Yeni-Komshian G, Benson D. Anatomical study of cerebral asymmetry in the temporal lobe of humans, chimpanzees and monkeys. Science. 1976;192:387–389. doi: 10.1126/science.816005. [DOI] [PubMed] [Google Scholar]
- 48.Heilbronner PL, Holloway RL. Anatomical brain asymmetries in New World and Old World monkeys. Stages of temporal lobe development in primate evolution. American Journal of Physical Anthropology. 1988;76:39–48. doi: 10.1002/ajpa.1330760105. [DOI] [PubMed] [Google Scholar]
- 49.Hopkins WD, Pilcher DL, MacGregor L. Sylvian fissure length asymmetries in primates revisited: A comparative MRI study. Brain, Behavior and Evolution. 2000;56:293–299. doi: 10.1159/000047213. [DOI] [PMC free article] [PubMed] [Google Scholar]
- 50.Liu ST, Phillips KA. Sylvian fissure asymmetries in capuchin monkeys (Cebus apell) Laterality. 2009;14:217–227. doi: 10.1080/13576500802344404. [DOI] [PubMed] [Google Scholar]
- 51.Bogart SL, et al. Cortical sulci asymmetries in chimpanzees and macaques: A new look at an old idea. NeuroImage. 2012;61:533–541. doi: 10.1016/j.neuroimage.2012.03.082. [DOI] [PMC free article] [PubMed] [Google Scholar]
- 52.Balzeau A, Gilissen E. Endocranial shape asymmetries in Pan panuscus, Pan troglodyte, and Gorilla gorill assessed via skull based landmark analysis. Journal of Human Evolution. 2010;59:54–69. doi: 10.1016/j.jhevol.2010.03.013. [DOI] [PubMed] [Google Scholar]
- 53.Gannon PJ, et al. Asymmetry of chimpanzee Planum Temporale: Humanlike pattern of Wernicke’s language area homolog. Science. 1998;279:220–222. doi: 10.1126/science.279.5348.220. [DOI] [PubMed] [Google Scholar]
- 54.Gilissen E. Structural symmetries and asymmetries in human and chimpanzee brains. In: Falk D, Gibson KR, editors. Evolutionary anatomy of the primate cerebral cortex. Cambridge University; Cambridge: 2001. pp. 187–215. [Google Scholar]
- 55.Gilissen E, Hopkins WD. Asymmetries in the parietal operculum in chimpanzees (Pan troglodytes) in relation to handedness for tool use. Cerebral Cortex. doi: 10.1093/cercor/bhs029. in press. [DOI] [PMC free article] [PubMed] [Google Scholar]
- 56.Lyn HL, et al. Planum temporale grey matter asymmetries in chimpanzees (Pan troglodyte), vervet (Chlorocebus aethiops sabaeus), rhesus (Macaca mulatta) and bonnet (Macaca radiata) monkeys. Neuropsychologia. 2011;49:2004–2012. doi: 10.1016/j.neuropsychologia.2011.03.030. [DOI] [PMC free article] [PubMed] [Google Scholar]
- 57.Fagot J, Vauclair J. Manual laterality in nonhuman primates: A distinction between handedness and manual specialization. Psychological Bulletin. 1991;109:76–89. doi: 10.1037/0033-2909.109.1.76. [DOI] [PubMed] [Google Scholar]
- 58.Hook-Costigan MA, Rogers LJ. Hand preferences in New World primates. International Journal of Comparative Psychology. 1997;9:173–207. [Google Scholar]
- 59.Papademetriou E, Sheu CF, Michel GF. A meta-analysis of primate hand preferences for reaching and other hand-use measures. Journal of Comparative Psychology. 2005;119:33–48. doi: 10.1037/0735-7036.119.1.33. [DOI] [PubMed] [Google Scholar]
- 60.Marchant LF, McGrew WC. Laterality of function in apes: A meta-analysis of methods. Journal of Human Evolution. 1991;21:425–438. [Google Scholar]
- 61.Hopkins WD. Comparative and familial analysis of handedness in great apes. Psychological Bulletin. 2006;132:538–559. doi: 10.1037/0033-2909.132.4.538. [DOI] [PMC free article] [PubMed] [Google Scholar]
- 62.MacNeilage PF, Studdert-Kennedy MG, Lindblom B. Primate handedness reconsidered. Behavioral and Brain Sciences. 1987;10:247–303. [Google Scholar]
- 63.McGrew WC, Marchant LF. On the other hand: Current issues in and meta-analysis of the behavioral laterality of hand function in non-human primates. Yearbook of Physical Anthropology. 1997;40:201–232. [Google Scholar]
- 64.Gannon PJ, et al. Planum parietale of chimpanzees and orangutans: A comparative resonance of human-like planum temporale asymmetry. The Anatomical Record. 2005;287:1128–1141. doi: 10.1002/ar.a.20256. [DOI] [PubMed] [Google Scholar]
- 65.Taglialatela JP, Dadda M, Hopkins WD. Sex differences in asymmetry of the planum parietale in chimpanzees (Pan troglodytes) Behavioural Brain Research. 2007;184:185–191. doi: 10.1016/j.bbr.2007.07.025. [DOI] [PMC free article] [PubMed] [Google Scholar]
- 66.Freeman HD, Cantalupo C, Hopkins WD. Asymmetries in the hippocampus and amygdala of chimpanzees (Pan troglodyte) Behavioral Neuroscience. 2004;118:1460–1465. doi: 10.1037/0735-7044.118.6.1460. [DOI] [PMC free article] [PubMed] [Google Scholar]
- 67.Hopkins WD, Nir T. Planum temporale surface area and grey matter asymmetries in chimpanzees (Pan troglodyte): The effect of handedness and comparison within findings in humans. Behavioural Brain Research. 2010;208:436–443. doi: 10.1016/j.bbr.2009.12.012. [DOI] [PMC free article] [PubMed] [Google Scholar]
- 68.Smith SM, et al. Advances in functional and structural MR image analysis and implementation of FSL. NeuroImage. 2004;23(S1):208–219. doi: 10.1016/j.neuroimage.2004.07.051. [DOI] [PubMed] [Google Scholar]
- 69.Knaus TA, et al. Variability in perisylvian brain anatomy in healthy adults. Brain and Language. 2006;97:219–232. doi: 10.1016/j.bandl.2005.10.008. [DOI] [PubMed] [Google Scholar]
- 70.Knaus TA, et al. Anatomical asymemtries of anterior perisylvian speech-language regions. Cortex. 2007;43:499–510. doi: 10.1016/s0010-9452(08)70244-2. [DOI] [PubMed] [Google Scholar]
- 71.Keller SS, Roberts N, Hopkins WD. A comparative magnetic resonance imaging study of the anatomy, variability and asymmetry of Broca’s area in the human and chimpanzee brain. Journal of Neuroscience. 2009;29:14607–14616. doi: 10.1523/JNEUROSCI.2892-09.2009. [DOI] [PMC free article] [PubMed] [Google Scholar]
- 72.Cantalupo C, Hopkins WD. Asymmetric Broca’s area in great apes. Nature. 2001;414505 doi: 10.1038/35107134. [DOI] [PMC free article] [PubMed] [Google Scholar]
- 73.Hopkins WD, et al. Gray matter asymmetries in chimpanzees as revealed by voxel-based morphometry. NeuroImage. 2008;42:491–497. doi: 10.1016/j.neuroimage.2008.05.014. [DOI] [PMC free article] [PubMed] [Google Scholar]
- 74.Cantalupo C, Bogart SL, Hopkins WD. Asymmetries in Broca’s area homolog of the chimpanzee brain revisited: Convergent evidence from multiple. MRI methods Cortex 2012 [Google Scholar]
- 75.Foundas AL, et al. Anomolous anatomy of speech-languge areas in adults with persistent developmental stuttering. Neurology. 2001;57:210–215. doi: 10.1212/wnl.57.2.207. [DOI] [PubMed] [Google Scholar]
- 76.Foundas A, Leonard C, Heilman K. Morphological cerebral asymmetries and handedness: The pars triangularis and planum temporale. Archives of Neurology. 1995;52:501–508. doi: 10.1001/archneur.1995.00540290091023. [DOI] [PubMed] [Google Scholar]
- 77.Uylings H, et al. Left-right asymmetry in volume and number of neurons in adult Broca’s area. Cortex. 2006;42:652–658. doi: 10.1016/s0010-9452(08)70401-5. [DOI] [PubMed] [Google Scholar]
- 78.Schenker NM, et al. Broca’s area homologue in chimpanzees (Pan troglodytes): probabilistic mapping, asymmetry, and comparison to humans. Cerebral Cortex. 2010;20:730–742. doi: 10.1093/cercor/bhp138. [DOI] [PMC free article] [PubMed] [Google Scholar]
- 79.Galaburda AM, Sanides F. Cytoarchitectonic organization of the human audittory cortex. The Journal of Comparative Neurology. 1980;190:597–610. doi: 10.1002/cne.901900312. [DOI] [PubMed] [Google Scholar]
- 80.Spocter MA, et al. Wernicke’s area homolog in chimpanzees (Pan troglodytes): Probabilstic mapping, asymmetry and comparison with humans. Proceedings of the Royal Society B, Biological Sciences. 2010;277:2165–2174. doi: 10.1098/rspb.2010.0011. [DOI] [PMC free article] [PubMed] [Google Scholar]
- 81.Rilling JK, Insel TR. Differential expansion of neural projection systems in primate brain evolution. NeuroReport. 1999;10:1453–1459. doi: 10.1097/00001756-199905140-00012. [DOI] [PubMed] [Google Scholar]
- 82.Barrick TR, et al. White matter pathway asymmetry underlies functional lateralization. Cerebral Cortex. 2007;17:591–598. doi: 10.1093/cercor/bhk004. [DOI] [PubMed] [Google Scholar]
- 83.Buchel C, et al. White matter asymmetry in the human brain: A diffusion tensor MRI study. Cerebral Cortex. 2004;14 doi: 10.1093/cercor/bhh055. [DOI] [PubMed] [Google Scholar]
- 84.Wakana S, et al. Fiber tract-based atlas of human white matter anatomy. Radiology. 2004;230:77–87. doi: 10.1148/radiol.2301021640. [DOI] [PubMed] [Google Scholar]
- 85.Cantalupo C, et al. The chimpanzee show human-like perisylvian asymmetries in white matter. European Journal of Neuroscience. 2009;30:431–438. doi: 10.1111/j.1460-9568.2009.06830.x. [DOI] [PMC free article] [PubMed] [Google Scholar]
- 86.Rilling JK, et al. Continuity, divergence and the evolution of brain language pathways. Frontiers in Evolutionary Neuroscience. 2012;3:1–6. doi: 10.3389/fnevo.2011.00011. [DOI] [PMC free article] [PubMed] [Google Scholar]
- 87.Sherwood CC, et al. Human brain evolution writ large and small. In: Hofman MA, Falk D, editors. Progress in Brain Research. Elsevier; 2012. [DOI] [PubMed] [Google Scholar]
- 88.Amunts K, et al. Broca’s region revisited: Cytoarchitecture and intersubject variability. The Journal of Comparative Neurology. 1999;412:319–341. doi: 10.1002/(sici)1096-9861(19990920)412:2<319::aid-cne10>3.0.co;2-7. [DOI] [PubMed] [Google Scholar]
- 89.Zilles K, Amunts K. Centenary of Brodmann’s map-conception and fate. Nature Reviews Neuroscience. 2010;11:139–145. doi: 10.1038/nrn2776. [DOI] [PubMed] [Google Scholar]
- 90.Cashmore L, Uomini N, Chapelain A. The evolution of handedness in humans and great apes: A review and current issues. Journal of Anthropological Studies. 2008;86:7–35. [PubMed] [Google Scholar]
- 91.Hopkins WD, et al. Within- and between-tas consistency in hand use as a means of characterizing hand preferenecs in captive chimpanzees (Pan troglodytes) Journal of Comparative Psychology. doi: 10.1037/a0031071. in press. [DOI] [PMC free article] [PubMed] [Google Scholar]
- 92.Hopkins WD, et al. Chimpanzees are predominantly right-handed: Replication in three colonies of apes. Behavioral Neuroscience. 2004;118:659–663. doi: 10.1037/0735-7044.118.3.659. [DOI] [PMC free article] [PubMed] [Google Scholar]
- 93.Hopkins WD, et al. Hand preferences for coordinated bimanual actions in 777 great apes: Implications for the eution of handedness in Hominins. Journal of Human Evolution. 2011;60 doi: 10.1016/j.jhevol.2010.12.008. [DOI] [PMC free article] [PubMed] [Google Scholar]
- 94.Llorente A, et al. Population-level right handedness for a coordinated bimanual task in naturalistic housed chimpanzees: replication and extension in 114 animals from Zambia and Spain. American Journal of Primatology. 2010;71:1–10. doi: 10.1002/ajp.20895. [DOI] [PubMed] [Google Scholar]
- 95.McGrew WC, Marchant LF. Ethological study of manual laterality in the chimpanzees of the Mahale mountains, Tanzania. Behaviour. 2001;138:329–358. [Google Scholar]
- 96.Nishida T, McGrew WC, Marchant LF. Wild chimpanzees at Mahale are not manually lateralized for throwing. Pan Africa News Letter. in press. [Google Scholar]
- 97.Marchant LF, McGrew WC. Laterality of limb function in wild chimpanzees of Gombe National Park: comprehensive study of spontaneous activities. Journal of Human Evolution. 1996;30:427–443. [Google Scholar]
- 98.Marchant LF, McGrew WC. Ant fishing by wild chimpanzees is not lateralised. Primates. 2007;48:22–26. doi: 10.1007/s10329-006-0020-3. [DOI] [PubMed] [Google Scholar]
- 99.Boesch C. Handedness in wild chimpanzees. International Journal of Primatology. 1991;6:541–558. [Google Scholar]
- 100.Corp N, Byrne RW. Sex difference in chimpanzee handedness. American Journal of Physical Anthropology. 2004;123:62–68. doi: 10.1002/ajpa.10218. [DOI] [PubMed] [Google Scholar]
- 101.Hopkins WD. Comparing human and nonhuman primate handedness: Challenges and a modest proposal for concensus. Dev Psychobiol. doi: 10.1002/dev.21139. in press. [DOI] [PMC free article] [PubMed] [Google Scholar]
- 102.Vauclair J, Meguerditchian A, Hopkins WD. Hand preferences for unimanual and coordinated bimanual tasks in baboons (Papio anubis) Cognitive Brain Research. 2005;25:210–216. doi: 10.1016/j.cogbrainres.2005.05.012. [DOI] [PMC free article] [PubMed] [Google Scholar]
- 103.Meguerditchian A, Vauclair J. Baboons communicate with their right hand. Behavioural Brain Research. 2006;171:170–174. doi: 10.1016/j.bbr.2006.03.018. [DOI] [PubMed] [Google Scholar]
- 104.Spinozzi G, Castornina MG, Truppa V. Hand preferences for unimanual and coordinated-bimanual tasks in tufted capuchin monkeys (Cebus apell) Journal of Comparative Psychology. 1998;112:183–191. [Google Scholar]
- 105.Hopkins WD. Independence of data points in the measurement of handedness: Statistical problem or urban myth? Am J Phys Anthropol. doi: 10.1002/ajpa.22248. in press. [DOI] [PMC free article] [PubMed] [Google Scholar]
- 106.Fagard J, Marks A. Unimanual and bimanual tasks and the assessment of handedness in toddlers. Developmental Science. 2000;3:137–147. [Google Scholar]
- 107.Oldfield RC. The assessment and analysis of handedness: the Edinburgh inventory. Neuropsychologia. 1971;9:97–113. doi: 10.1016/0028-3932(71)90067-4. [DOI] [PubMed] [Google Scholar]
- 108.Oliveras R, Montiel J, Aboitiz F. Species differences and similarities in the fine structure of the mammalian corpus callosum. Brain, Behavior and Evolution. 2001;57:98–105. doi: 10.1159/000047229. [DOI] [PubMed] [Google Scholar]
- 109.Aboitiz F, et al. Fiber composition of the human corpus callosum. Brain Research. 1992;598:143–153. doi: 10.1016/0006-8993(92)90178-c. [DOI] [PubMed] [Google Scholar]
- 110.Aboitiz F, Lopez J, Monitel J. Long distance communication in the human brain: timing constraints for inter-hemispheric synchrony and the origin of brain lateralization. Biological Research. 2003;36:89–99. doi: 10.4067/s0716-97602003000100007. [DOI] [PubMed] [Google Scholar]
- 111.Hopkins WD, Cantalupo C. Theoretical speculations on the evolutionary origins of hemispheric specialization. Current Direction in Psychological Science. 2008;17:233–237. [Google Scholar]
- 112.Hopkins WD, et al. Parental and perinatal factors influencing the development of handedness in captive chimpanzees. Developmental Psychobiology. 2006;48:428–435. doi: 10.1002/dev.20165. [DOI] [PMC free article] [PubMed] [Google Scholar]
- 113.Medland SE, et al. Genetic influences on handedness: Data from 25,732 Australian and Dutch twin families. Neuropsychologia. 2009;47:33–337. doi: 10.1016/j.neuropsychologia.2008.09.005. [DOI] [PMC free article] [PubMed] [Google Scholar]
- 114.Warren DM, et al. Heritability and linkage analysis of hand, foot and eye preference in Mexican Americans. Laterality. 2012;11:508–524. doi: 10.1080/13576500600761056. [DOI] [PubMed] [Google Scholar]
- 115.Hopkins WD, Adams MJ, Weiss A. Estimating heritability in handedness in chimpanzees (Pan troglodytes) Nature Communications. in review. [Google Scholar]
- 116.Johnson-Frey SH. The neural basis of complex tool use in humans. Trends in Cognitive Sciences. 2004;8:71–78. doi: 10.1016/j.tics.2003.12.002. [DOI] [PubMed] [Google Scholar]
- 117.Whiten A, et al. Cultures in chimpanzees. Nature. 1999;399:682–685. doi: 10.1038/21415. [DOI] [PubMed] [Google Scholar]
- 118.Gil-da-Costa R, et al. Species-specific calls activate homologs of Broca’s and Wernicke’s areas in the macaque. Nature Neuroscience. 2006;9:1064–1070. doi: 10.1038/nn1741. [DOI] [PubMed] [Google Scholar]
- 119.Poremba A, et al. Species-specific calls evoke asymmetric activity in the monkey’s temporal poles. Nature. 2004;427:448–451. doi: 10.1038/nature02268. [DOI] [PubMed] [Google Scholar]
- 120.Taglialatela JP, et al. Communicative signaling activates “Broca’s” homologue in chimpanzees. Current Biology. 2008;18:343–348. doi: 10.1016/j.cub.2008.01.049. [DOI] [PMC free article] [PubMed] [Google Scholar]
- 121.Taglialatela JP, et al. Visualizing vocal perception in the chimpanzee brain. Cerebral Cortex. 2009;19:1151–1157. doi: 10.1093/cercor/bhn157. [DOI] [PMC free article] [PubMed] [Google Scholar]
- 122.Hopkins WD, et al. Cortical representation of lateralized grasping in chimpanzees (Pan troglodytes): A combined MRI and PET study. PlosOne. 2010;5:1–10. doi: 10.1371/journal.pone.0013383. [DOI] [PMC free article] [PubMed] [Google Scholar]
- 123.Pujol J, et al. The lateral asymmetry of the human brain studied by volumetric magnetic resonance imaging. NeuroImage. 2002;17:670–679. [PubMed] [Google Scholar]
- 124.Bogart SL, et al. Termite fishing laterality in the Fongoli savanna chimpanzees (Pan troglodytes verus): Further evidence of a left hand preference. Am J Phys Anthropol. 2012;149:591–598. doi: 10.1002/ajpa.22175. [DOI] [PubMed] [Google Scholar]
- 125.Biro D, Sousa C, Matsuzawa T. Ontogeny and cultural propagation of tool use by wild chimpanzees at Bossou, Guinea: Case studies in nut cracking and leaf folding. In: Matsuzawa T, Tomonaga T, Tanaka M, editors. Cognitive development of chimpanzees. Springer; New York: 2006. pp. 476–507. [Google Scholar]
- 126.Biro D, et al. Cultural innovation and transmission of tool use in wild chimpanzees: Evidence from field experiments. Animal Cognition. 2003;6:213–223. doi: 10.1007/s10071-003-0183-x. [DOI] [PubMed] [Google Scholar]
- 127.Humle T, Matsuzawa T. Laterality in hand use across four tool use behaviors among the wild chimpanzees of Bossou, Guinea, West Africa. American Journal of Primatology. 2009;71:40–48. doi: 10.1002/ajp.20616. [DOI] [PubMed] [Google Scholar]