

Abstract
Tumor necrosis factor related apoptosis-inducing ligand (TRAIL) induces apoptosis specifically in tumor cells and its efficacy has been tested in pre-clinical models by delivering it systemically as a purified ligand or via engineered stem cells (SC). However, about 50% of tumor lines are resistant to TRAIL and overcoming TRAIL resistance in aggressive tumors, such as glioblastoma-multiforme (GBM), and understanding the molecular dynamics of TRAIL-based combination therapies are critical to broadly use TRAIL as a therapeutic agent. In this study, we developed death receptor (DR)4/5-reporters that offer an imaging-based platform to identify agents that act in concert with a potent, secretable variant of TRAIL (S-TRAIL) by monitoring changes in DR4/5 expression. Utilizing these reporters, we show a differential regulation of DR4/5 when exposed to a panel of clinically relevant agents. A histone deacetylase inhibitor, MS-275, resulted in upregulation of DR4/5 in all GBM cell lines, and these changes could be followed in real time both in vitro and in vivo in mice bearing tumors and they correlated with increased TRAIL sensitivity. To further assess the dynamics of combinatorial strategies that overcome resistance of tumors to SC released S-TRAIL, we also engineered tumor cells to express live-cell caspase-reporters and SCs to express S-TRAIL. Utilizing DR4/5 and caspase reporters in parallel, we show that MS-275 sensitizes TRAIL-resistant GBM cells to stem cell (SC) delivered S-TRAIL by changing the time-to-death in vitro and in vivo. This study demonstrates the effectiveness of a combination of real-time reporters of TRAIL-induced apoptosis pathway in evaluating the efficacy of SC-TRAIL-based therapeutics and may have implications in targeting a broad range of cancers.
Keywords: live-cell imaging, DR4/5, TRAIL, GBM, neural stem cell, dual luciferase imaging
INTRODUCTION
Glioblastoma-multiforme (GBM) is a very aggressive brain tumor, with a median survival of only 15 months after diagnosis.1 Poor delivery of therapeutics to the disease site and the resistance of tumor cells to different therapeutics are among the major obstacles to successful anti-GBM therapies. Tumor necrosis factor related apoptosis-inducing ligand (TRAIL) has emerged as a prime candidate for the treatment of several cancers because of its ability to induce apoptosis in a tumor-specific manner.2 Both soluble recombinant human TRAIL ligand (Apo2L/TRAIL/ dulanermin), and TRAIL receptor agonist monoclonal antibodies (mapatumumab, lexatumumab), have shown promise in pre-clinical studies of solid tumors and are currently being evaluated in clinical trials.2 Although these systemically delivered agents have clinical potential, their utility and broad applicability is likely limited by several factors, such as: (a) the difficulty of delivering sufficient TRAIL or agonist antibodies to tumors while minimizing toxicity; (b) the short biological half-life and rapid clearance of recombinant TRAIL, requiring repeated administration; and (c) insensitivity of many tumors to TRAIL receptor activation with ligand or antibodies.
TRAIL induces apoptosis by binding to death receptors 4 (DR4) and 5 (DR5), leading to formation of death inducing signaling complexes and activation of initiator and effector caspases (Caspases 8 and 10, and 3 and 7, respectively).3 We have shown that both neural stem cells (NSCs) and mesenchymal SCs can be engineered to express TRAIL at high levels without themselves being killed and have extensive migratory capacity towards GBMs.4,5 In mouse models, on-site delivery of S-TRAIL by stem cells (SC) has substantial efficacy in solid and invasive GBM5–7 suggesting superior delivery of SC-S-TRAIL compared with systemically delivered TRAIL. Real-time in vitro and in vivo analysis that allow identification of therapies that prime TRAIL-resistant GBMs to SC-S-TRAIL and also a thorough understanding of the dynamics of combinatorial strategies that overcome resistance of tumors to SC-S-TRAIL are crucial for development of broadly effective TRAIL-based therapies.
In this study, we assessed the dynamics of apoptosis in GBM cells in response to NSC-TRAIL using live-cell reporters of caspases in GBM-NSC co-culture systems. To target a broad spectrum of GBMs, we developed optical imaging-based DR4/5-reporters to identify small molecule activators of TRAIL receptor expression and assess the ability of these agents to combine with SC-TRAIL in killing GBMs in vitro and in vivo.
RESULTS
GBM cells exhibit differential responses to TRAIL in vitro, in co-cultures and in vivo
To demonstrate heterogeneity in the TRAIL response by GBMs, we utilized three GBM lines, Gli36-EvIII, U251 and LN229, that have varying sensitivity/resistance to TRAIL (Figure 1a) and developed GBM-NSC co-cultures where S-TRAIL (from here on called TRAIL) was continuously secreted by NSCs in the vicinity of tumor cells. GBM cells were engineered to express firefly luciferase (Fluc) and mCherry (herein referred as GBM-FmC) and NSCs were engineered to express fluorescent markers of cell identity (GFP) or TRAIL coupled to an IRES-GFP, using bicistronic lentiviral vectors (Supplementary Table 1; Supplementary Figures S1a and b). Co-culturing GBM cells (as monolayers) and NSCs (as neurospheres) revealed that neurospheres first attach to the GBM monolayers, and individual NSCs then disseminate towards the GBM cells, closely mimicking their in vivo migratory behavior (Supplementary Video 1). Real-time imaging of these co-cultures demonstrated that NSC-TRAIL-induced death of Gli36-EvIII-FmC and U251-FmC cells, but not of LN229-FmC cells (Figure 1b; Supplementary Video 2; Supplementary Figure S1c). Consistent with these observations, the viability of Gli36-EvIII-FmC and U251-FmC cells, but not of LN229-FmC cells, was markedly reduced in NSC-TRAIL co-cultures as measured by their Fluc activity (Figure 1c). AnnexinV staining on GBM cells showed that TRAIL-sensitive Gli36-EvIII and U251 exhibited significantly more AnnexinV positivity than TRAIL-resistant LN229 cells when treated with TRAIL released by NSCs (Figure 1d). To further assess whether the death of TRAIL-sensitive GBM cells induced by NSC-TRAIL was apoptosis mediated, we engineered TRAIL-sensitive GBM lines to express a mitochondrial outer membrane permeabilization live-cell reporter in which the mitochondrial import sequence of SMAC/DIABLO was fused to red fluorescent protein (RFP)8 (Supplementary Figure S2a). Engineered Gli36-EvIII and U251 displayed typical apoptotic morphology and showed diffusion of RFP from mitochondria to cytoplasm at the time of apoptotic cell death when co-cultured with NSC-TRAIL (Supplementary Figures S2b–d).
Figure 1.

GBM cell lines exhibit differential responses to TRAIL correlated with their death-receptor expression levels. (a) Cell viability showing the effect of 24 h S-TRAIL treatment (0–1000 ng/ml) as measured by CellTiterGlo assay (*denotes P<0.005, Student’s t-test). (b) Representative snapshots from Gli36-EvIII-FmC cells (top panels), U251-FmC cells (middle panels) or LN229-FmC cells (bottom panels) co-cultured with NSC-GFP or NSC-TRAIL (green) from live-cell imaging of 54 h. (c) Viability of GBM lines co-cultured with NSCs as measured by their Fluc activity on day 3 (*denotes P<0.01, Student’s t-test). (d) AnnexinV analysis of TRAIL-induced apoptosis in Gli36-EvIII-Fmc, U251-FmC and LN229-FmC cells treated for 16 h. The percent AnnexinV-positive cells are indicated on the histogram graphs. (e) Representative pseudocolor bioluminescence images and the quantification of the Fluc activity of mice implanted with a mixture of GBM cells (Gli36-EvIII-FmC, U251-FmC and LN229-FmC) and NSCs (NSC-GFP or NSC-TRAIL) (n =3/group). (f) Quantitative RT–PCR analysis of DR4 and DR5 expression across three GBM lines. (g) Western blot analysis of DR4 and DR5 protein levels across 3 GBM lines.
To also measure the differences of TRAIL response of GBM cells in vivo, Gli36-EvIII-FmC, U251-FmC and LN229-FmC tumors were established in mice. Despite the efficacy of purified TRAIL in vitro, a side-by-side comparison of systemically delivered TRAIL and NSC-TRAIL showed that the recombinant ligand did not have a significant effect on the volumes of even TRAIL-sensitive Gli36-EvIII-FmC xenografts, but intratumoral implantation of NSC-TRAIL significantly reduced tumor volumes and was well-tolerated (Supplementary Figure S3). U251-FmC tumors also exhibited a significant reduction in tumor volumes when exposed to NSC-TRAIL but LN229-FmC tumors did not shrink implying that they were resistant to NSC-TRAIL in vivo (Figure 1e). Quantitative RT–PCR and western blot analyses revealed a correlation between the TRAIL sensitivity and DR4 and DR5 expression across the three cell lines tested (Figures 1f and g). These results show that NSC-mediated delivery of TRAIL is potent in inducing apoptosis in TRAIL-sensitive GBM cells and that the extent of apoptosis is correlated with endogenous DR4 and DR5 expression levels among the GBM lines.
Imaging of death-receptor expression levels identifies modulators of TRAIL sensitivity
To further investigate the link between DR4 and DR5 levels and the TRAIL responsiveness of GBM cells, we engineered lentiviral-based DR4/DR5 promoter-Fluc and RlucDsRed2 reporters that simultaneously allow real-time monitoring of DR4/5 expression and tumor cell viability in vitro and in vivo. We generated GBM lines (Supplementary Table 1; hereafter GBM-pDR4-Fl-CMV-RlD and GBM-pDR5-Fl-CMV-RlD, respectively) in which differing DR4/5 expression levels were monitored by Fluc activity relative to Rluc and DsRed2 (which served as viability markers): Gli36-EvIII cells had the highest DR4 and DR5 expression and LN229 cells the lowest (Figures 2a and b), consistent with their endogenous DR4 and DR5 expression (Figures 1f and g). To identify reagents that have the ability to increase DR4 or DR5 expression and thereby had the potential to increase the responsiveness of GBM cells to TRAIL, we established a screen using GBM-pDR4-Fl-CMV-RlD and GBM-pDR5-Fl-CMV-RlD cells and a small panel of compounds currently in pre-clinical and clinical use. We chose reagents that target a wide range of pathways and possess diverse therapeutic mechanisms.9–16 These compounds included the EGFR inhibitors Cetuximab and Erlotinib; HDAC inhibitor MS-275; dual PI3K/mTOR inhibitor PI-103; C-Met inhibitor PHA665752; DNA alkylating agent Temozolomide; DNA intercalating agent Doxorubicin; and TRAIL itself (Figures 2c and d). Upon exposure to these compounds, a significant increase in pDR4 levels (1.14–2.54 fold of controls; Figure 2c) and pDR5 levels (1.10–3.14 fold of controls; Figure 2d) was observed, although levels of pDR4 and pDR5 were not always correlated. MS-275 was the most effective agent in increasing receptor expression and resulted in upregulation of both pDR4 and pDR5 in all three lines (~2.4, 2.5 and 1.8-fold of pDR4 and 1.8, 1.5 and 3.1-fold of pDR5 activity in Gli36-EvIII, U251 and LN229 cells, respectively). Western blot analysis on U251 cells exposed to MS-275 further validated changes in DR4 and DR5 expression at the protein level (Figure 2e). Flow cytometry analysis indicating the surface expression of DR4 and DR5 showed marked changes in DR5 levels upon MS-275 exposure, and not in the DR4 levels (Figure 2f) probably due to the low endogenous expression of DR4. Taken together, these results demonstrate that the DR4/DR5 reporter system, which allows monitoring of DR4/5 expression and cell viability simultaneously, reflects the basal DR4 and DR5 expression levels in GBM cells and can further be utilized to identify modulators of DR activity, such as MS-275, that have the potential to sensitize GBM cells to TRAIL-induced apoptosis.
Figure 2.
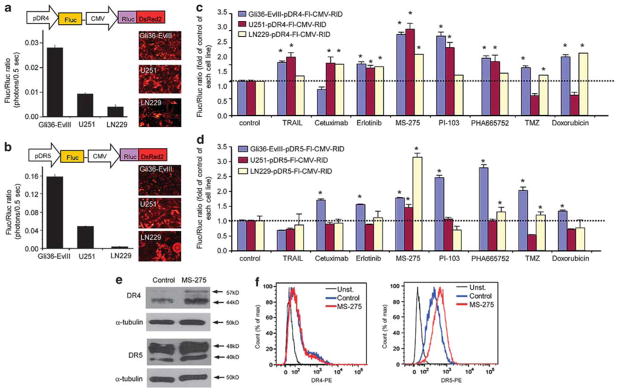
Dual bioluminescence imaging of death-receptor expression levels identify modulators of TRAIL sensitivity. (a, b) Top: schematic representation of polycistronic lentiviral vectors that measure DR4 (a) and DR5 (b) promoter activity (Fluc) in relation to cell viability (Rluc). Bottom: plot showing the relative DR4 (a) and DR5 (b) promoter activity (shown by Fluc/Rluc ratio) across three GBM lines with varying sensitivity to TRAIL. Representative photomicrographs depicting DsRed2 expression (red). (c, d) Plot showing the effects of chemotherapeutic drugs on the DR4 (c) and DR5 (d) promoter activity across three GBM lines (Gli36-EvIII-pDR4/5-Fl-CMV-RlD, U251-pDR4/5-Fl-CMV-RlD, LN229-pDR4/5-Fl-CMV-RlD). Effects of 24 h treatment with S-TRAIL (100 ng/ml), Cetuximab (1 μM), Erlotinib (1 μM), MS-275 (2.5 μM), PI-103 (1 μM), PHA665752 (1 μM), Temozolomide (TMZ, 500 μM) and Doxorubicin (200 nM) are measured by the fold changes in the Fluc/Rluc ratio compared with control treatment for each cell line. (e) Western blot analysis of DR4 and DR5 expression in U251 cells treated with MS-275 (2.5 μM). (f) Histograms showing cell surface levels of DR4 and DR5 in U251 cells treated with MS-275 (2.5 μM) and measured using PE-conjugated DR4 or DR5 antibodies.
Live-cell imaging with apoptosis reporters demonstrates the dynamics of TRAIL-induced GBM cell apoptosis and TRAIL sensitization
In addition to correlating the differences of TRAIL response with DR4/5 expression, we sought to understand how combinatorial strategies can prime tumor cells for execution of TRAIL-induced apoptosis. We focused on MS-275 and tested its ability to alter apoptotic response in GBM cells. The priming effect of MS-275 was evident in its ability to augment the response of GBM cells to TRAIL as measured by caspase-3/7 assays (Figures 3a–c), western blot analysis of caspase-8 and cleaved PARP (Figure 3d) and subsequent changes in cell viability (Supplementary Figure S4). MS-275 treatment alone did not have a direct effect on the AnnexinV positivity of GBM cells, but it markedly increased the AnnexinV positivity induced by TRAIL in intermediate TRAIL-sensitive U251 GBM cells (Figure 3e) and to a lesser extent in TRAIL-resistant LN229 GBM cells (Supplementary Figure S5).
Figure 3.

Live-cell imaging with apoptosis reporters reveals the dynamics of TRAIL-induced GBM cell apoptosis and MS-275-mediated TRAIL sensitization. (a–c) Caspase-3/7 assays showing the combined effect of MS-275 and TRAIL treatment on GBM cells with MS-275 (5 μM) and S-TRAIL (0–1000 ng/ml) (*denotes P<0.001, Student’s t-test). (d) Western blotting showing changes in Caspase-8 activation and PARP cleavage or upon 24 h treatment with MS-275 (2.5 μM) or control followed by S-TRAIL (100 ng/ml) or control treatment in GBM cells (6 h TRAIL treatment for Gli36-EvIII and U251; 24 h TRAIL treatment for LN229 cells). (e) AnnexinV/PI analysis of apoptosis in U251 cells treated with MS-275 (2.5 μM), S-TRAIL (100 ng/ml) or both MS-275 and TRAIL for 16 h. The percent AnnexinV-positive cells are indicated on the histogram graphs. Insets: dot plots of PI and AnnexinV positivity for each condition. (f) Representative snapshots of U251-ECRP cells (CFP images of 6 h intervals) treated with MS-275 alone (2.5 μM) or in combination with TRAIL (200 ng/ml). (g) Representative FRET trajectories of ECRP cleavage of U251-ECRP cells shown in (e). Data presented as CFP/YFP ratio of ECRP reporter at 4 min intervals for 18 h. (h) Plot showing the mean time of death of U251-ECRP cells shown in B (n =80 for control; n =70 for MS-275; n =69 for TRAIL; n =65 for MS-275 and TRAIL). N/D: not detected (*denotes P<0.05, Student’s t-test). (i) Plot showing the percent number of U251-ECRP cells that are alive at 18 h shown in (e).
While these end-point assays provide information about the overall effect of TRAIL-based combinatorial approaches, they are unable to provide a thorough assessment of apoptosis at a single cell level. To further characterize the real-time dynamics of apoptosis, we engineered GBM lines to express a fluorescent reporter of effector caspase-3/7 activation, in which the Forster resonance energy transfer (FRET) donor-acceptor pair CFP and YFP are linked by caspase cleavage sequence-DEVDR (ECRP) (Supplementary Table 1; Supplementary Figure S6a).17 On the basis of our data from end-point assays, we first chose U251 cells, an intermediate TRAIL-sensitive line. We engineered U251 cells with ECRP to study the timing of caspase activation (U251-ECRP) (Supplementary Figure S6b). Live-cell microscopy of U251-ECRP cells exposed to TRAIL revealed a delay of up to 10–12 h followed by a sudden change in CFP/YFP ratio concomitant with morphological manifestations of death, which was dose dependent exhibiting an inverse relationship between the fraction of cells killed and the mean interval before caspase activation (Supplementary Figures S6b–d). Combined exposure of U251-ECRP cells to MS-275 and TRAIL caused a significant increase in the level of cell death (Figure 3f); shortened time-to-death (Figure 3h) and decreased the percentage of surviving cells (Figure 3i) as compared with treatment with MS-275 or TRAIL alone. Representative FRET trajectories for the ECRP also revealed the shorter interval before caspase activation with the MS-275 and TRAIL treatment in combination (Figure 3g; Supplementary Videos 3 and 4). Taken together, live-cell imaging of apoptosis reporters in GBMs demonstrates the dynamics of TRAIL response and MS-275 induced TRAIL sensitization at a single cell level.
Live-cell imaging of GBM cell response to SC delivered TRAIL in GBM-NSC co-cultures reveals the efficacy of MS-275 in sensitizing TRAIL-resistant tumors
Next, we examined the dynamics of caspase activation in NSC-GBM co-cultures, in which TRAIL is continuously secreted by NSCs in the vicinity of tumor cells. We generated additional NSC lines that express red markers of cell identity (NSC-mCh and NSC-TRAIL that co-expresses IRES-mCherry; Supplementary Table 1; Supplementary Figure S7a). We observed a time-dependent accumulation of TRAIL in NSC-GBM co-cultures revealing the sustained release of TRAIL from NSCs (Figure 4a). Live-cell imaging of caspase activation in GBM-ECRP-NSC co-cultures revealed a significant reduction in GBM cell viability, which was also evident by trajectories in FRET signal and time-to-death in the presence of NSC-TRAIL (Supplementary Figures S7b–d). In these settings, Gli36-EvIII-ECRP and U251-ECRP cells exhibited markedly shorter time-to-death and increased probability of death as compared with the more resistant LN229-ECRP cells (Figure 4b). To determine whether MS-275 would sensitize these highly resistant cells to NSC-TRAIL, we established co-cultures of LN229-ECRP cells and NSCs (Figure 4c; Supplementary Videos 5 and 6). Although fewer than 10% of LN229 cells underwent apoptosis in the presence of NSC-TRAIL, adding MS-275 and NSC-TRAIL together increased the apoptotic cell number to 50% after 24 h (Figure 4d); enhanced killing of these cells was further confirmed by changes in FRET trajectories in the MS-275 and NSC-TRAIL-treated group (Figure 4e). Importantly, MS-275 treatment did not have a significant effect on the viability of NSC when assayed in co-culture experiments or with MS-275 alone (Supplementary Figure S8). We conclude that MS-275 cooperates with NSC-TRAIL in co-culture experiments to overcome TRAIL resistance in non-responsive lines, such as LN229.
Figure 4.

Live-cell imaging of GBM cell response to SC delivered TRAIL in NSC-GBM co-cultures shows the MS-275-mediated TRAIL sensitization in a TRAIL-resistant GBM cell line. (a) Plot showing the concentration of TRAIL secreted by NSC-TRAIL or NSC-control in NSC-GBM co-cultures during 48 h, as determined by ELISA. (b) Plot showing the mean time of death of GBM-ECRP co-cultured with NSC-TRAIL over 24 h (n =60 for Gli36-EvIII-ECRP; n = 16 for U251-ECRP; n =67 for LN229-ECRP). Top labels denote the percent cell survival for each cell line at 24 h. (*Denotes P<0.001, Student’s t-test). (c) Representative snapshots of the LN229-ECRP cells (CFP: cyan, YFP: green) and NSC-mCh or NSC-TRAIL cells (red) in co-cultures in the presence/absence of MS-275 (2.5 μM) over 24 h. (d) Plot showing the percent number of surviving LN229-ECRP cells at 24 h. (e) Representative FRET trajectories of LN229-ECRP cells co-cultured with NSC-TRAIL and treated with MS-275. Data presented as CFP/YFP ratio of ECRP reporter at 9 min intervals for 24 h.
DR4 and DR5 reporters allow for the imaging of time-dependent changes in DR4/5 expression in TRAIL-resistant tumors in vitro and in vivo
To test the timing of DR4/5 induction in TRAIL-resistant GBMs, we analyzed pDR4 and pDR5 activities in LN229 cells. Treatment of LN229-pDR4-Fl-CMV-RlD and LN229-pDR5-Fl-CMV-RlD reporter lines with MS-275 resulted in a dose- and time-dependent upregulation of pDR4 and pDR5 (Figures 5a and b) activity. Similar changes in endogenous mRNA levels were observed by quantitative RT–PCR (Figure 5c). Western blot analysis further revealed changes in total protein expression levels of DR4 and DR5 upon MS-275 treatment (Figures 5d and e). However, flow cytometry analysis did not show such marked changes in the surface expression of DR4 and DR5 upon MS-275 exposure, probably because of the low endogenous expression of each receptor (Supplementary Figure S9). To test the effect of MS-275 on DR4/5 expression in vivo, we established tumors with LN229-pDR4-Fl-CMV-RlD and LN229-pDR5-Fl-CMV-RlD cells in mice and administered MS-275 systemically. Sequential dual luciferase imaging of DR4/5 promoter activity (as assessed by Fluc intensity) and changes in tumor volumes (as assessed by Rluc imaging) was performed before or following MS-275 administration (Figure 5f). Under these conditions, pDR4 and pDR5 reporter activities increased significantly with MS-275 as compared with vehicle controls (Figure 5g). Similar changes in pDR5 reporter activities were observed in Gli36 and U251 tumor lines in vivo (Supplementary Figure S10). Quantitative RT–PCR on tumor tissues confirmed that DR4 and DR5 mRNA levels rose 2–5 fold following MS-275 administration (Figure 5h). Taken together, DR4/5-reporters allow for the imaging of receptor upregulation, which provides the time window for TRAIL sensitization for potential combination therapies in vivo.
Figure 5.

DR4 and DR5 reporters allow for the imaging of time-dependent changes in DR4/5 expression in TRAIL-resistant tumors in vitro and in vivo. (a, b) Assessment of DR4 (a) or DR5 (b) promoter activity in response to MS-275 (0–5 μM) in LN229-pDR4/5-Fl-CMV-RlD cells at 5, 24 or 48 h after treatment. (c) Quantitative RT–PCR analysis of DR4 and DR5 expression in response to MS-275 (5 μM) treatment for 24 h in LN229 cells. (d, e) Western blot analysis of DR4 (d) and DR5 (e) expression in response to MS-275 (5 μM) treatment for 24 h in LN229 cells. (f) Description of the experimental plan. Mice with TRAIL-resistant LN229-pDR4-Fluc-CMV-RlucDsR2 or LN229-pDR5-Fl-CMV-RlD tumors were treated i.p. with 10 mg/kg MS-275 or vehicle for 4 days and Fluc and Rluc activity were measured. (g) Top: representative BLI images of Fluc and Rluc signal. Bottom: plot showing the quantitation of Fluc/Rluc activity. Data are presented as Fluc/Rluc ratio as fold of day 0 (n =2 tumors/group). (h) Quantitative RT–PCR analysis of DR4 and DR5 expression in LN229 tumors extracted from vehicle- or MS-275-treated mice (n =6 tumors/group).
Combination of MS-275 and SC-delivered TRAIL reveals efficacy in TRAIL-resistant GBMs in vivo
Based on the MS-275-mediated upregulation of DR4 and DR5 in vivo, we aimed to test the effect of NSC-TRAIL on TRAIL-resistant tumors following MS-275 administration (Figure 6a). To determine the effect of MS-275 on the TRAIL sensitivity of LN229-FmC tumors in vivo, we performed two sets of experiments. First, tumor cells pre-treated with MS-275 were implanted, and treated with a single injection of NSC-TRAIL (Figure 6b). A significant reduction in tumor volumes was observed with MS-275 and NSC-TRAIL as compared with control tumors treated with NSC-TRAIL alone (Figure 6b). Second, mice bearing established LN229-FmC tumors were administered MS-275 periodically and implanted with NSC-TRAIL (Figure 6c). A significant decrease in tumor volumes was observed as compared with vehicle and NSC-GFP/TRAIL treatment in combination with an inert vehicle (Figure 6c). Immunofluorescent analysis of tumor sections showed that mCherry labeled tumor cells were in close association with TRAIL expressing NSCs (GFP) in the tumors (Figure 6d). Moreover, significantly higher number of cleaved caspase-3 positive tumor cells was observed in the presence of the MS-275 than in parallel controls (Figures 6e and f). Taken together, our results show that MS-275 and NSC-TRAIL combination therapy reveals efficacy in TRAIL-resistant GBMs in vivo.
Figure 6.

MS-275 sensitizes TRAIL-resistant GBM lines to SC delivered TRAIL in vivo. (a) Schematic of the rationale for the experimental approach in (b) and (c). (b) Top: description of the experiment. LN229-FmC cells, treated with MS-275 (5 μM), were admixed with NSCs (GFP or TRAIL) for implantation. Bottom: representative BLI images and quantitation of Fluc activity showing the effect of MS-275 and NSC-TRAIL on LN229 cells in mice on day 4 post implantation (n =3 tumors/group; *denotes P<0.05, t-test). (c) Top: description of the experiment. Bottom: established LN229-FmC tumors were administered MS-275 or vehicle i.p. daily for 4 days followed by NSC-TRAIL or control NSC-GFP implantation intratumorally. Representative BLI images and quantitation of the combined effect of MS-275 and NSC-TRAIL on TRAIL-resistant LN229 tumor growth (day 10) as fold of day 0 (n =5 tumors/group; *denotes P<0.05, t-test). (d) Fluorescent images of tumor sections showing the presence of NSC (green) in LN229-FmC (red) tumors. (e, f) mCherry fluorescent (red) and cleaved caspase-3 immunofluorescent (blue) images in tumor sections (e) and quantification of cleaved caspase staining in NSC-GFP, NSC-TRAIL or MS-275 +NSC-TRAIL groups (f).
DISCUSSION
In this study, we describe the development of DR4/5-reporters that offer an imaging-based screening platform to identify agents that can act in concert with SC-TRAIL in vitro and allow the monitoring of DR4/5-involved TRAIL sensitization in vivo. We also demonstrate the use of live-cell caspase reporters to assess the effects of identified agents, such as MS-275, on the SC-TRAIL response of GBM cells at a single cell level. Thoroughly addressing the dynamics of such combinatorial strategies that overcome resistance of tumors to TRAIL, we reveal the marked efficacy of MS-275 and SC delivered TRAIL in TRAIL-resistant GBMs in vitro and in vivo.
Activating apoptosis on tumor cells is a favorable approach to cancer treatment as it has the potential to induce tumor regression as opposed to keeping tumor growth under control, a common end point of anti-mitogenic drugs.18 Although, both soluble recombinant human TRAIL protein and DR4/DR5 agonist monoclonal antibodies are currently being evaluated in clinical trials,2 it appears that many TRAIL therapies are experiencing difficulties in Phase I/II trials and to our knowledge, no pivotal Phase III trials are currently underway. We have previously established an alternative method of TRAIL delivery involving engineered stem cells, which are known to home to tumors and thereby serve as a localized delivery vehicle for anti-tumor biomolecules.5 Our recent studies utilizing genetically engineered fusions of TRAIL with imaging agents, have demonstrated the superior pharmacokinetic properties of SC delivered TRAIL as compared with systemically administered soluble TRAIL.6 In this study, we assessed the efficacy and in vivo utility of SC-TRAIL compared with systemically delivered TRAIL and then focused on three primary issues: (1) analysis of the variable apoptotic responses of GBM cells to TRAIL; (2) identifying small molecules that sensitize GBM cells to SC-TRAIL by increasing expression of DR4 or DR5; and (3) analysis of DR4 and DR5 modulation and subsequent TRAIL sensitization with combination therapies in resistant GBMs.
Tumor cells have a varying response to TRAIL-mediated killing, for reasons that remain partly understood. Our selected GBM lines displayed heterogeneity in their TRAIL response, which was assessed by end-point viability and apoptosis assays as well as live-cell apoptosis measurements in GBM-NSC co-cultures and in GBM xenografts. In an effort to develop broadly applicable SC delivered TRAIL therapies, understanding the mechanisms of TRAIL response and identifying new agents that overcome TRAIL resistance are critical. Several reports suggest that the levels of DR4 and DR5 receptors constitute one important factor in TRAIL sensitivity.19 In the subset of GBM cell lines we examined in this study, sensitivity to SC delivered TRAIL correlated with levels of DR4 and DR5 expression, consistent with the previous reports.20 While DR4 and DR5 expression levels are not the sole determinants of TRAIL responsiveness, several TRAIL-sensitizing agents have been reported to act mainly by upregulating DR expression.21–29 Based on this knowledge, in this study, we generated DR4 and DR5 expression reporters as a means to monitor endogenous DR4 and DR5 expression levels and to select reagents that can act in concert with TRAIL by directly modulating DR expression. In our DR4/5 imaging-based screen with a small panel of clinically relevant molecules, we show that the HDAC inhibitor (HDACi), MS-275, as a very potent agent in upregulating DR4 and DR5 expression in all GBM cell lines, including the TRAIL-resistant LN229 cells and sensitizing them to NSC-TRAIL-mediated apoptosis both in vitro and in vivo. Our finding of MS-275 effect on TRAIL sensitization is consistent with other reports showing the cooperation of HDAC inhibitors and TRAIL.30–32 It has also been reported that MS-275 can directly modulate the acetylation status of histones 3 and 4 of the DR promoters and facilitate the reversal of aberrant DR4/5 gene silencing.33 Although the MS-275-induced TRAIL sensitization involves DR4/5 modulation as one mechanism, it is still possible that MS-275 might also influence downstream effectors or modulators of the apoptotic cascade. Therefore, it will be of high importance to assess these mechanisms of TRAIL-sensitization mediated by molecules identified through our DR4/5 reporter system.
Our characterization of MS-275 serves as an example of how such a reagent can be identified and utilized by directly assessing DR4 and DR5 expression levels, and provides a potent combination therapy for TRAIL-resistant GBMs. Based on its ability to track cell viability and DR4/5 regulation simultaneously by dual bioluminescence, our DR4/5 reporter system can further be utilized in a high-throughput manner. This might offer another means to find novel TRAIL sensitizers similar to the few high-throughput screens conducted previously.34,35 Another advantage that our DR4/5 reporter system offers is the in vivo dual bioluminescent imaging component. As shown in our TRAIL-resistant GBM xenografts, differential bioluminescent imaging of Fluc and Rluc activity allows simultaneous monitoring of DR4/5 expression and tumor volumes, respectively. The real-time monitoring of changes in DR4/5 promoter activity upon treatment with agents that upregulate DR4/5 and ultimately tumor volumes upon TRAIL treatment is critical in understanding combination therapies in TRAIL-resistant tumors in vivo.
The TRAIL-sensitizing ability of novel reagents identified through DR4/5-reporters should be validated by parallel or consecutive cell viability or caspase assays in the presence of TRAIL. To test the mechanism and efficacy of a TRAIL sensitizer in GBMs in this study, we utilized GBM-NSC co-cultures where TRAIL was continuously delivered in the vicinity of tumor cells in a sustained manner. Using a live-cell caspase reporter system that monitors the effector caspase activity in GBM-NSC co-cultures, we confirmed the apoptosis-augmenting effect of MS-275 in TRAIL-sensitive and -resistant GBM cells. Therefore, real-time imaging of tumor cell apoptotic response to SC-TRAIL with TRAIL-sensitizing agents might provide another means of assessment of TRAIL response in GBMs and other tumor types.
It will be of high interest to extend our observations to panels of primary GBM lines and different small molecule libraries to identify new compounds that primes TRAIL-resistant cells for NSC-TRAIL-induced apoptosis. It will also be significant to utilize similar strategies in other tumor types with varying TRAIL response. In conclusion, our study shows that the combination of two different imaging modalities can provide a detailed understanding of TRAIL response among tumor cell lines in real-time, the identification of modulators of TRAIL response, and imaging of all these events in vitro and in vivo.
MATERIALS AND METHODS
Cell lines
Gli36-EvIII (Gli36 expressing EGFRvIII, a constitutively active variant of EGFR), U251 and LN229 cells were cultured as described.36 Primary mouse cortical NSCs were obtained from Stem Cell Technologies (Vancouver, BC, Canada) and grown in NeuroCult basal medium (Stem Cell Technologies) supplemented with NeuroCult proliferation supplements, 60 ng/ml human EGF (R&D Systems, Minneapolis, MN, USA) and penicillin/streptomycin.
Reagents
Stocks of MS-275 (Cayman Chemicals, Ann Arbor, MI, USA), PI-103 (Cayman Chemicals), PHA665752 (Selleck Chemicals, Houston, TX, USA) and Temozolomide (Sequoia Research Products Ltd, Pangbourne, UK) were prepared in DMSO. Cetuximab (ImClone Systems Inc), Erlotinib (Genentech, San Francisco, CA, USA) and Doxorubicin (Novaplus, Bridgewater, NJ, USA) were supplied as ready-to-use. TRAIL was enriched from 293T cells transfected with LV-S-TRAIL as described.37
Engineered viral vectors and viral packaging
Four different types of viral vectors were used (Supplementary Table 1): (1) live-cell fluorescent reporters: ECRP, IMS-RP retroviral vectors were generated from MSCV-Puro backbone and packaged as described;38 (2) fluorescent and bioluminescent lentiviral vectors: Pico2-Fluc.mCherry, a kind gift from Dr Andrew Kung (Dana Farber Cancer Institute; Boston, MA, USA) was used to create bioluminescent and fluorescent tumor cells as described previously;36 (3) therapeutic lentiviral vectors: LV-S-TRAIL-IRES-GFP that bears S-TRAIL driven by the CMV promoter and contains an IRES-GFP cassette; control LV-GFP were used as described;36 IRES-GFP was replaced with IRES-mCherry cassette in the LV-S-TRAIL vector in order to generate LV-S-TRAIL-IRES-mCherry; and (4) lentiviral polycistronic bioluminescent DR4/DR5 reporters: pDR4-fluc-CMV-RlucDsRed2 and pDR5-fluc-CMV-RlucDsRed2 were subcloned from pGL3-Basic reporter constructs gifted by Dr Shi-Yong Sun (Emory University). Upstream − 1773/ +63 (pDR4) and − 1400 (pDR5) bp promoter sequence driving Fluc were first cloned into CSCGW-GFP to generate pDR4-fluc-CMV-GFP or pDR5-fluc-CMV-GFP by PCR amplification of 3.2 (pDR4-Fluc) of 3.0 (pDR5-Fluc) kb products using BamHIpDR4F and NsiIfFlucR primers designed for pGL3-Basic vector. Then, pDR5-fluc-CMV-RlucDsRed2 was generated by replacing GFP with RlucDsRed2 in pDR4-fluc-CMV-GFP vector using NheI/XhoI digestion of LV-RlucDsRed2.4 Next, pDR4-fluc-CMV-RlucDsRed2 was generated by BamHI/NheI partial digestion of pDR4-fluc-CMV-GFP insert and ligation into pDR5-fluc-CMV-RlucDsRed2 vector digested with BamHI/NheI. All lentiviral packaging was performed as previously described.4
Transduction of tumor cells and NSC
GBM cells were transduced with lentiviruses at a multiplicity of infection of two, and with retroviruses at MOI of three in medium containing protamine sulfate (10 μg/ml). All NSCs were dissociated and cultured as monolayers on laminin-coated (5 μg/ml) plates for 24 h and transduced at MOI of five. Populations of transduced cells were visualized by fluorescence microscopy for GFP, CFP, YFP, DsRed2, RFP or mCherry expression. GBM-ECRP cells were selected with puromycin and sorted for high expressors of CFP and YFP using FACSAria Ilu cell sorter (BD Biosciences, Bedford, MA, USA).
Co-cultures of NSC and GBM
GBM cells were seeded on 24-well (0.5 ×10⁵/well; Costar, St Louis, MO, USA) or 96-well (0.3 × 10⁵/well; Matrical Bioscience, Spokane, WA, USA) plates and grown to 80% confluence. NSCs (0.5 × 10⁵ cells/neurosphere) were added on top of GBM monolayers in NSC medium. Co-cultures were then analyzed by (a) live-cell imaging starting at 2 h after NSC addition; or by (b) bioluminescence imaging after 24–72 h. For combination experiments, GBM cells were treated with MS-275 (0–5 μM) before NSC addition.
Live-cell imaging and image analysis
GBM cells were grown on glass-bottom 96-well plates (Matrical Bioscience) for 24 h in complete medium. Before imaging, medium was replaced with phenol-red free DMEM supplemented with 0.2% FBS and penicillin–streptomycin. S-TRAIL (0–200 ng/ml) was added and time is depicted at t = 0. Cells were imaged at 37 °C on Nikon TE2000E Automated Inverted Microscope with perfect focus function, and temperature and CO2 control chamber using ×20 objective, as described.38 CFP, YFP, GFP, mCherry, RFP or phase images were acquired at 4 or 9 min intervals for 16–72 h. The loss in intramolecular FRET was monitored by the change in CFP/YFP ratio, measured using ImageJ software (NIH, Bethesda, MD, USA) with a custom-made plug-in, and plotted as trajectories as described.38 The time of death was determined based on apoptotic morphology and analyzed by ImageJ with a special plug-in. The percentage of cell survival was determined by counting the number of live cells/field in the beginning and end of the imaging. Time-to mitochondrial outer membrane permeabilization analysis was performed by measuring the time of localization change of the IMS-RP reporter from punctate to diffuse.
Dual bioluminescent imaging
For in vitro detection of promoter activities, D-Luciferin (Biotium, Hayward, CA, USA, 100 μg/ml) and coelenterazine (Nanolight, Pinetop, AZ, USA, 1 μg/ml) were added on 40 000 cells/well in 96-well plates (Costar) in triplicates and Fluc/Rluc ratio was determined. For drug treatments, cells were treated 24–72 h before measuring Fluc/Rluc ratio. For in vivo imaging of the reporters, mice bearing GBMs were first imaged for Rluc activity by administering i.p. coelenterazine (CaliperLS, Xenolight, Hopkinton, MA, USA), followed by Fluc measurement 6 h later as described.36 Data were analyzed by measuring Fluc to Rluc ratio at the beginning (day 0) and end of the experiment and presented as fold of day 0.
Cell viability/caspase assays and detection of apoptosis
The effects of TRAIL on GBM cell viability and caspase-3/7 activity were measured using CellTiterGlo and CaspaseGlo 3/7 (Promega, Madison, WI, USA) 24-h post treatment. For combination experiments, GBM cells were treated with MS-275 (0–5 μM) for 24 h before TRAIL treatment. All experiments were performed in triplicates. Apoptosis was determined by measuring AnnexinV positivity using dead cell apoptosis kit with Alexa488-AnnexinV and propidium iodide (PI) (Invitrogen, Carlsbad, CA, USA) according to manufacturer’s instructions. Flow cytometry was performed using FACSAria Ilu cell sorter and results were analyzed by FlowJo software (Flowjo, Ashland, OR, USA).
Western blotting and ELISA
Following sequential treatment with MS-275 and S-TRAIL (24 h) GBM cells were lysed with NP40 buffer supplemented with protease (Roche, Indianapolis, IN, USA) and phosphatase inhibitors (Sigma, St Louis, MO, USA). Thirty micrograms of harvested proteins from each lysate were resolved on 10% SDS–PAGE and immunoblotted with antibodies against Caspase-8 (Cell Signaling, Beverly, MA, USA), cleaved poly (ADP-ribose) polymerase (PARP) (Cell Signaling) or alpha-tubulin (Sigma); and detected by chemiluminescence after incubation with HRP-conjugated secondary antibodies. DR4 and DR5 total protein levels were determined using rabbit polyclonal antibodies DR4 (CT) and DR5 (CT), respectively (ProSci, Inc., Poway, CA, USA). Medium was collected from GBM-NSC co-cultures at 6 h intervals for 48 h and TRAIL secretion was quantified using enzyme-linked immunosorbent assay as described.39
Detection of cell surface DR4 and DR5
GBM cells treated with control (DMSO) or MS-275 (2.5 μM) for 16 h were collected with EDTA-based reagent Versene (Invitrogen) and stained with PE-conjugated anti-human DR4 (DJR1) or DR5 (DJR2-4) monoclonal antibodies (eBioscience, San Diego, CA, USA) in 0.5% BSA/PBS solution at 4 °C for 30 min. Rinses were performed with 0.5% BSA/PBS at 4 °C. Flow cytometry was performed using FACSAria Ilu cells sorter and results were analyzed by FlowJo software.
In vivo experiments
Five different types of in vivo experiments were performed. (1) Atyhmic nude female mice (3 weeks of age, Charles River Laboratories, Wilmington, MA, USA) were implanted with GBM-FmC cells (5 ×10⁶/mouse; n =3/ group) s.c. and TRAIL was administered systemically (daily i.p. injections) or as NSC-TRAIL implanted intratumorally. Mice were imaged for Fluc activity as described.7 (2) Mice were implanted with GBM-FmC cells (5 × 10⁶/ mouse; n = 3/group) s.c. in a 2:1 mixture of NSCs (GFP or TRAIL-GFP) and mice were imaged for Fluc activity as described.7 (3) To test the effect of MS-275 on DR4 and DR5 expression in vivo, mice were implanted with LN229-pDR4-Fl-CMV-RlD or LN229-pDR4-Fl-CMV-RlD cells and administered with 10 mg/kg of MS-275 in a mixture of DMSO/saline i.p. daily (n = 4/group). Mice were imaged for the presence of tumors (Rluc imaging) using coelenterazine followed by Fluc imaging (for promoter activity) using D-luciferin (Biotium) as described.4 (4) LN229-FmC cells were treated with MS-275 and implanted in a 2:1 mixture of NSC-GFP or NSC-TRAIL s.c. (n =3/group). Mice were imaged for Fluc activity as described.36 (5) LN229-FmC cells were implanted s.c. and mice were administered with 10 mg/kg of MS-275 for 4 days, followed by intratumoral implantation of NSC-GFP or NSC-TRAIL (2 ×10⁶/tumor, n = 5/group) and mice were imaged for Fluc activity as described.36 Mice were killed and s.c. tumors were dissected and processed for RT–PCR analysis and immunohistochemistry. All in vivo procedures were approved by the Subcommittee on Research Animal Care at Massachusetts General Hospital.
Quantitative RT–PCR
mRNA was extracted using PureLink RNA Kit (Ambion, Carlsbad, CA, USA) and cDNA was synthesized with Superscript VILO cDNA synthesis kit (Invitrogen, Carlsbad, CA, USA). SYBR Green and ABI Prism 7000 equipment (Applied Biosystems) were used for quantitative RT–PCR. The gene of interest value was normalized to the reference gene (GAPDH) value by taking the difference in their threshold cycle (Ct (ΔCt)) and the expression levels of each gene were reported as fold of control, such as 2^(ΔCtcontrol − ΔCtMS-275). The following primer pair sequences were used: DR4: forward, 5′-ACCTTCAAGTTTGTCGTCGTC-3′; reverse, 5′-AACTC TCCCAAAGGGCTATGT-3′. DR5: forward, 5′-AAGACCCTTGTGCTCGTTGT-3′; reverse, 5′-AGGTGGACACAATCCCTCTG-3′. GAPDH: forward, 5′-CATGAGAA GTATGACAACAGCCT-3′; reverse, 5′-AGTCCTTCCACGATACCAAAGT-3′.
Histology
Subcutaneous tumors were dissected and processed for immunohistochemistry as described.4 Ten micron sections were assessed for GFP and mCherry expression representing GBM cells and NSCs, respectively. Caspase-3 staining was performed as described7 using cleaved caspase-3 antibody (Cell Signaling) and quantified using photoshop.
Statistical analysis
Data were analyzed by Student’s t-test when comparing two groups. Data were plotted as mean±s.e.m. and differences were considered significant at P<0.05.
Supplementary Material
Acknowledgments
We thank Dr Shi-Yon Sun for providing pDR4 and pDR5 basic constructs; real-time PCR core facility of Neuroscience Department, Massachusetts General Hospital; flow cytometry core facility of Ragon Institute, Massachusetts General Hospital; and Nikon Imaging Center, Harvard Medical School for technical help and equipments. This work was supported by American Cancer Society (KS), NIH grants CA138922, NS071197 (KS), CA139980 (PKS) and the James McDonnell Foundation (KS). There are no competing financial interests to disclose.
Footnotes
CONFLICT OF INTEREST
The authors declare no conflict of interest.
Supplementary Information accompanies the paper on the Oncogene website (http://www.nature.com/onc)
References
- 1.Huse JT, Holland EC. Targeting brain cancer: advances in the molecular pathology of malignant glioma and medulloblastoma. Nat Rev Cancer. 2010;10:319–331. doi: 10.1038/nrc2818. [DOI] [PubMed] [Google Scholar]
- 2.Wiezorek J, Holland P, Graves J. Death receptor agonists as a targeted therapy for cancer. Clin Cancer Res. 2010;16:1701–1708. doi: 10.1158/1078-0432.CCR-09-1692. [DOI] [PubMed] [Google Scholar]
- 3.Ashkenazi A. Directing cancer cells to self-destruct with pro-apoptotic receptor agonists. Nat Rev Drug Discov. 2008;7:1001–1012. doi: 10.1038/nrd2637. [DOI] [PubMed] [Google Scholar]
- 4.Shah K, Hingtgen S, Kasmieh R, Figueiredo JL, Garcia-Garcia E, Martinez-Serrano A, et al. Bimodal viral vectors and in vivo imaging reveal the fate of human neural stem cells in experimental glioma model. J Neurosci. 2008;28:4406–4413. doi: 10.1523/JNEUROSCI.0296-08.2008. [DOI] [PMC free article] [PubMed] [Google Scholar]
- 5.Shah K, Bureau E, Kim DE, Yang K, Tang Y, Weissleder R, et al. Glioma therapy and real-time imaging of neural precursor cell migration and tumor regression. Ann Neurol. 2005;57:34–41. doi: 10.1002/ana.20306. [DOI] [PubMed] [Google Scholar]
- 6.Hingtgen SD, Kasmieh R, van de Water J, Weissleder R, Shah K. A novel molecule integrating therapeutic and diagnostic activities reveals multiple aspects of stem cell-based therapy. Stem Cells. 2010;28:832–841. doi: 10.1002/stem.313. [DOI] [PMC free article] [PubMed] [Google Scholar]
- 7.Sasportas LS, Kasmieh R, Wakimoto H, Hingtgen S, van de Water JA, Mohapatra G, et al. Assessment of therapeutic efficacy and fate of engineered human mesenchymal stem cells for cancer therapy. Proc Natl Acad Sci USA. 2009;106:4822–4827. doi: 10.1073/pnas.0806647106. [DOI] [PMC free article] [PubMed] [Google Scholar]
- 8.Spencer SL, Gaudet S, Albeck JG, Burke JM, Sorger PK. Non-genetic origins of cell-to-cell variability in TRAIL-induced apoptosis. Nature. 2009;459:428–432. doi: 10.1038/nature08012. [DOI] [PMC free article] [PubMed] [Google Scholar]
- 9.Raizer JJ, Abrey LE, Lassman AB, Chang SM, Lamborn KR, Kuhn JG, et al. A phase II trial of erlotinib in patients with recurrent malignant gliomas and nonprogressive glioblastoma multiforme postradiation therapy. Neuro Oncol. 2010;12:95–103. doi: 10.1093/neuonc/nop015. [DOI] [PMC free article] [PubMed] [Google Scholar]
- 10.Prince HM, Bishton MJ, Harrison SJ. Clinical studies of histone deacetylase inhibitors. Clin Cancer Res. 2009;15:3958–3969. doi: 10.1158/1078-0432.CCR-08-2785. [DOI] [PubMed] [Google Scholar]
- 11.Neyns B, Sadones J, Joosens E, Bouttens F, Verbeke L, Baurain JF, et al. Stratified phase II trial of cetuximab in patients with recurrent high-grade glioma. Ann Oncol. 2009;20:1596–1603. doi: 10.1093/annonc/mdp032. [DOI] [PubMed] [Google Scholar]
- 12.Nagar S. Pharmacokinetics of anti-cancer drugs used in breast cancer chemotherapy. Adv Exp Med Biol. 2010;678:124–132. doi: 10.1007/978-1-4419-6306-2_16. [DOI] [PubMed] [Google Scholar]
- 13.Mrugala MM, Chamberlain MC. Mechanisms of disease: temozolomide and glioblastoma—look to the future. Nat Clin Pract Oncol. 2008;5:476–486. doi: 10.1038/ncponc1155. [DOI] [PubMed] [Google Scholar]
- 14.McDermott U, Pusapati RV, Christensen JG, Gray NS, Settleman J. Acquired resistance of non-small cell lung cancer cells to MET kinase inhibition is mediated by a switch to epidermal growth factor receptor dependency. Cancer Res. 2010;70:1625–1634. doi: 10.1158/0008-5472.CAN-09-3620. [DOI] [PMC free article] [PubMed] [Google Scholar]
- 15.Fan QW, Knight ZA, Goldenberg DD, Yu W, Mostov KE, Stokoe D, et al. A dual PI3 kinase/mTOR inhibitor reveals emergent efficacy in glioma. Cancer Cell. 2006;9:341–349. doi: 10.1016/j.ccr.2006.03.029. [DOI] [PMC free article] [PubMed] [Google Scholar]
- 16.Crosswell HE, Dasgupta A, Alvarado CS, Watt T, Christensen JG, De P, et al. PHA665752, a small-molecule inhibitor of c-Met, inhibits hepatocyte growth factor-stimulated migration and proliferation of c-Met-positive neuroblastoma cells. BMC Cancer. 2009;9:411. doi: 10.1186/1471-2407-9-411. [DOI] [PMC free article] [PubMed] [Google Scholar]
- 17.Albeck JG, Burke JM, Spencer SL, Lauffenburger DA, Sorger PK. Modeling a snap-action, variable-delay switch controlling extrinsic cell death. PLoS Biol. 2008;6:2831–2852. doi: 10.1371/journal.pbio.0060299. [DOI] [PMC free article] [PubMed] [Google Scholar]
- 18.Ashkenazi A, Herbst RS. To kill a tumor cell: the potential of proapoptotic receptor agonists. J Clin Invest. 2008;118:1979–1990. doi: 10.1172/JCI34359. [DOI] [PMC free article] [PubMed] [Google Scholar]
- 19.Yang A, Wilson NS, Ashkenazi A. Proapoptotic DR4 and DR5 signaling in cancer cells: toward clinical translation. Curr Opin Cell Biol. 2010;22:837–844. doi: 10.1016/j.ceb.2010.08.001. [DOI] [PubMed] [Google Scholar]
- 20.Nagane M, Shimizu S, Mori E, Kataoka S, Shiokawa Y. Predominant antitumor effects by fully human anti-TRAIL-receptor2 (DR5) monoclonal antibodies in human glioma cells in vitro and in vivo. Neuro Oncol. 2010;12:687–700. doi: 10.1093/neuonc/nop069. [DOI] [PMC free article] [PubMed] [Google Scholar]
- 21.Pennarun B, Meijer A, de Vries EG, Kleibeuker JH, Kruyt F, de Jong S. Playing the DISC: turning on TRAIL death receptor-mediated apoptosis in cancer. Biochem Biophys Acta. 2010;1805:123–140. doi: 10.1016/j.bbcan.2009.11.004. [DOI] [PubMed] [Google Scholar]
- 22.Liu X, Yue P, Chen S, Hu L, Lonial S, Khuri FR, et al. The proteasome inhibitor PS-341 (bortezomib) up-regulates DR5 expression leading to induction of apoptosis and enhancement of TRAIL-induced apoptosis despite up-regulation of c-FLIP and survivin expression in human NSCLC cells. Cancer Res. 2007;67:4981–4988. doi: 10.1158/0008-5472.CAN-06-4274. [DOI] [PubMed] [Google Scholar]
- 23.Dhandapani L, Yue P, Ramalingam SS, Khuri FR, Sun SY. Retinoic acid enhances TRAIL-induced apoptosis in cancer cells by upregulating TRAIL receptor 1 expression. Cancer Res. 2011;71:5245–5254. doi: 10.1158/0008-5472.CAN-10-4180. [DOI] [PMC free article] [PubMed] [Google Scholar]
- 24.Sung B, Park B, Yadav VR, Aggarwal BB. Celastrol a triterpene, enhances TRAIL-induced apoptosis through the down-regulation of cell survival proteins and up-regulation of death receptors. J Biol Chem. 2010;285:11498–11507. doi: 10.1074/jbc.M109.090209. [DOI] [PMC free article] [PubMed] [Google Scholar] [Retracted]
- 25.Prasad S, Ravindran J, Sung B, Pandey MK, Aggarwal BB. Garcinol potentiates TRAIL-induced apoptosis through modulation of death receptors and anti-apoptotic proteins. Mol Cancer Ther. 2010;9:856–868. doi: 10.1158/1535-7163.MCT-09-1113. [DOI] [PMC free article] [PubMed] [Google Scholar] [Retracted]
- 26.Kim MO, Moon DO, Kang CH, Kwon TK, Choi YH, Kim GY. beta-Ionone enhances TRAIL-induced apoptosis in hepatocellular carcinoma cells through Sp1-dependent upregulation of DR5 and downregulation of NF-kappaB activity. Mol Cancer Ther. 2010;9:833–843. doi: 10.1158/1535-7163.MCT-09-0610. [DOI] [PubMed] [Google Scholar]
- 27.Song JH, Kandasamy K, Kraft AS. ABT-737 induces expression of the death receptor 5 and sensitizes human cancer cells to TRAIL-induced apoptosis. J Biol Chem. 2008;283:25003–25013. doi: 10.1074/jbc.M802511200. [DOI] [PMC free article] [PubMed] [Google Scholar]
- 28.Yoshida T, Shiraishi T, Nakata S, Horinaka M, Wakada M, Mizutani Y, et al. Proteasome inhibitor MG132 induces death receptor 5 through CCAAT/enhancer-binding protein homologous protein. Cancer Res. 2005;65:5662–5667. doi: 10.1158/0008-5472.CAN-05-0693. [DOI] [PubMed] [Google Scholar]
- 29.Baritaki S, Huerta-Yepez S, Sakai T, Spandidos DA, Bonavida B. Chemotherapeutic drugs sensitize cancer cells to TRAIL-mediated apoptosis: up-regulation of DR5 and inhibition of Yin Yang 1. Mol Cancer Ther. 2007;6:1387–1399. doi: 10.1158/1535-7163.MCT-06-0521. [DOI] [PubMed] [Google Scholar]
- 30.Singh TR, Shankar S, Srivastava RK. HDAC inhibitors enhance the apoptosis-inducing potential of TRAIL in breast carcinoma. Oncogene. 2005;24:4609–4623. doi: 10.1038/sj.onc.1208585. [DOI] [PubMed] [Google Scholar]
- 31.Wood TE, Dalili S, Simpson CD, Sukhai MA, Hurren R, Anyiwe K, et al. Selective inhibition of histone deacetylases sensitizes malignant cells to death receptor ligands. Mol Cancer Ther. 2010;9:246–256. doi: 10.1158/1535-7163.MCT-09-0495. [DOI] [PubMed] [Google Scholar]
- 32.Nakata S, Yoshida T, Horinaka M, Shiraishi T, Wakada M, Sakai T. Histone deacetylase inhibitors upregulate death receptor 5/TRAIL-R2 and sensitize apoptosis induced by TRAIL/APO2-L in human malignant tumor cells. Oncogene. 2004;23:6261–6271. doi: 10.1038/sj.onc.1207830. [DOI] [PubMed] [Google Scholar]
- 33.Aguilera DG, Das CM, Sinnappah-Kang ND, Joyce C, Taylor PH, Wen S, et al. Reactivation of death receptor 4 (DR4) expression sensitizes medulloblastoma cell lines to TRAIL. J Neurooncol. 2009;93:303–318. doi: 10.1007/s11060-008-9788-x. [DOI] [PMC free article] [PubMed] [Google Scholar]
- 34.Finlay D, Richardson RD, Landberg LK, Howes AL, Vuori K. Novel HTS strategy identifies TRAIL-sensitizing compounds acting specifically through the caspase-8 apoptotic axis. PLoS One. 2010;5:e13375. doi: 10.1371/journal.pone.0013375. [DOI] [PMC free article] [PubMed] [Google Scholar]
- 35.Booth NL, Sayers TJ, Brooks AD, Thomas CL, Jacobsen K, Goncharova EI, et al. A cell-based high-throughput screen to identify synergistic TRAIL sensitizers. Cancer Immunol Immunother. 2009;58:1229–1244. doi: 10.1007/s00262-008-0637-8. [DOI] [PMC free article] [PubMed] [Google Scholar]
- 36.Bagci-Onder T, Wakimoto H, Anderegg M, Cameron C, Shah K. A dual PI3K/mTOR inhibitor, PI-103, cooperates with stem cell-delivered TRAIL in experimental glioma models. Cancer Res. 2011;71:154–163. doi: 10.1158/0008-5472.CAN-10-1601. [DOI] [PubMed] [Google Scholar]
- 37.Hingtgen S, Ren X, Terwilliger E, Classon M, Weissleder R, Shah K. Targeting multiple pathways in gliomas with stem cell and viral delivered S-TRAIL and Temozolomide. Mol Cancer Ther. 2008;7:3575–3585. doi: 10.1158/1535-7163.MCT-08-0640. [DOI] [PMC free article] [PubMed] [Google Scholar]
- 38.Albeck JG, Burke JM, Aldridge BB, Zhang M, Lauffenburger DA, Sorger PK. Quantitative analysis of pathways controlling extrinsic apoptosis in single cells. Mol Cell. 2008;30:11–25. doi: 10.1016/j.molcel.2008.02.012. [DOI] [PMC free article] [PubMed] [Google Scholar]
- 39.Kock N, Kasmieh R, Weissleder R, Shah K. Tumor therapy mediated by lentiviral expression of shBcl-2 and S-TRAIL. Neoplasia. 2007;9:435–442. doi: 10.1593/neo.07223. [DOI] [PMC free article] [PubMed] [Google Scholar]
Associated Data
This section collects any data citations, data availability statements, or supplementary materials included in this article.