Abstract
Biofilms are microbial communities that are characterized by the presence of a viscoelastic extracellular polymeric substance (EPS). Studies have shown that polysaccharides, along with proteins and DNA, are a major constituent of the EPS, and play a dominant role in mediating its microstructure and rheological properties. Here, we investigate the possibility of entanglements and associative complexes in solutions of extracellular polysaccharide intercellular adhesin (PIA) extracted from Staphylococcus epidermidis biofilms. We report that the weight average molar mass and radius of gyration of PIA isolates are 2.01 × 10⁵ ± 1200 g/mol and 29.2 ± 1.2 nm respectively. The coil overlap concentration, c*, was thus determined to be (32 ± 4) × 10−4 g/mL. Measurements of the in situ concentration of PIA (cPIA,Biofilm) was found to be (10 ± 2) × 10−4 g/mL. Thus, cPIA,Biofilm < c* and the amount of PIA in the biofilm is too low to cause polymer chain entanglements. In the pH range 3.0 to 5.5, PIA was found to both self-associate and to form complexes with bovine serum albumin (BSA). By static light scattering, both self-association and complex formation with 0.5 %(w/v) BSA were found to occur at PIA concentrations of 0.30 × 10⁻⁴ g/mL and greater, which is about 30 times lower than the measured cPIA,Biofilm. These results suggest that the microscopic origin of EPS viscoelasticity is unlikely to be due to polysaccharide entanglements. Furthermore, the onset of self-association and protein complexation of PIA occurs at concentrations far lower than the native PIA concentration in biofilms. This finding therefore suggests a critical role for those two association mechanisms in mediating biofilm viscoelasticity.
Keywords: Staphylococcus epidermidis, biofilm, entangled polymers, polysaccharide-protein complex, extracellular polysaccharides, static light scattering
INTRODUCTION
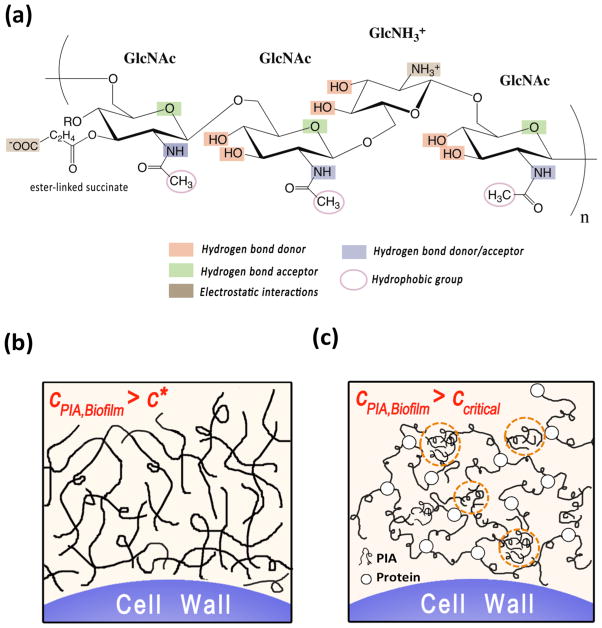
Biofilms are surface adherent aggregates of microorganisms encased within a secreted matrix of extracellular polymeric substance (EPS) 1. The EPS accounts for about 80% of the biofilm dry mass and thus plays a major role in mediating both the morphology and rheology of biofilms 2. The EPS is a heterogeneous hydrogel composed predominantly of polysaccharides, proteins and DNA, all of which are contained in the extracellular volume of the biofilm 2–4. Mechanical properties such as viscoelasticity and cohesiveness of the EPS are thus dependent on the physicochemical properties of the biofilm polysaccharides, such as their molecular weight, radius of gyration, local concentration within the biofilm and their interaction with other EPS constituents 2,4,5. In this article, we characterize these properties for the case of biofilms formed by Staphylococcus epidermidis, an opportunistic pathogen associated with nosocomial blood stream infections 1. The mechanical stability and the three-dimensional microstructure of the S. epidermidis EPS is strongly dependent on a self-produced extracellular polysaccharide called polysaccharide intercellular adhesion (PIA) 1,4,6–8. While the biochemistry (Figure 1a) and genomic origin of PIA have been well characterized 9, very little has been investigated about the polymeric properties of PIA.
Figure 1.
a) Schematic representation of the PIA chain 9,37. PIA is a linear homoglycan of β-1,6-linked N-Acetylglucosamine (GlcNAc) residues. About 20% of the monomers are deacetylated, having a cationic free amine group (GlcNH3+). The chain has a small fraction of anionic O-succinate functional groups rendering the chain zwitterionic. The schematic is a snapshot of a longer molecule; the monomers need not be present in the sequence depicted. Every repeat unit, has potential hydrogen bond participants due to the –OH and acetamido groups. Interactions between chains can therefore occur through the hydrophobic (-CH3), hydrogen bonding (-OH, acetamido), and ionic (deacetylated -NH3+, and succinyl ester-related –COO−) regions of the polysaccharide backbone.
b) Schematic representation of the two possible mechanisms of PIA’s contribution to S. epidermidis biofilm viscoelasticity 2,5. If cPIA,Biofilm ≥ c*, then PIA could form an entangled network of polymer chains 15.
c) Alternatively if cPIA,Biofilm ≥ ccritical, then PIA could associate into a network due to interactions with itself (dotted circles), or due to interactions with protein. See text for definitions of c* and ccritical.
S. epidermidis biofilms are viscoelastic in nature 10,11. Following 4,5,12,13, PIA chains in the extracellular volume could in theory contribute to biofilm viscoelasticity by one of two mechanisms. In the first, which assumes no specific inter-chain interactions, a high number density of PIA chains produced in situ leads to physical entanglements 2,5. These entanglements induce viscoelasticity in the biofilm matrix (Figure 1b). In the second, associative interactions of PIA with itself and/or other EPS macromolecules such as proteins lead to supra-molecular structures that result in a viscoelastic hydrogel 2,5 (Figure 1c). Since PIA dominates the EPS microstructure in most strains of this species 4, the purpose of this paper is to establish which physical model is most consistent with the measured molar mass of PIA, local concentration of PIA within S. epidermidis biofilms, and its scattering behavior in presence of proteins.
Simple mechanical characterization of bulk biofilm 11,14 is insufficient to distinguish between a material composed of an entangled network of polysaccharide chains and an assembly of strands held together by inter-chain attractions. Rather, what is needed is a determination of the local concentration of polymer within the biofilm (cPIA,Biofilm) relative to its coil-overlap concentration (c*, the concentration at which neighboring PIA molecules interpenetrate) and its critical association concentration (ccritical, the concentration above which PIA engages in associative interactions with itself or other EPS macromolecules such as proteins). This paper reports measurements that allow characterization of these three quantities. Consequently, the comparative role of entanglements and associations in PIA is established.
A biofilm in which the extracellular PIA concentration, cPIA,Biofilm, is much greater than the overlap concentration, c*, would acquire viscoelasticity through entanglements of PIA chains (Figure 1b). Here c* is the overlap concentration, , where Mw and rg are the weight average molar mass and average radius of gyration of the polymer respectively 15. Polysaccharide entanglements in biofilm EPS have been invoked as discussions in the literature 5,16–19; however, little experimental evidence supports their existence.
Likewise, a bacterial community in which cPIA,Biofilm ≥ ccritical could be viscoelastic due to PIA self-association or inter-molecular complexation with extracellular proteins. These phenomena are driven by hydrogen bond, hydrophobic and/or ion-pair interactions (self-association) 20–22 or electrostatic interactions between oppositely charged groups on two different polymers (complex formation) 23 (Figure 1c). While polysaccharide-protein complexes have been commonly discussed as prevalent within the EPS 4,12, experimental verification is very limited in the biofilm literature.
The null case in which cPIA,Biofilm is both below the overlap concentration c* and the critical association concentrations ccritical is unlikely because it is inconsistent with the known viscoelasticity of the biofilm EPS. A fourth possibility, in which cPIA,Biofilm is greater than both c* and ccritical, is also a potential case.
The aim of this study is thus to measure cPIA,Biofilm/c* and cPIA,Biofilm/ccritical of PIA from S. epidermidis biofilms. We use multi-angle laser light scattering (MA-LLS) and size exclusion chromatography (SEC) to quantify Mw, rg and c* for PIA recovered from batch cultures. Measurements of extracellular PIA concentration, cPIA,Biofilm, were made by quantifying the polymer concentration per biofilm bacteria and bacteria number density in situ by biochemical and confocal microscopy methods, respectively. Using pH induced turbidity and low-angle light scattering (LLS) we identify ccritical for PIA self-association and complex formation with bovine serum albumin (BSA), representative of one of the most common host proteins likely to be found in any medically important biofilm. We find that the measured cPIA,Biofilm is inconsistent with the formation of polymer chain entanglements but that PIA exhibits signatures of both self-association and complexation at acidic pH. The study therefore suggests that EPS viscoelasticity is generated primarily through associative interactions of EPS macromolecules rather than through polysaccharide entanglements.
EXPERIMENTAL SECTION
Culture conditions and bacterial strains
S. epidermidis RP62A (ATCC, catalog no. 35984) cultures were grown for 24 h at 37°C in tryptic soy broth media containing 1% (w/v) filtered glucose with a moderate shaking of 60 rpm (Forma Incubated Shaker, Thermo Scientific) 24.
Recovery of PIA isolate from batch cultures
Recovery of crude PIA was similar to 25 except that isolation was performed in 0.1M NaNO3, the mobile phase for SEC. Flask-adherent biofilm was collected by centrifugation (5000 g, 20 min, 4°C), re-suspended, and then sonicated in an ice bath to release the PIA and other extracellular material from cell surfaces (16–19W, 4×30 s cycles, Sonic Dismembrator Model 60, Fisher Scientific). After removing insoluble material (such as cell debris) and further clarification (12000 g, 10 min), the crude extract rich in PIA was filter sterilized and concentrated using Amicon Ultra-15, centrifugal filter with 10 kDa cut off membrane (Millipore).
Lectin affinity chromatography to obtain high purity PIA
A multi-component elution pattern was observed for crude PIA isolated by sonication (Figure 2a, inset). The SEC trace of the crude isolate shows three peaks. Eluent fractions containing amino sugars were identified using a dot blot technique 25 and the Smith-Gilkerson assay for hexosamines 26. Eluent fractions corresponding to Peaks 1 and 3 (Figure 2a, inset) showed no GlcNAc content in either assay. Peak 3 was removed using Amicon Ultra-15 filter with a 30 kDa cut off membrane (Millipore). Figure 2a shows that amino sugars are present only in Peak 2, as detected by the colorimetric assay. Peak 1 is a molecule of very high molecular weight (≥ 106 Da). From the concentration detector signal (blue), this material contributes little to the total mass due to its low concentration. To remove Peak 1, concentrated crude isolates were passed over an agarose bound wheat-germ agglutinin lectin (known to have specific affinity towards N-acetylglucosamine, GlcNAc) bead column (Vector Labs, CA) equilibrated in 20mM Tris-HCl, 0.15M NaCl binding buffer. In this way, we ensure that any contaminants in the crude extract are discarded by means of the flow through from the lectin bead column. Following washing, lectin-bound PIA was eluted using 0.5M GlcNAc in 20mM Tris-HCl, 0.5M NaCl (pH 3.0, AcOH) and washed and concentrated in 0.1M NaNO3 or 0.02μm filtered HPLC Grade water (Fisher Scientific) using Amicon centrifugal filters with 3 kDa cut off membrane (Millipore). Figure 2b shows the elution profile of the isolated Peak 2, in which the glucosamine fraction of the isolate is localized. All further plots report data for PIA purified using this protocol. Experiments were performed within a day of sample preparation to avoid any effects due to solvent incompatibility 25.
Figure 2.
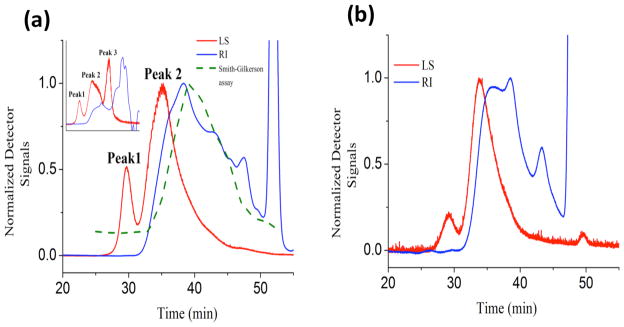
a) Elution chromatograms of PIA isolated by sonication. The chromatograms from the light scattering (LS) detector and from the refractive index (RI) detector are in red and blue respectively. Amino sugars were detected only in Peak 2 (by the Smith-Gilkerson assay) 26. Eluting fractions beyond 50min are peaks caused by electrolyte in the mobile phase.
b) The elution chromatogram of isolated Peak 2, containing only amino sugars. This sample represents high purity PIA that was used for all further analysis.
Size exclusion chromatography (SEC) – Multi-angle laser light scattering (MA-LLS) for Mw and rg measurement
Waters Ultrahydrogel 2000 and 250 size exclusion columns (Waters Corp., Milford, MA) connected in series were continuously washed at 0.45mL/min with a standard aqueous mobile phase of 0.1M NaNO3, 0.05 %(w/v) NaN3. The column outlet was connected to a MALLS detector (DAWN EOS, GaAs laser at 690nm, Wyatt Technology, Santa Barbara, CA) and a concentration detector (Optilab DSP refractometric interferometer (RI) detector, Wyatt Technology, Santa Barbara, CA). The light scattering due to the eluting polymers was analyzed according to the Zimm model to calculate the molar mass distribution 27. Static light scattering was performed on unfractionated PIA samples of different concentrations at neutral pH using the DAWN EOS. The time averaged angle dependent scattering intensities were then analyzed using the Zimm plot to obtain the z-average rg 27. Analysis of light scattering data was done using Wyatt’s ASTRA software. Following 28,29, the refractive index increment (dn/dc) was taken as 0.162 mLg−1.
Low Angle Light Scattering (LLS)
Static light scattering was performed with a light scattering goniometer equipped with dual detectors (ALV-GmBH Langen Germany). The light source was a Coherent Innova 70-C laser (Coherent Inc., Santa Clara, CA) operating at 488 nm. Intensity of scattered light was measured in the range 35° < θ < 140° and extrapolated to the low angle limit as per Zimm theory 27.
Measuring number density of bacterial cells within a biofilm
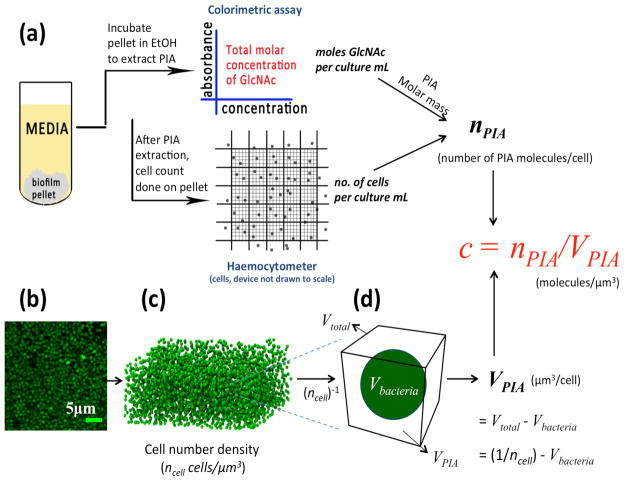
S. epidermidis biofilms were grown in Stovall Life Sciences 3-channel flow cells (24 h, 37°C) at constant shear stress (0.01 Pa) in the same media as above. Biofilm cells stained with Syto9 (Invitrogen) were imaged between the adhesion surface and a height of 12 μm using a Leica TCS SP2 confocal laser scanning microscopy (CLSM) with 100x, 1.4 numerical aperture (N.A) oil immersion objective lens. Biofilm beyond that height was not imaged because 12 μm is the maximum working distance (in water) of the high numerical aperture (NA) objective used for microscopy. High NA microscopy was necessary so as to image at a resolution that could uniquely identify individual cells for the cellular density characterization. The excitation wavelength was 488 nm. Image processing was performed on the acquired images to identify bacterial centroids as described previously 30,31. Number density was computed as the number of cells identified within the total image volume (ncell units: cells/μm3). Figure 3b shows a confocal image acquired within the biofilm, in a plane parallel to the bottom shear surface of the flow cell. Figure 3c is a 3-D reconstruction of the total image volume with the 3-D location of the bacterial cells.
Figure 3.
Schematic of assay used to calculate the average extracellular concentration, cPIA,Biofilm, of PIA. a) A schematic of the protocol to calculate total number of PIA molecules per biofilm cell (nPIA). b) An x-y CLSM image of bacterial cells (green) within the biofilm. c) A 3-D reconstruction of a biofilm volume using centroid data obtained using image analysis 31. The number of cells within that volume was taken as local cell number density (ncell cells/μm3). c) The reciprocal of the cell number density, Vtotal = 1/ncell, is shown. The volume, VPIA, available to PIA molecules per biofilm bacteria (nPIA) was calculated as Vtotal − Vbacteria (Table 1). The extracellular PIA concentration within the biofilm, cPIA,Biofilm, was then calculated as nPIA/VPIA.
Measuring PIA concentration per biofilm cell (nPIA)
Surface attached PIA from S. epidermidis cells was released by incubating cells for 5 min at 100°C in a solution of 0.5M EDTA, pH 8.0 (final volume, 1:50 culture volume) 32. PIA rich supernatant was collected by centrifugation (9000 g, 5min 4°C) and the cell pellet (devoid of PIA) was re-dispersed in PBS. Bacterial cell density was measured using a haemocytometer (Fisher Scientific). The Smith-Gilkerson colorimetric assay for amino sugars 26 was performed on the PIA rich supernatant to obtain the molar concentration of PIA using the knowledge of its Mw (as reported in results). After accounting for dilutions and initial volume, the ratio of PIA concentration to cell density, yielded the number of molecules of PIA per biofilm bacteria (nPIA). A schematic of this procedure is given in Figure 3a.
Average extracellular concentration, cPIA,Biofilm, of PIA
This concentration cPIA,Biofilm is the average number of PIA molecules (nPIA) within the average extracellular volume (VPIA) associated with each biofilm bacterium. That is, cPIA,Biofilm = nPIA/VPIA. VPIA is the reciprocal of the local number density of biofilm bacteria (ncell cells/μm3 as from the CLSM measurement) less the cellular volume of the bacteria, Vbacteria. Thus, VPIA = Vtotal − Vcell = (1/ncell) − {(4π/3)rbacteria 3}. From the CLSM measurements, we found rbacteria = 0.32 ± 0.01 μm. This procedure is shown in Figures 3 c,d. The CLSM value of bacterial cell radius was consistent with independent characterizations performed by scanning electron microscopy and multi-angle dynamic light scattering.
Preparation of PIA – BSA solutions
We identify if PIA can form complexes with proteins, which is a normal constituent of the biofilm EPS 2. Bovine serum albumin (Sigma Aldrich) was used as a model protein for this test. PIA-BSA solutions were prepared by mixing different amounts of PIA with the same initial mass concentration of BSA (0.5 %(w/v)) in 0.02μm filtered HPLC Grade water (Fisher Scientific)) to obtain a series of solutions containing different PIA contents (cPIA: 0.30 × 10⁻⁴ − 14 × 10−4 g/mL) 33. Samples were rolled on a Wheaton Mini Bench Top Roller (WHEATON, Millville, NJ) at 10 RPM for 30 min prior to analysis.
Effect of pH on PIA and PIA-BSA solutions
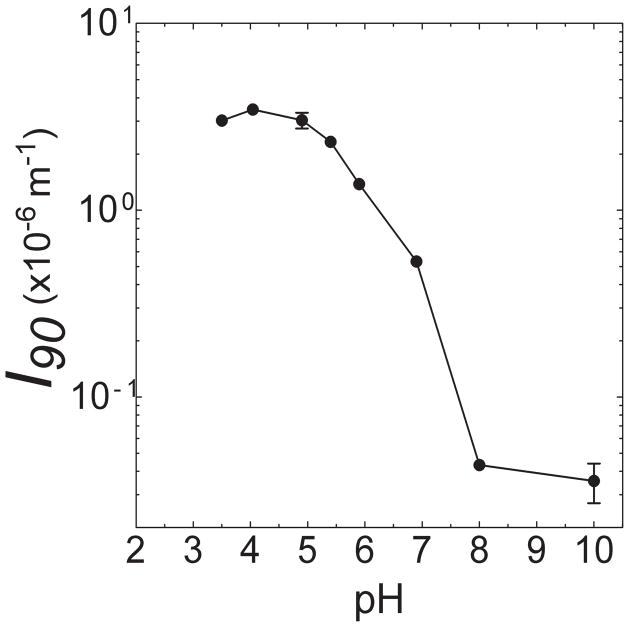
To select the pH for self-association measurements of PIA, the effect of pH on the scattering intensity at 90° (Iθ=90) for dilute solutions of PIA at cPIA = 6.40 × 10⁻⁴ g/mL was measured and is shown in Figure 4. The increase in Iθ=90 at pH < 7.5 indicates an increase in size of the scattering specimen, thereby suggesting self-association 20,34. Figure 4 show that self-association occ urs in the range 3.0 < pH < 5.5.
Figure 4.
Variation of scattering intensity (Iθ=90) of PIA solutions at 90° and at cPIA = 6.4 × 10⁻⁴ g/mL versus pH.
To select the pH for protein-induced association of PIA, the effect of pH on absorbance of PIA-BSA solutions containing 0.5 %(w/v) BSA and cPIA = 6.40 × 10⁻⁴ g/mL was measured at 600 nm in 1 cm path length plastic cuvettes (GENESYS 20, Thermo-Scientific UV Visible Spectrophotometer) (Figure 5) 33. Formation of insoluble complexes is characterized by an increase in the absorbance of the specimen 33. From Figure 5, the range 3.5 ≤ pH ≤ 5 favors PIA-BSA complexation. The onset of complex formation occurs at pHc 5.0 and reaches a maximum at pHc,max 4.5. Thus, to identify critical association concentration, ccritical, LLS were done for PIA and PIA-BSA solutions at pH 4.9 and 7.5 and cPIA ≤ cPIA,Biofilm. Scattering experiments were not done at pHc,max to avoid multiple scattering from highly turbid samples.
Figure 5.
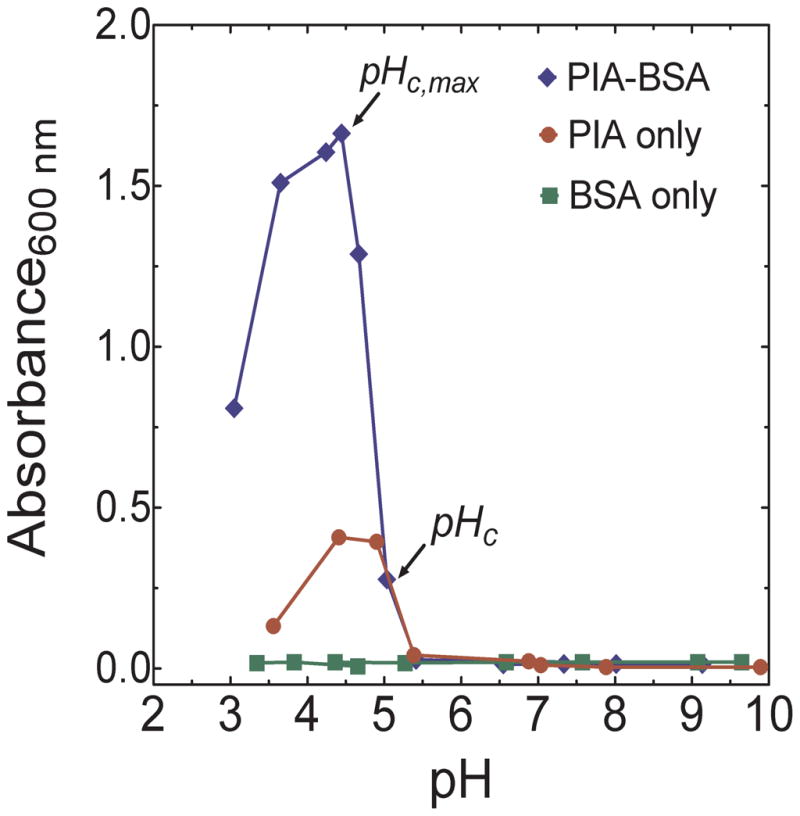
Absorbance (at 600 nm) versus pH for solutions of PIA-BSA (6.4 × 10⁻⁴ g/mL PIA, 0.5 %(w/v) BSA) and solutions containing only PIA (6.4 × 10⁻⁴ g/mL) and only BSA (0.5 %(w/v)). The absorbance curve of PIA is consistent with its scattering behavior whereas BSA shows no significant change in absorbance at the concentration studied.
RESULTS AND DISCUSSION
Molecular Weight Distribution
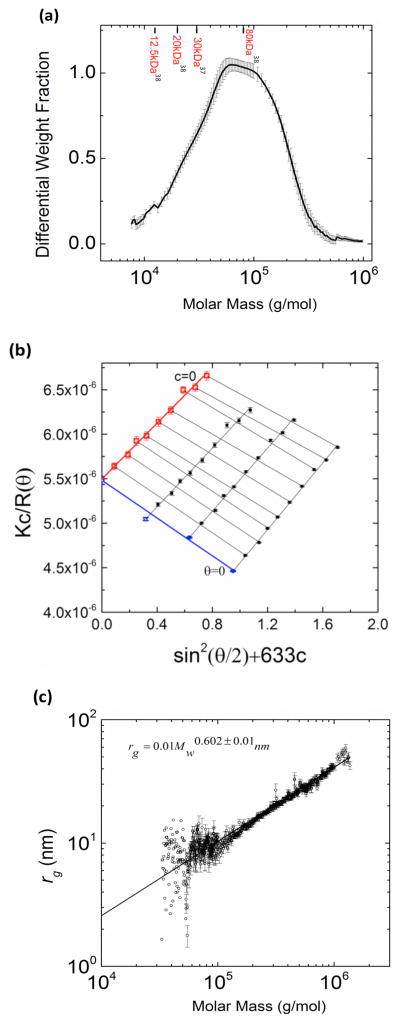
The angular distribution of light scattering, as reported in the chromatograms in Figure 2b, was analyzed to obtain the molar mass distribution of PIA (Figure 6a). The weight average molar mass, Mw, was found to be 2.01 × 10⁵ ± 1200 g/mol and the number average molar mass, Mn, was 7.14 × 10⁴ ± 2500 g/mol. The polydispersity of the S. epidermidis PIA was thus 2.8 ± 0.1. These results have been averaged over 20 samples purified from separate batch cultures. The accuracy of our result is supported by additional analysis of the isolation and purification process that suggests minimal systematic error due to (i) mechanical damage to the polymer during sonication; (ii) loss to centrifugal filters at each stage 35. Separately, it was found that environmental conditions such as osmotic stress (due to growth media supplemented with 136–770mM NaCl 36) affected PIA yield; however, this change did not significantly affect the measured molar mass distribution of PIA.
Figure 6.
a) Differential molar mass distribution of PIA, indicating PIA molecular weights previously reported in literature 37,38. b) Zimm plot obtained by static light scattering measurement of three different concentrations of PIA (1 × 10⁻⁴ g/mL − 15 × 10−4 g/mL < c*) at different scattering angles. The weight average molar mass is 1.81 × 10⁵ ± 3700 g/mol and the z-average rg is 30 ± 1.6 nm. c) Scaling plot of rg vs Mw for S. epidermidis synthesized PIA.
The measured value of PIA molar mass is in good agreement with the report of Irina et al.,24. While most of the earlier reported values of PIA molar mass are around 30–80 kDa 37,38 (Figure 6 a), our protocol has resulted in the isolation of a sizeable fraction of higher molar mass molecules (> 105 Da) as well. We attribute this to our purification protocol, which does not include harsh treatments such as ethanol precipitation, repeated dialysis and filtration or freeze drying as commonly carried out in extracting biofilm polysaccharides 39,40. These treatment steps could potentially result in considerable sample loss due to precipitation upon frequent solvent changes. The polydispersity indicates that the biofilm EPS contains PIA chains with a distribution of chain lengths. Incubation of crude isolates with Proteinase-K and DNAse I 40, prior to affinity chromatography did not affect our final results.
Radius of Gyration, rg, and overlap concentration, c*, of PIA
Static light scattering of unfractionated PIA of different concentrations (1 × 10⁻⁴–15 × 10−4 g/mL) yielded a Zimm plot as shown in Figure 6b. We repeated this experiment four times, and the measured z-average rg was 29.2 ± 1.2 nm. The Mw obtained from the Zimm plot showed a 6.3 ± 0.1 % deviation from that obtained from Figure 6a. This deviation suggests minimal mechanical degradation of the PIA chains within the SEC columns. The second virial coefficient was found to be A2 = (− 3.4 ± 0.3) × 10−4 mol mL/g2. The negative A2 indicates poor solvent quality for PIA. Indeed, it was found that PIA precipitated out of aqueous solution at higher concentrations, a phenomena also observed by Irina et al 24. Thus, experiments were carried out within a day or two of sample preparation to prevent any solvent induced changes in polymer conformation. The leading part of the chromatogram from Figure 2b was analyzed to extract a plot of rg vs. Mw (Figure 6c). This plot shows a scaling of rg = 0.01Mw 0.60±0.01 nm. The power law exponent is consistent with the behavior of a flexible chain 15. From the molar mass and radius of gyration, we calculated the coil overlap concentration to be equal to (32 ± 4) × 10−4 g/mL.
Average cPIA,Biofilm of PIA in S. epidermidis biofilms
The values of cell number density (ncell), Vtotal, VPIA and nPIA are shown in Table 1. At the growth conditions studied, the cell number density within the biofilm was found to be 0.19 ± 0.03 cells/μm3. Thus, there is an average of one cell found in a volume of Vtotal= 5.26 ± 0.83 μm3 within the biofilm. Because Vbacteria= 0.14 ± 0.01 μm3, VPIA = 5.12 ± 0.83 μm3/cell. The number of PIA molecules per cell (nPIA) was found to be 1.56 ± 0.2 × 10⁴ molecules/cell. The ratio of nPIA and VPIA, is the extracellular concentration, cPIA,biofilm (in molecules/μm3), of PIA within the biofilm. Thus, using the value of Mw, cPIA,biofilm = (10 ± 2) × 10−4 g/mL and the extracellular cPIA,biofilm/c* of PIA for S. epidermidis EPS is 0.31 ± 0.07.
Table 1.
Intra-biofilm properties measured to calculate the extracellular cPIA,Biofilm/c* of PIA.
| PROPERTY | VALUE |
|---|---|
| Cell number density (ncell) | 0.19 ± 0.03 cells/μm3 |
| Vtotala | 5.26 ± 0.83 μm3 |
| VPIAb | 5.12 ± 0.83 μm3 |
| nPIAc | 1.56 ± 0.20 × 10⁴ PIA molecules/cell |
| cPIA,Biofilm/c* | 0.31 ± 0.07 |
Vtotal: reciprocal of cell number density
VPIA: average extracellular volume associated with each biofilm bacterium
nPIA: number of PIA molecules per biofilm bacteria
The important result cPIA,Biofilm/c* < 1 shows that the extracellular concentration of PIA produced within the S. epidermidis biofilm is in the non-entangled, dilute regime. We remark that the measurement of the PIA cPIA,Biofilm/c* is an average over the entire biofilm, because the measurements nPIA and Vtotal are themselves taken over the whole cultured biofilm. The measurement thus averages over any spatial fluctuations in local cPIA,Biofilm/c* within the biofilm. The measurement of cPIA,Biofilm accounts for the excluded volume of cells within the biofilm, and is an accurate measure of the in situ PIA concentration for that reason.
Polysaccharide entanglements in biofilm matrices have been thought to occur when the polymer molar mass exceeds a value of 105 Da 16,19. Constitutive models for biofilm mechanics have also been developed under this assumption 19. Here, we have systematically shown that the molar mass of PIA is well above 105 Da; however, even given this high molar mass, the biofilm PIA concentration in situ is as such too low to support significant entanglement. Thus, the role of physical entanglements in determining EPS viscosity and viscoelasticity is small.
Associative interactions of PIA
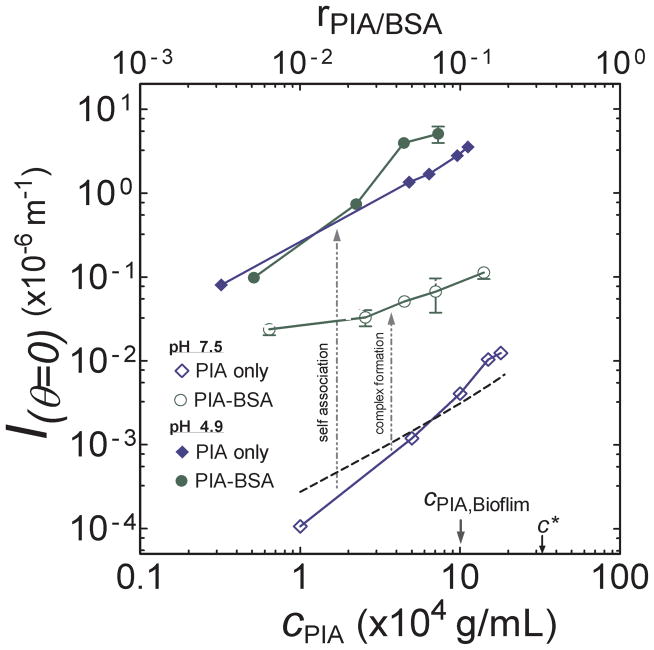
Associative interactions of PIA could be facilitated by its polyelectrolyte chemistry (Figure 1a). Within the biofilm, these interactions could be induced by self-association and/or complex formation with extracellular protein 5. We address each case in the following sections. To identify ccritical for these two kinds of associative phenomenon, the scattering intensity at zero angle (Iθ=0) versus cPIA for both PIA and PIA-BSA solutions at pH 4.9 and pH 7.5 was measured.
ccritical for self-association of PIA
Figure 7 shows significant differences between concentration dependent scattering of PIA at pH 4.9 and 7.5. The difference in scattering intensity is about three orders of magnitude, an indication of microstructural differences in the solutions at these two values of pH. For comparison, the expected scattering of single molecules of PIA is plotted on Figure 7. The curve plotted is based on the measured Mw, rg and A2 of PIA, and the Zimm scattering theory 27. The good agreement between the experimental Iθ=0 at pH 7.5 for PIA, and the theoretical scattering behavior for single PIA molecules, indicates that scattering at pH 7.5 is inconsistent with self-association behavior.
Figure 7.
Scattering intensity at zero angle (Iθ=0) versus PIA concentration (cPIA) at different pH. Solid and empty diamonds indicate solutions containing PIA only at pH 4.9 and 7.5, respectively. Circles indicate PIA-BSA solutions containing 0.5 %(w/v) BSA and varying concentrations of PIA at pH 4.9 (solid circles) and pH 7.5 (empty circles). The dotted line is the theoretical Zimm curve 27 calculated using the Mw and A2 measured from Figure 6. cPIA,Biofilm and c* are marked for reference. The upper x-axis denotes the molar ratio of PIA to BSA, rPIA/BSA, in each experiment.
On the other hand, at pH 4.9, the scattering intensity is at least 103 times greater than that at pH 7.5 for all cPIA values studied. This large change in scattering intensity is consistent with self-association at acidic pH 20,34. The increase in Iθ=0 at pH 4.5 indicates an increase in both the effective (i.e. associative) molar mass and the size of the scattering specimen 20. Because the large increase in Iθ=0 was observed at all PIA concentrations studied, for 0.30 × 10⁻⁴ g/mL and greater, we conclude that any critical association concentration, ccritical, must be less than 0.30 × 10⁻⁴ g/mL. Consequently, because cPIA,Biofilm = (10 ± 2) × 10−4 g/mL, the concentration of PIA in the native biofilm is at least 30 times greater than this upper bound on the critical association concentration. This result provides evidence that one of the mechanisms contributing to the EPS microstructure in S. epidermidis biofilm is PIA self-association.
While the self-association reported here is the first report of this kind for PIA, the observed behavior is consistent with literature results for a structurally similar polysaccharide, chitosan. Chitosan is a β-1,4 isomer of PIA. At similar degrees of acetylation, chitosan was also found to exist as self-aggregates in dilute solutions at acidic pH 41,42.
ccritical for PIA-BSA complexation
From Figure 7, we find that the scattering behavior of PIA is significantly modified in the presence of BSA. At pH 7.5, the concentration dependent scattering of PIA-BSA solutions is about 102 times higher than PIA solutions at the same pH. Here the amount of BSA added to each PIA solution is 0.5 %(w/v). Aqueous solutions of BSA at this concentration were found to scatter negligibly relative to all the curves plotted in Figure 7. Thus, the increase in Iθ=0 for PIA-BSA at pH 7.5 is consistent with the formation of a complex comprising of PIA and BSA that is considerably larger in molar mass than either PIA or BSA. The moderate scattering of the PIA-BSA solution at this pH suggests that the size of the complexes is relatively smaller than the self-associated complexes observed at pH 4.9.
On the other hand, at pH 4.9, Iθ=0 of PIA-BSA and PIA solutions are comparable. This congruence shows that the incremental effect of PIA-BSA complex formation on scattering at pH 4.9 is small relative to the dominant effect of PIA self-association. Thus, the higher turbidity in PIA-BSA solutions at low pH is due to a combination of both self-association of PIA and complexation with BSA, with a dominant role for the former mechanism. On the other hand, at pH 7.5, complex formation with BSA is the only significant mechanism for PIA driven association. Finally, at both pH values studied, the scattering enhancement linked to association was observed at all concentrations studied (cPIA > 0.30×10⁻⁴ g/mL). Thus, just as for the case of self-association, we can assign the lower bound of cPIA,Biofilm/ccritical to be 30. Consequently, in addition to PIA-self association, the mechanism of PIA-protein complexation could be significant in biofilm EPS. This complexation occurs at both acidic and neutral pH. Its observation here for PIA is consistent with literature results for other polysaccharide-protein systems, including chitosan-BSA/lactoglobulin 33,43, carrageenan-bovine casein 44 and acacia gum-lactoglobulin 45. Moreover, the functional groups present in PIA chemistry (Figure 1a) are sufficient to support the hydrogen bond, hydrophobic and/or electrostatic interactions that are typical in associating systems 23,43. Finally, the presence of multivalent crosslinking ions could also impact the complexation behavior, analogous to behavior seen in other associating systems such as pectins and alginates46.
CONCLUSIONS
In this study, we measured and compared the average concentrations of PIA in situ for S. epidermidis biofilms (cPIA,Biofilm) to independent measurements of the PIA overlap concentration (c*) and critical association concentration (ccritical) for self-association and complexation with proteins. The comparison required measurement of the molar mass and radius of gyration of high purity PIA, as synthesized by S. epidermidis. We identified that PIA exhibited pH dependent self-association and complex formation with BSA. While the particular associative behavior of PIA reported here has not been previously discussed, our results are consistent with literature reports for structurally similar polysaccharide systems. Furthermore, it was found that cPIA,Biofilm/c* = 0.31 ± 0.07 whereas the lower bound on cPIA,Biofilm/ccritical = 30. Comparison of these two quantities indicates that the viscoelasticity of S. epidermidis biofilm EPS is generated predominantly by associative mechanisms of PIA (Figure 1c), rather than by physical entanglements of the polysaccharide (Figure 1b).
These results suggest the following future directions to better understand the implications of polymer associations in biofilms. First, our findings provide motivation to pursue further studies in which the role of polysaccharide driven association and complexation on biofilm EPS properties is established. For example, results on effects of inorganic multivalent ions, pH, and electric fields on biofilm physical properties such as cohesion and viscosity might be fruitfully explained in the context of these effects 47,48,49. Second, the presence of pH gradients in situ biofilms 50,51 and the pH dependent association of PIA observed in this study together suggest that the EPS microstructure could progressively vary between the interior and exterior regions of the biofilm. This relationship should be examined further because the spatial variation in microstructure could affect the local transport 52 and mechanical properties of biofilms. Third, this paper’s evidence of self-association in PIA strongly motivates the use of rheological models developed for associating polymers to characterize biofilm viscoelasticity 53,54, rather than the competing possibility of entanglement modeling. These associating polymer models could be parameterized by, for example, studying the microrheology of the PIA associated system. Work in this direction will address molecular mechanisms responsible for the unusual biomechanics of biofilms; examples of which include their extraordinary resistance to external shear 30,53, their flow-induced fragmentation 55 and the non-monotonic behavior of their elastic modulus with ionic strength of growth media 11.
Lastly, we would offer up one broader interpretation of our findings as they relate to the construction of EPS-based biofilms by microorganisms. Synthesis and cell-wall translocation of large structural polysaccharides for the purpose of establishing a viscoelastic medium in which to live is a metabolically expensive process but mandatory for survival in such bio-systems. As such, one would expect that selection pressure on biofilm-forming species would yield the most economical means of creating durable extracellular scaffolds, so as to optimize the elastic modulus achieved per unit metabolic energy. The assembly of dense overlapping polysaccharide networks is one possible strategy, but our results indicate at least one competitive alternative: namely the secretion of polymers that are capable of forming elastic networks at concentrations well below their coil overlap concentration by recruiting linking molecules. An idea that warrants further exploration is the possibility that bacteria exploit host proteins for this purpose and therefore generates an additional metabolic savings when forming a safe environment for bacterial proliferation.
Acknowledgments
We thank Derek Pyne for his grateful assistance during the initial stages of this project in the extraction of PIA. Support for this work from the NSF CDI Program (grant PHYS-0941227), the NIGMS (grant GM-069438), and the Petroleum Research Fund, administered by the American Chemical Society (grant ACS PRF# 48872-ND7) are gratefully acknowledged.
Abbreviations
- PIA
Polysaccharide intercellular adhesin
- SEC
size exclusion chromatography
- MALLS
multi angle laser light scattering
- CLSM
confocal laser scanning microscopy
- GlcNAc
N-Acetylglucosamine
References
- 1.Otto M. Nat Rev Microbiol. 2009;7:555–567. doi: 10.1038/nrmicro2182. [DOI] [PMC free article] [PubMed] [Google Scholar]
- 2.Wilking JN, Angelini TE, Seminara A, Brenner MP, Weitz DA. MRS Bull. 2011;36:385–391. [Google Scholar]
- 3.Hall-Stoodley L, Costerton JW, Stoodley P. Nat Rev Microbiol. 2004;2:95–108. doi: 10.1038/nrmicro821. [DOI] [PubMed] [Google Scholar]
- 4.Flemming HC, Wingender J. Nat Rev Microbiol. 2010;8:623–633. doi: 10.1038/nrmicro2415. [DOI] [PubMed] [Google Scholar]
- 5.Flemming H-C, Wingender J, Mayer C, Korstgens V, Borchard W. Symposia-Society for General Microbiology. Cambirge University Press; 1999. pp. 87–106. [Google Scholar]
- 6.Rupp ME, Fey PD, Heilmann C, Götz F. J Infect Dis. 2001;183:1038–1042. doi: 10.1086/319279. [DOI] [PubMed] [Google Scholar]
- 7.Vuong C, Kocianova S, Voyich JM, Yao Y, Fischer ER, DeLeo FR, Otto M. J Biol Chem. 2004;279:54881–54886. doi: 10.1074/jbc.M411374200. [DOI] [PubMed] [Google Scholar]
- 8.Otto M. Semin Immunopathol. 2012;34:201–214. doi: 10.1007/s00281-011-0296-2. [DOI] [PMC free article] [PubMed] [Google Scholar]
- 9.Rohde H, Frankenberger S, Zähringer U, Mack D. Eur J Cell Biol. 2010;89:103–111. doi: 10.1016/j.ejcb.2009.10.005. [DOI] [PubMed] [Google Scholar]
- 10.Di Stefano A, D’Aurizio E, Trubiani O, Grande R, Di Campli E, Di Giulio M, Di Bartolomeo S, Sozio P, Iannitelli A, Nostro A, Cellini L. Microb Biotechnol. 2009;2:634–641. doi: 10.1111/j.1751-7915.2009.00120.x. [DOI] [PMC free article] [PubMed] [Google Scholar]
- 11.Pavlovsky L, Younger JG, Solomon MJ. Soft Matter. 2013;9:122–131. doi: 10.1039/C2SM27005F. [DOI] [PMC free article] [PubMed] [Google Scholar]
- 12.Sutherland I. Microbiology (Reading, England) 2001;147:3–9. doi: 10.1099/00221287-147-1-3. [DOI] [PubMed] [Google Scholar]
- 13.Mayer C, Moritz R, Kirschner C, Borchard W, Maibaum R, Wingender J, Flemming HC. Int J Biol Macromol. 1999;26:3–16. doi: 10.1016/s0141-8130(99)00057-4. [DOI] [PubMed] [Google Scholar]
- 14.Guelon T, Mathias J, Stoodley P. In: Biofilm Highlights. Flemming H-C, Wingender J, Szewzyk U, editors. Vol. 5. Springer Berlin Heidelberg; Berlin, Heidelberg: 2011. pp. 111–139. [Google Scholar]
- 15.De Gennes PG. Scaling concepts in polymer physics. Cornell University Press; 1979. [Google Scholar]
- 16.Wloka M, Rehage H, Flemming HC, Wingender J. Colloid Polym Sci. 2004;282:1067–1076. [Google Scholar]
- 17.Körstgens V, Flemming HC, Wingender J, Borchard W. J Microbiol Methods. 2001;46:9–17. doi: 10.1016/s0167-7012(01)00248-2. [DOI] [PubMed] [Google Scholar]
- 18.Flemming HC. Colloids Surf, B. 2011;86:251–259. doi: 10.1016/j.colsurfb.2011.04.025. [DOI] [PubMed] [Google Scholar]
- 19.Körstgens V, Flemming HC, Wingender J, Borchard W. Water Sci Technol. 2001;43:49–57. [PubMed] [Google Scholar]
- 20.Esquenet C, Buhler E. Macromolecules. 2001;34:5287–5294. [Google Scholar]
- 21.Pedley AM, Higgins JS, Peiffer DG, Rennie AR. Macromolecules. 1990;23:2494–2500. [Google Scholar]
- 22.Gidley MJ. Macromolecules. 1989;22:351–358. [Google Scholar]
- 23.Turgeon SL, Schmitt C, Sanchez C. Curr Opin Colloid Interface Sci. 2007;12:166–178. [Google Scholar]
- 24.Sadovskaya I, Vinogradov E, Flahaut S, Kogan G, Jabbouri S. Infect Immun. 2005;73:2007–3017. doi: 10.1128/IAI.73.5.3007-3017.2005. [DOI] [PMC free article] [PubMed] [Google Scholar]
- 25.Jefferson K, Cerca N. In: Cell-Cell Interactions. Colgan S, editor. Vol. 341. Humana Press; Totowa, NJ: 2006. pp. 119–126. [DOI] [PubMed] [Google Scholar]
- 26.Smith LR, Gilkerson E. Anal Biochem. 1979;98:478–480. doi: 10.1016/0003-2697(79)90170-2. [DOI] [PubMed] [Google Scholar]
- 27.Podzimek S. Light Scattering, Size Exclusion Chromatography and Asymmetric Flow Field Flow Fractionation. John Wiley & Sons, Inc; 2011. pp. 207–258. [Google Scholar]
- 28.Weinhold MX, Sauvageau JCM, Keddig N, Matzke M, Tartsch B, Grunwald I, Kübel C, Jastorff B, Thöming J. Green Chem. 2009;11:498–509. [Google Scholar]
- 29.Joyce JG, Abeygunawardana C, Xu Q, Cook JC, Hepler R, Przysiecki CT, Grimm KM, Roper K, Yu IpCC, Cope L, Montgomery D, Mason C, Sherilyn C, Brown M, McNeely TB, Zorman J, Maira-Litran T, Pier GB, Keller PM, Jansen KU, Mark GE., III Carbohydr Res. 2003;338:903–922. doi: 10.1016/s0008-6215(03)00045-4. [DOI] [PubMed] [Google Scholar]
- 30.Hohne DN, Younger JG, Solomon MJ. Langmuir. 2009;25:7743–7751. doi: 10.1021/la803413x. [DOI] [PMC free article] [PubMed] [Google Scholar]
- 31.Dzul SP, Thornton MM, Hohne DN, Stewart EJ, Shah AA, Bortz DM, Solomon MJ, Younger JG. Appl Environ Microbiol. 2011;77:1777–1782. doi: 10.1128/AEM.01752-10. [DOI] [PMC free article] [PubMed] [Google Scholar]
- 32.Vuong C, Otto M. In: Methods In Molecular Biology. DeLeo F, Otto M, editors. Vol. 431. Humana Press; Totowa, NJ: 2008. pp. 97–106. [DOI] [PubMed] [Google Scholar]
- 33.Guzey D, McClements DJ. Food Hydrocolloids. 2006;20:124–131. [Google Scholar]
- 34.Lin W, Yan L, Mu C, Li W, Zhang M, Zhu Q. Polymer International. 2002;51:233–238. [Google Scholar]
- 35.Maira-Litran T, Kropec A, Abeygunawardana C, Joyce J, Mark G, III, Goldmann DA, Pier GB. Infect Immun. 2002;70:4433–4440. doi: 10.1128/IAI.70.8.4433-4440.2002. [DOI] [PMC free article] [PubMed] [Google Scholar]
- 36.Knobloch JKM, Bartscht K, Sabottke A, Rohde H, Feucht H, Mack D. Infect Immun. 2001;183:2624–2633. doi: 10.1128/JB.183.8.2624-2633.2001. [DOI] [PMC free article] [PubMed] [Google Scholar]
- 37.Mack D, Fischer W, Krokotsch a, Leopold K, Hartmann R, Egge H, Laufs R. J Bacteriol. 1996;178:175–83. doi: 10.1128/jb.178.1.175-183.1996. [DOI] [PMC free article] [PubMed] [Google Scholar]
- 38.Karamanos NK, Panagiotopoulou HS, Syrokou A, Frangides C, Hjerpe A, Dimitracopoulos G, Anastassiou ED. Biochimie. 1995;77:217–224. doi: 10.1016/0300-9084(96)88127-2. [DOI] [PubMed] [Google Scholar]
- 39.Mckenney D, Hübner J, Muller E, Wang Y, Goldmann DA, Pier GB. Infect Immun. 1998;66:4711–4720. doi: 10.1128/iai.66.10.4711-4720.1998. [DOI] [PMC free article] [PubMed] [Google Scholar]
- 40.Vuong C, Otto M. In: Methods in Molecular Biology. DeLeo F, Otto M, editors. Vol. 431. Humana Press; Totowa, NJ: pp. 97–105. [Google Scholar]
- 41.Anthonsen M, Varum K, Hermansson a, Smidsrod O, Brant D. Carbohydr Polym. 1994;25:13–23. [Google Scholar]
- 42.Schatz C, Viton C, Delair T, Pichot C, Domard A. Biomacromolecules. 2003;4:641–648. doi: 10.1021/bm025724c. [DOI] [PubMed] [Google Scholar]
- 43.Kayitmazer AB, Strand SP, Tribet C, Jaeger W, Dubin PL. Biomacromolecules. 2007;8:3568–3577. doi: 10.1021/bm700645t. [DOI] [PubMed] [Google Scholar]
- 44.Burova TV, Grinberg NV, Grinberg VY, Usov AI, Tolstoguzov VB, De Kruif CG. Biomacromolecules. 2007;8:368–375. doi: 10.1021/bm060761f. [DOI] [PubMed] [Google Scholar]
- 45.Schmitt C, Sanchez C, Thomas F, Hardy J. Food Hydrocolloids. 1999;13:483–496. [Google Scholar]
- 46.Braccini I, Pérez S. Biomacromolecules. 2001;2:1089–96. doi: 10.1021/bm010008g. [DOI] [PubMed] [Google Scholar]
- 47.Brindle ER, Miller DA, Stewart PS. Biotechnol Bioeng. 2011;108:2968–77. doi: 10.1002/bit.23245. [DOI] [PubMed] [Google Scholar]
- 48.Stoodley P, DeBeer D, Lappin-Scott HM. Antimicrob Agents Chemother. 1997;41:1876–1879. doi: 10.1128/aac.41.9.1876. [DOI] [PMC free article] [PubMed] [Google Scholar]
- 49.Chen X, Stewart PS. Appl Microbiol Biotechnol. 2002;59:718–720. doi: 10.1007/s00253-002-1044-2. [DOI] [PubMed] [Google Scholar]
- 50.Vroom JM, De Grauw KJ, Gerritsen HC, Bradshaw DJ, Marsh PD, Watson GK, Birmingham J, Allison C. Appl Environ Microbiol. 1999;65:3502–3511. doi: 10.1128/aem.65.8.3502-3511.1999. [DOI] [PMC free article] [PubMed] [Google Scholar]
- 51.Ganesh AB, Radhakrishnan TK. Sens Actuators, B. 2007;123:1107–1112. [Google Scholar]
- 52.Rani SA, Pitts B, Stewart PS. Antimicrob Agents Chemother. 2005;49:3502–3511. doi: 10.1128/AAC.49.2.728-732.2005. [DOI] [PMC free article] [PubMed] [Google Scholar]
- 53.Klapper I, Rupp CJ, Cargo R, Purvedorj B, Stoodley P. Biotechnol Bioeng. 2002;80:289–296. doi: 10.1002/bit.10376. [DOI] [PubMed] [Google Scholar]
- 54.Chassenieux C, Nicolai T, Benyahia L. Curr Opin Colloid Interface Sci. 2011;16:18–26. [Google Scholar]
- 55.Stoodley P, Cargo R, Rupp CJ, Wilson S, Klapper I. J Ind Microbiol Biotechnol. 2002;29:361–367. doi: 10.1038/sj.jim.7000282. [DOI] [PubMed] [Google Scholar]


