Abstract
Current biological models of epigenetic switches built on chromatin modifications lead to strong constraints on the repertoire of dynamic behaviors for the system. We use the structure of the bifurcation diagram of the underlying dynamical system to explain the existing single cell data in silencing by the SIR system in yeast.
Keywords: Silencing, bistability, epigenetics
1. Introduction
The possibility of having multiple heritable cell fates without modifying the underlying genomic sequence involves persistent transcriptional repression or activation of certain genes, over many cycles of cell division. Such gene regulation, the subject of the field of epigenetics (Allis et al., 2007), is crucial in eukaryotic development where specialized cells with identical genetic information differentiate to serve distinct functions. In eukaryotes, chromatin modification has an important role in epigenetic processes. The basic unit of chromatin packaging is the nucleosome comprising DNA wrapped around a histone octamer core (Lodish et al., 2004). Covalent post-translational modifications of these histones, sometimes called histone ‘marks’, are critical players in cellular memory. These modifications create favorable binding sites for specific regulatory proteins, which in turn control transcriptional activation and repression, as well as other cellular processes. From the Silenced Information Regulator (SIR) proteins in budding yeast (see Chapter 4, of the book (Allis et al., 2007)), regulating the repression of gene expression at hidden mating type loci and telomeres (Lodish et al., 2004), to silencing of developmentally important Hox genes in metazoans by the Polycomb group of proteins (Gilbert, 2003), mechanisms of chromatin silencing involve enzymes that can act on more than one nucleosome in its neighborhood (Grewal and Moazed, 2003). This non-locality of action opens up the possibility of collective phenomena generating stable distinct epigenetic states.
In particular, we will focus on the SIR system in budding yeast S. cerevisiae (Rusche et al., 2003) which is responsible for silencing of the rDNA, the telomeres and the hidden mating type loci. The transcriptionally active regions of the chromatin are characterized by acetylation marks on H4K16, a particular lysine in the N-terminal tail of H4 which is a component of the histone octamer. In some transcriptionally silent regions, the lysine H4K16 is ‘unmodified’. The loss of acetylation mark or deacetylation is due to Histone deacetylase (HDAC) activity of the enzyme Sir2p. In the telomeres and the hidden mating type loci, unmodified/deacetylated H4K16 leads to recruitment of a complex of Sir3p/Sir4p which in turn recruits more Sir2p. This process could lead to spreading of transcriptional silencing associated with the loss of the acetylation mark and resulting SIR complex occupancy. This model of silencing is sometimes referred to as the ‘railroad’ model.
Although this model of spreading appears to be quite universal, the degree to which individual genes get silenced depends upon many local features, even for genes engineered to be driven by the same promoter. Exactly what features are important for these differences are difficult to dissect. What we propose here is a phenomenological approach, for making sense of single cell gene expression data from two distinct loci, under multiple perturbations.
2. The importance of not being earnest
A common practice in modeling biochemical networks is to introduce as much known details as possible and try to get as much information as possible on parameters in the model. The trouble with such an approach comes from two fronts. For any system under active research, there would always be new biological facts that has not yet been discovered. On top of that, many systems, like the SIR system in yeast, where the network is characterized to a great extent via genetic analysis, reliable quantitative biochemical parameters are hard to come by. Often the extra effort spent in creating a complex model offers only an illusion of realism.
One might ask whether there is any merit in making a quantitative model in such a case. We like to claim that building mathematical models could be useful for qualitative predictions. In the context of this work, we want to start from a reasonable model to obtain the nature of the bifurcation diagram, and make predictions based on relatively detail-independent qualitative features of the model. We seem to be able to make robust conclusions about the systems that are testable experimentally. The construction of the model helps in setting up the correspondence between parameter changes and perturbations to the real system, be it by mutation or by external conditions.
In that spirit, let us consider the epigenetic nature of hidden mating type loci in mutants of S. cerevisiae (Pillus and Rine, 1989). Functionally, silenced regions in wild type yeast are always silenced. However, certain mutants (for example, sir1) ‘silenced’ gene stays OFF or ON for several generations before switching to the other state (Allis et al., 2007). These mutants therefore serve as an attractive model system for studying epigenetic phenomena.
3. Structure of the SIR model and the associated bifurcation diagram
We formulated a quantitative version (Sedighi and Sengupta, 2007) of the conventional biological model of silencing (Grewal and Moazed, 2003). The main variables involved in final equations are the local degree of acetylation and the local probability of occupation by SIR complex, both of which could depend on time, as well as on the position of nucleosomes on DNA, represented as a one-dimensional lattice. We define function, Si(t) on this lattice, as a number between 0 and 1, to represent fractional number of SIR complexes at site i. Fractional degree of acetylation, Ai(t), is defined in the same way too. The chemical equations within a mean-field treatment of the system are
| (1) |
| (2) |
In equation (1), the first term on the right hand side is the SIR complex binding rate and the next term is the SIR complex unbinding rate. The ease of availability of SIR complex components in the solution near chromatin is represented by a single concentration ρ(t), which is generally a function of time. Since free SIR proteins in the environment do not form SIR complexes by themselves, this quantity actually represents a function of concentrations of all components (Sir3, Sir2 and Sir4) that are ready to form a SIR complex on the site. For example, in the simplest case, when each protein is in low abundance, this function would be proportional to the product of the three concentrations. However, throughout this paper we will not need to go into the details of this function. The function f(1 – A) dictates the cooperativity in SIR complex binding. The function η(A) is the acetylation dependent fall off rate of bound SIR complexes.
In equation (2), the parameter α represents the acetylation rate. In the second term, the summation accounts for the contribution of adjacent SIR complexes in deacetylation of site i. Since SIR complex is only capable of deacetylation of sites in its neighborhood, γij is assumed to be symmetric with respect to its indices and drop significantly as |i – j| gets large. Finally, λ is the rate of deacetylation from the rest of deacetylase proteins. This rate is assumed to be a constant both in time and position. The potential negative effect of silencing on the effective acetylation is captured by the function g(1 – S).
All three functions f(x), g(x), η(x) should be a monotonically increasing function of x, 0 ≤ x ≤ 1. We use f(x) = xn, n ≥ 1, where n is the degree of cooperativity between deacetylated histone tails in recruiting SIR proteins, and g(x) = g0 + xm, m ≥ 1. We could take η(x) = η0 + cx. In our previous work (Sedighi and Sengupta, 2007), c was taken to be zero.
The biochemical basis of the high cooperativity is not very clear. We believe that this cooperativity becomes necessary because of not having some other degrees of freedom (like certain methylation marks, and the status of local transcription) explicitly. Writing a model with all these degrees of freedom and then eliminating them could produce a model with a smaller number of variables, but higher degree of nonlinearity.
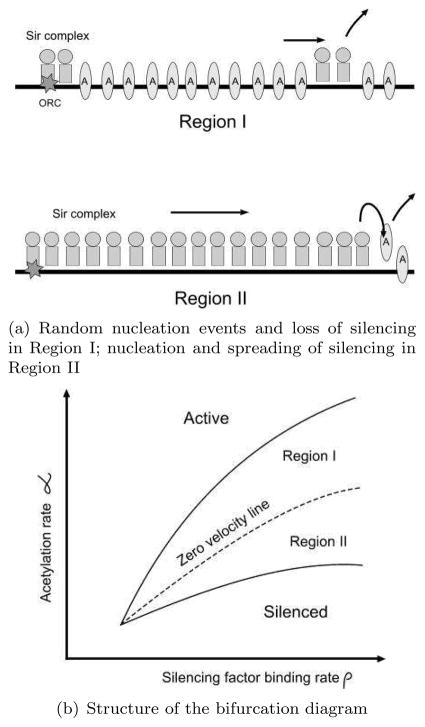
Although we wrote down a model with a time dependent ρ(t), we will first analyze the system with constant ρ, which can be treated as one of the parameters of the model. For a bistable system, it is common to explore its behavior on varying two parameters and holding the others fixed. The bifurcation diagram of such a system often shows the cusp geometry where two branches of fold bifurcations meet. In addition, for extended systems, the region of bistability is further subdivided into different regions depending upon how a domain wall formed between two different states will move (Fig. 1).
Figure 1.
Bistability and spreading in the model of silencing
In case of a model like ours, one would start with the uniform static solutions of Eq. (1) and Eq. (2), which are determined by real roots of algebraic equations. In this model, bistability is signatured by the presence of three roots. Boundaries of the region of bistability correspond to values of parameters, in this case α and ρ, where two of these three roots merge. The condition of merger of roots gives rise to an additional equation in the variables and parameters. These equations could be solved numerically. To further subdivide the region of bistability according to how the domain wall between two states move, one could simulate nonuniform solutions and measure domain wall velocity.
In the reference (Sedighi and Sengupta, 2007), the bifurcation diagram from a particular class of models were computed and discussed. We have since looked at models with greater degree of complexity (Mukhopadhyay and Sengupta, manuscript in preparation). In this paper, we emphasize the generic structure of the bifurcation diagram which is not very dependent upon the details of the models we have analyzed so far. The region leading to bistability is further subdivided (see Fig. 1). In ‘Region I’, the active domain displaces silenced domain in contact. Nucleation of silencing produces a finite domain of influence but cannot spread silencing beyond it. In ‘Region II’, the domain wall between the silenced and the active region moves so as to spread silencing into the active region (this case is sketched in Fig. 1). Between these two regions is the ‘line’ of zero domain wall velocity. A technical detail to note is that in a lattice model (without incorporating stochastic fluctuations), this line expands into a band of propagation failure. We are really dealing with a stochastic system and in that case, within the band of propagation failure, one sees slow average drift one way or another except on a line where this average drift is vanishing. We will keep on referring to the ‘zero velocity line’, mindful of the existence of a band around this line where the average drift velocity of the domain wall could be very slow compared to the velocity elsewhere in the bistable region of the parameter space.
This bifurcation diagram describes a much richer repertoire of phenotypes than the simple ‘railroad’ model. In particular, silencing could be of two different categories. In Region I, the silencing proteins are localized around a nucleation center, created for example, by the the interaction of Sir1p and ORC (Rusche et al., 2003). The range of silencing is decided upon by how spread out the localized patches are and over what range a bound silencer can have an enzymatic effect, which in turn is captured by the structure of γij in our model (see Fig. 1 and Eq. (2)). Typically, in Region I silencing is patchy and weak whereas Region II corresponds to the usual ‘railroad’ model which might require boundary elements to stop the spread of silencing beyond the genes targeted. In addition there are regions characterized by monostability. Part of our goal in this paper is to utilize qualitative features of this bifurcation diagram to make sense of experimental observations. In retrospect, we provide evidence for the utility of mathematical modeling in the silencing system.
4. Interaction between loci through titration effects
Now we consider the effect of ρ(t) not being constant. We model the limited supply of SIR proteins by putting a constraint on the total number of SIR complexes, in solution and bound to the nucleosomes. The quantity ρ(t) in original equations (1) and (2) is determined by the condition:
| (3) |
where Stotal is the total number of functional SIR complexes in the system, which is constant and V represents the average volume.
When Σk Sk(t) is comparable to Stotal, this constraint acts as a negative feedback on the silencing system, since increase of silencing, namely Σk Sk(t), reduces ρ(t), thereby lowering the rate of formation of new silencing complexes. This process, when in action, affects every locus. This global negative feedback therefore ends up coupling different regions where silencing could take place.
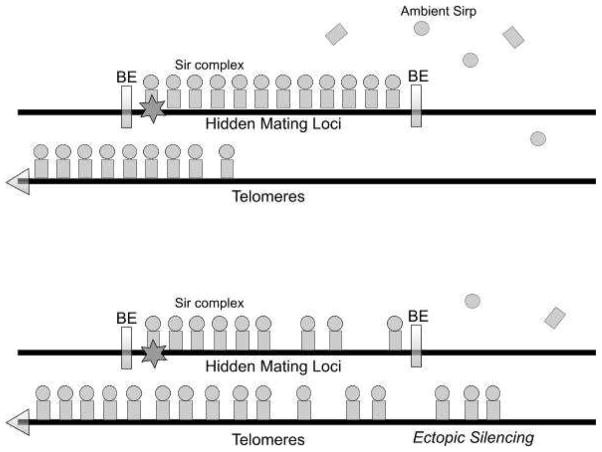
To give a particular example, consider the result of lowering the activity of Sas2p—an acetyl transferase which acetylates lysine 16 in the H4 tail (Kurdistani and Grunstein, 2003). This activity counters the deacetylation by Sir2p (Fig. 2). In the quantitative model, lowering Sas2p activity is equivalent to lowering α. Under some circumstances, this lowering will land the system in to Region II in Fig. 1. In this region, silencing wins by spreading into the active region. Some of the silenced regions, like HMR, have well defined boundary elements that disrupt the contact between the two kinds of states. However, at telomores the boundary is defined in part by the balance of the global acetylation activity of Sas2p and the opposing Sir2p deacetylation activity, both at H4K16 (Suka et al., 2002; Kimura et al., 2002). In this region the boundary of the silenced region is mobile (Fig. 3). The process of spreading beyond usually silenced domains has been called ectopic silencing (meaning silencing occurring in an abnormal position or place; displaced silencing).
Figure 2.
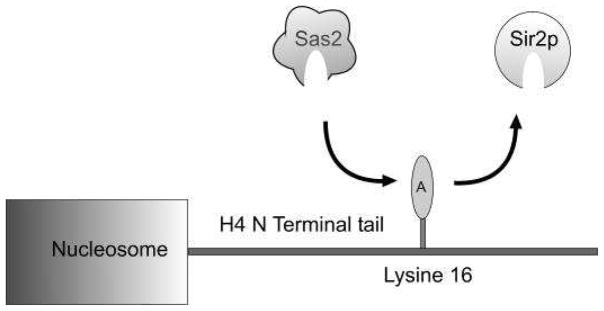
Sas2p is one of the main enzymes that specifically targets H4K16 for acetylation and counters the deacetylation by Sir2p.
Figure 3.
A global perturbation, which brings the system to Region II, may lead to ectopic silencing and reduction in the overall strength of silencing. This would particularly in affect silenced regions that do not have well-defined boundary elements. This is because of rampant spread of silencing and titration of ambient SIR proteins. The unperturbed system is represented by the top half of the figure and the perturbed system, by the bottom half. BE = Boundary elements.
The result of excessive ectopic silencing is the lowering of ρ, because spreading of silencing ‘titrates’ away free silencers. This process continues till the system moves to the zero velocity line (Fig. 1). Previous work (Sedighi and Sengupta, 2007) involving one of the authors have shown how this titration effect might result in sas2 mutants being very close to the cusp in the bifurcation diagram, producing an unimodal but wide distribution of gene expression.
5. Coupled bifurcation diagrams
So far our discussion has not been paying attention to the heterogeneity of the genome. In this section, we discuss a framework for treating results of perturbation for distinct loci. The motivation for this analysis is availability of single cell gene expression data from two loci. In this section we discuss the interaction between different loci, within the framework introduced above.
Let us briefly describe the experiments (Xi et al., 2006) we are trying to understand. In these experiments, each hidden mating locus had a gene for fluorescent protein inserted: yellow fluorescent protein (YFP) for HML and cyan fluorescent protein (CFP) for HMR. The promoter for these genes is the same as that of URA3 which is up-regulated by the activator Ppr1p. Among other things, distribution of fluorescence in the YFP and the CFP channels were measured for different strains by single-cell intensity analysis of fluorescent-microscopy images. The results are summarized in Table 1.
Table 1.
Summary of results on expression from the hidden mating type loci (Xi et al., 2006).
| Locus | sir1 | sas2 | ppr1 sir1 | ppr1 sas2 |
|---|---|---|---|---|
| HML-YFP | slightly bimodal | Intermediate | mostly OFF | mostly OFF |
| HMR-CFP | mostly ON | mostly OFF | bimodal | mostly OFF |
The strains in question are sir1, which is deficient in nucleation of silencing, sas2, which has a deficiency in acetylation rate for H4K16, as well as ppr1 sir1 and ppr1 sas2, in which additional mutation of PPR1 made the promoter of the genes particularly weak.
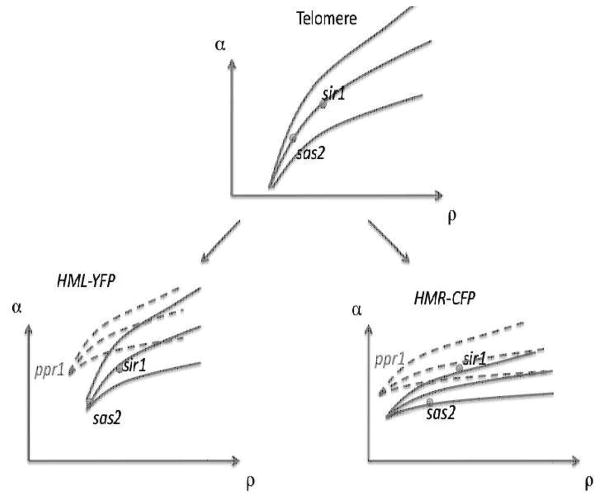
In Fig. 4 we have three diagrams, related to the idealized telomere, the HML-YFP and the HMR-CFP. In our view, the telomeres set the value of the self-consistent ρ for given α, by keeping the point on the zero velocity line. Note that the genes in the hidden mating type loci are artificial constructs. We consider the α and ρ to be locus independent for each strain. However, we let the local bifurcation diagrams to be different. These differences arise from the local variations in other factors not explicitly in the model, like basal level of gene expression. The sir1 and sas2 strains are represented by points on the bifurcation diagram, and are shared by the intact and ppr1 strains. The bifurcation diagrams with the solid lines are for the strains with intact PPR1 genes. The dashed lines represent the bifurcation diagram of ppr1 strains. These diagrams are drawn to be consistent with the observations. For example, the HMR-CFP bifurcation lines are such that, for sir1 strain, most cells are not silenced. The placement sir1 with respect to HML-YFP is consistent with the bimodality of the expression mentioned in the table. If the domain wall velocity is high (positive or negative), usually one state or the other dominates. We could put sas2 below the region of bistability for HMR-CFP. As we will see, it does not change the conclusion for what happens with additional PPR1 mutation.
Figure 4.
Bifurcation diagram of three regions coupled by shared parameters α, ρ. The dashed lines correspond to the bifurcation diagram of the loci for additional mutation in the PPR1 gene.
Now we consider the effect of PPR1 mutation. Although, we do not know exactly how the dynamics is affected by lack of an activator, we might expect the bifurcation diagram to shift to higher α and lower ρ. This is because the promoter of the reporter gene is weakened, making silencing more effective at lower ambient concentration of SIR proteins. The results are consistent with what is seen in ppr1 strains. For example, ppr1 sir1 shows bimodality in the CFP expression but is mostly repressed in YFP.
A more thorough experimental study would traverse the whole two dimensional plane. Since the parameter ρ self-adjusts (and therefore is really a variable rather than a parameter), we need an alternative dialing knob to control silencing activity. One such knob is described in the next section.
6. Hysteresis
Epigenetics requires a slow time scale of change in the units of cell division time. There are many ways of arranging such a slow time scale. One possibility is the low rate of an elementary process. An example would be a low rate of de novo DNA methylation, for C-p-G methylation based epigenetic marks. In the system we looked at, we cannot separately treat a small subsystem (say one nucleosome), and the slow time scale is best understood in terms of nonlinearity induced bistability. We have argued so far that such a picture is useful for understanding the single cell data. We wish to get more direct evidence of the validity of this approach.
One of the signatures of the non-linearity induced bistability is hysteresis (history dependent response). Experimentally, one could use an inhibitor of Sir2p, nicotinamide (NAM), to modulate its activity (Bitterman et al., 2002) (Fig. 5). This is roughly equivalent to changing the average γ in our model, see Eq. 2. However, the challenge in observing hysteresis is that the global negative feedback from titration might be strong enough to eradicate the hysteresis effects that we otherwise expect. In order to resolve this question we have performed some preliminary experiments, the results from which are presented below.
Figure 5.
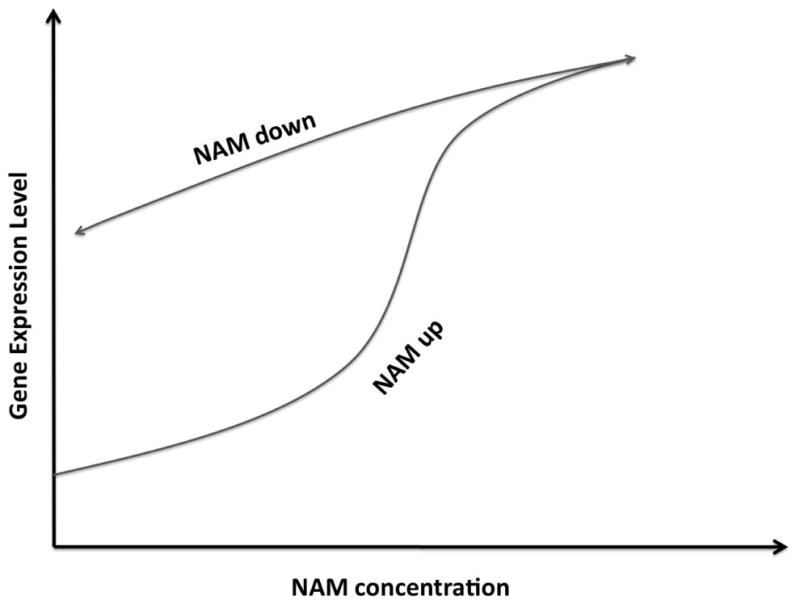
Potential hysteresis under perturbation by nicotinamide (NAM).
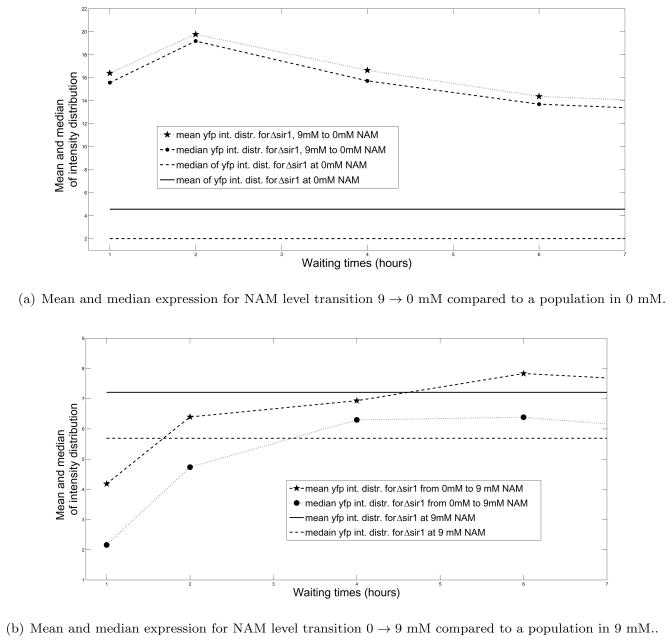
We grow sir1 strains with built-in fluorescent reporters (gift from Broach lab) in NAM and monitor HML-YFP activity as we change the level of nicotinamide (Fig. 6). We use a Nikon TE2000S inverted microscope to collect images of cell populations at 100X magnification. Images were collected in the DIC channel and fluorescence channels. DIC images were segmented to find out cell outlines, which were used for extracting total fluorescence signal from each cells. Several hundred cells were queried for each condition.
Figure 6.
Different relaxation time scales for the system at different levels of NAM.
At 9 mM NAM, most cells express high levels of YFP (monostable), whereas at 0 mM NAM, only a fraction does so (bistable). When the cells grown in 9 mM NAM is shifted to 0 mM, it does not relax to the mean/median expression level of the cells grown in the absence of NAM. On the other hand if cells grown without NAM are shifted to 9 mM NAM, the level of expression settles down to that of cells grown at 9 mM NAM within a few generations. These results bear early evidence of history dependence response and bistability in epigenetic silencing mechanism.
Before we leave this section, let us briefly contrast our perturbations to the natural perturbations the system endures as it goes through the cell cycle. Note that sir1 strains maintain their state of expression through many cell divisions (Pillus and Rine, 1989). We suspect that the perturbation provided by cell cycle, say during S phase, does not take the system out of the basin of attraction of each of the states, unlike what happens in our experiments. For further discussion of how some of the states recover from the diluting effect of the cell cycle, see David-Rus et al. (2006).
7. Conclusion
In conclusion, we suggest that there is a rich set of phenomena in chromatin silencing where qualitative predictions from systems biology would be useful. In the context of the SIR system, we can make sense of the expression phenotype of many mutants as well as the response to certain perturbations, using the bifurcation diagram of the system. Extension of this approach to position effect variegation and to polycomb silencing would be of great interest.
Acknowledgments
We acknowledge useful discussions with James Broach, Adel Dayarian and Marc Gartenberg. We also thank the Broach lab for providing strains for our experimental investigations. This work was partially supported by an NHGRI Grant No. R01 HG03470-02.
Contributor Information
Swagatam Mukhopadhyay, Email: swagatam@rci.rutgers.edu.
Vijayalakshmi H. Nagaraj, Email: viji@waksman.rutgers.edu.
References
- Allis CD, Jenuwein T, Reinberg D, editors. Epigenetics. Cold Spring Harbor Laboratory Press; Cold Spring Harbor, NY: 2007. [Google Scholar]
- Aronson D, Weinberger H. Non-linear diffusion in population genetics and nerve pulse propagation. In: Goldstein J, editor. Partial Differential Equations and Related Topics. Vol. 446 of Springer Lecture Notes in Mathematics. Springer; NY: 1975. pp. 5–49. [Google Scholar]
- Bitterman KJ, Anderson RM, Cohen HY, Latorre-Esteves M, Sinclair DA. Inhibition of Silencing and Accelerated Aging by Nicotinamide, a Putative Negative Regulator of Yeast Sir2 and Human SIRT1. J Biol Chem. 2002;277:45099–45107. doi: 10.1074/jbc.M205670200. [DOI] [PubMed] [Google Scholar]
- David-Rus D, Mukhopadhyay S, Lebowitz JL, Sengupta AM. Inheritance of epigenetic chromatin silencing. J Theor Biol. 2009;258:112–20. doi: 10.1016/j.jtbi.2008.12.021. [DOI] [PMC free article] [PubMed] [Google Scholar]
- Gilbert S. Developmental Biology. Sinauer; Sunderland, MA: 2003. [Google Scholar]
- Grewal SIS, Moazed D. Heterochromatin and epigenetic control of gene expression. Science. 2003;301:798–802. doi: 10.1126/science.1086887. [DOI] [PubMed] [Google Scholar]
- Kimura A, Umehara T, Horikoshi M. Chromosomal gradient of histone acetylation established by Sas2p and Sir2p functions as a shield against gene silencing. Nature genetics. 2002;32:370–377. doi: 10.1038/ng993. [DOI] [PubMed] [Google Scholar]
- Kurdistani SK, Grunstein M. Histone acetylation and deacetylation in yeast. Nature Reviews Molecular Cell Biology. 2003;4:276–284. doi: 10.1038/nrm1075. [DOI] [PubMed] [Google Scholar]
- Lodish H, et al. Molecular Cell Biology. WH Freeman; New York, NY: 2004. [Google Scholar]
- Ozbudak EM, Thattai M, Lim HN, Shraiman BI, van Oudenaarden A. Multistability in the lactose utilization network of Escherichia coli. Nature. 2004;427:737–740. doi: 10.1038/nature02298. [DOI] [PubMed] [Google Scholar]
- Pillus L, Rine J. Epigenetic inheritance of transcriptional states in S. cerevisiae. Cell. 1989;59:637–647. doi: 10.1016/0092-8674(89)90009-3. [DOI] [PubMed] [Google Scholar]
- Rusche LN, Kirchmaier AL, Rine J. The establishment, inheritance and function of silenced chromatin in Saccharomyces cerevisiae. Annu Rev Biochem. 2003;72:481–516. doi: 10.1146/annurev.biochem.72.121801.161547. [DOI] [PubMed] [Google Scholar]
- Sedighi M, Sengupta AM. Epigenetic chromatin silencing: bistability and front propagation. Phys Biol. 2007;4:246–255. doi: 10.1088/1478-3975/4/4/002. [DOI] [PMC free article] [PubMed] [Google Scholar]
- Suka N, Luo K, Grunstein M. Sir2p and Sas2p opposingly regulate acetylation of yeast histone H4 lysine16 and spreading of heterochromatin. Nature genetics. 2002;32:378–383. doi: 10.1038/ng1017. [DOI] [PubMed] [Google Scholar]
- Xu EY, Zawadzki KA, Broach JR. Single-cell observations reveal intermediate transcriptional silencing states. Mol Cell. 2006;23:219–229. doi: 10.1016/j.molcel.2006.05.035. [DOI] [PubMed] [Google Scholar]


