

Abstract
GLT1, the predominant glutamate transporter of the forebrain, exists in two splice variant isoforms, i.e. GLT1a and GLT1b. Although GLT1 was originally only detected in astrocytes, we have recently demonstrated that GLT1a protein is expressed by neurons in the hippocampus as well. In the present study, the mRNA distribution patterns for the two isoforms were examined throughout the rat brain using non-isotopic in situ hybridization and variant specific RNA probes. Both isoforms were expressed in neuronal subgroups outside the hippocampus such as in the cerebral cortex layer VI, or the neurons in the olfactory tubercle. Similar to the hippocampus, GLT1a was the predominant transcript in neurons. Both GLT1 isoforms were widely expressed in astrocytes throughout the brain. GLT1a mRNA expression in astrocytes showed noticeable variation in labeling intensity in subregions of the hippocampus and other areas, whereas GLT1b expression in astrocytes was relatively homogeneous. On the subcellular level, GLT1a mRNA was primarily expressed in astrocyte processes, whereas GLT1b mRNA was more restricted to the astrocyte cell body. The two isoforms showed similar distributions in the subfornical organ and in tanycytes of the third ventricle. However, GLT1 expression in the pineal gland and the retina was primarily due to GLT1b, whereas GLT1a was more strongly expressed in Bergman glia in the cerebellum. These findings suggest that the expression of the two GLT1 isoforms is regulated by different mechanisms. Moreover, the function of the two isoforms may be subject to different regulatory processes.
Indexing terms: uptake, presynaptic, alternative splicing, excitotoxicity, excitatory, synapse
Glutamate transporters fulfill important functions in excitatory neurotransmission in the brain. By removing glutamate from the extracellular compartment after presynaptic firing, they contribute to the input specificity of excitatory synapses, and they protect against glutamate neurotoxicity (Mangano and Schwarcz, 1983; Rosenberg et al., 1992; Tanaka et al., 1997; Rusakov and Kullmann, 1998). Malfunction and reversal of glutamate transport during energy failure caused by hypoxia or ischemia can lead to neurotoxic levels of extracellular glutamate and subsequent neurodegeneration (Szatkowski et al., 1990; Storm-Mathisen et al., 1992; Madl and Burgesser, 1993; Rossi et al., 2000).
The glutamate transporter GLT1 is one of five glutamate transporters isolated so far from the brain (GLAST, EAAC1, EAAT4, and EAAT5 being the others in rat). GLT1 protein is expressed at very high concentrations in cerebral cortex and hippocampus, and on the basis of knockout studies accounts for 94% of glutamate uptake in the forebrain (Tanaka et al., 1997). Immunocytochemical studies have shown that GLT1 protein is strongly expressed primarily by astrocytes in the brain (Rothstein et al., 1994; Schmitt et al., 1996; Danbolt, 2001). However, mRNA for GLT1 has also been observed in a number of neuronal subgroups, most notably the CA3 neurons of hippocampus in the mature brain (Torp et al., 1995; Schmitt et al., 1996; Torp et al., 1997; Berger and Hediger, 1998). Yet, an associated expression of GLT1 protein in these neurons had not, until recently, been observed (Danbolt, 2001).
Recent work has revealed that GLT1 exists in two variant splice isoforms, GLT1a and GLT1b, that differ in their 3′ untranslated region (Utsunomiya-Tate et al., 1997; Chen et al., 2002; Schmitt et al., 2002). This variation in splicing apparently does not affect the transport characteristics of the isoforms (Utsunomiya-Tate et al. 1997; Chen et al., 2002; Sullivan et al., 2004). We have demonstrated that immunoreactivity for GLT1a and GLT1b can indeed be found in cerebral neurons in culture (Chen et al., 2003). Using electron microscopy, we have found that GLT1a protein is associated with axon terminals in the rat hippocampus. The precise distribution of GLT1b protein, however, in the brain is as yet unclear, because of questionable specificity of anti-GLT1b antibodies (Chen et al., 2003). These findings suggest that GLT1 is responsible not only for glutamate removal into astrocytes, but also for reuptake into presynaptic terminals.
In the present study, we examined GLT1a and GLT1b mRNA expression in neurons and astrocytes in the hippocampus as well as other regions of the adult rat brain. In particular, we investigated whether there exist differences in regional expression levels of the transporter isoforms and in their subcellular localization. Also, the analysis focused on areas where we have previously found unique expression for GLT1 mRNA, such as the tanycytes of the third ventricle, the subfornical organ, and the pineal gland, among others (Berger and Hediger, 1998, 2000, 2001).
MATERIALS AND METHODS
In situ hybridization on rat brain sections
Sprague-Dawley rats were anesthetized with an i.p. injection of pentobarbital (50–100mg/kg), and then killed by decapitation. Single label non-isotopic in situ hybridization was performed using digoxigenin (DIG)-labeled cRNA probes and alkaline phosphatase (AP) detection as described (Berger and Hediger, 1998). For co-localization experiments, double label in situ hybridization was performed, using DIG-labeled probes detected with AP for observation with brightfield optics, and fluorescein (FITC)-labeled probes detected through several amplification steps and the CY3 fluorophore for observation with fluorescence optics, as described in detail previously (Berger and Hediger, 1998). Briefly, cryostat sections of fresh frozen brain were cut at 10 μm thickness, fixed in 4% paraformaldehyde and acetylated. Hybridization was performed in slide mailers by total immersion in hybridization buffer that contained 50% formamide, 5x SSC, 2% blocking reagent (Roche Applied Science, Indianapolis, IN), 0.02% SDS, 0.1% sarcosine, and cRNA probe. Sections were hybridized at 68°C over 72 hours with the full-length rat GLT1 probe (1.8 kb, hydrolyzed to 500 b using alkaline hydrolysis) or with specific 3′-untranslated region (UTR) probes for GLT1a (315 b, nucleotides 1008–1322, accession # AY069978) or GLT1b (391 b, nucleotides 1137–1527, accession # AF451299). For the majority of experiments, probes were precipitated with 4 M LiCl and ethanol after transcription and alkaline hydrolysis, and used at an approximate concentration of 100 ng/ml, as determined using UV absorbance. For some experiments, probes were purified after transcription with RNeasy MinElute columns (Qiagen, Valencia, CA), and their concentration was measured with a NanoDrop Spectrophotometer (Nanodrop Technologies, Rockland, DE), before being used at precise concentrations of 20 and 240 ng/ml. There was no significant homology between the probes for GLT1a and GLT1b. Northern blot analysis of total RNA using these GLT1a and GLT1b probes has been published previously (Chen et al., 2002). For double in situ hybridization, a 2.2 kb long, FITC-labeled GLAST probe, hydrolyzed to about 500 bases, was co-incubated with each of the DIG-labeled GLT1 probes.
Washing steps included incubations in 2xSSC and 0.2xSSC at 68°C. For single label hybridization, sections were incubated at room temperature in 1% blocking reagent in maleic acid buffer, then in AP-conjugated anti-digoxigenin Fab fragments (1:5000 dilution, 1 hour to overnight, Roche), and developed overnight or over 2 nights with BCIP/NBT substrate (Kierkegard and Perry Laboratories, Gaithersburg, MD). For double label in situ hybridizations, sections were first blocked with avidin and biotin (Vector Laboratories, Burlingame, CA) before subsequent incubations in: a) 1% blocking reagent; b) AP-conjugated anti-digoxigenin Fab fragments (1:5000) and mouse anti-FITC antibodies (1:500, Roche); c) biotinylated anti-mouse antibodies (1:500); d) streptavidin-HRP; e) biotinylated tyramide (TSA reaction, Perkin-Elmer, Boston, MA); f) BCIP/NBT (overnight); and g) streptavidin-CY3. Sections were rinsed several times in 100 mM Tris, 150 mM NaCl, 20 mM EDTA pH 9.5, and coverslipped with glycerol gelatin (Sigma, St. Louis, MO). Control sections were incubated in an identical concentration of the sense probe transcript. Color photographs were taken using a Nikon E600 microscope and a SPOT digital camera. Adobe Photoshop 7.0 software was used to combine pictures in panels, and to convert to black and white. Contrast was increased slightly for all pictures in a panel at the same time using the levels and/or curves function. All results shown were observed in at least four different independent experiments.
This research was approved by the Children’s Hospital Institutional Animal Care and Use Committee and fully conforms to National Institutes of Health guidelines.
RESULTS
Regional distribution of GLT1a and GLT1b
The distribution of GLT1 mRNA isoforms was examined with selective riboprobes to the 3′-UTRs of GLT1a and GLT1b, and the results were compared to the labeling obtained with a pan probe against the coding region that recognizes both isoforms (Berger and Hediger, 1998). Since the 3′-UTR probes were about five times smaller than the pan probe, they produced significantly weaker labeling than the pan probe when developing parameters were kept identical. Thus, in order to compare distribution patterns, the pan probe was, in some cases, incubated a shorter period in anti-digoxigenin antibody (1 hr versus overnight), and the development was stopped after 4–24 hours compared to the 48 hours for the GLT1a and GLT1b probes. For most experiments, probes were precipitated after transcription and used at approximately 100 ng/ml. Since the GLT1a probe was about 20% shorter only a qualitative comparison of labeling intensities was possible. Figure 1 shows low-power views of GLT1pan, GLT1a and GLT1b labeling in cerebral cortex and hippocampus, in the olfactory tubercle, cerebellum and spinal cord. Generally, the distribution of GLT1a- and GLT1b-labeled cells was similar with the exception of labeling of neurons. If the labeling patterns were combined they would resemble the labeling seen with the GLT1pan probe (Fig. 1A, D, G, J). GLT1a was the dominant mRNA isoform in neurons such as in the CA3 region in the hippocampus (Fig. 1B, arrowhead) or in the anterior olfactory nucleus (Fig. 1E, arrowhead). GLT1b labeling was basically not detectable in these neuronal subgroups at this magnification (Fig. 1C, 1F, arrowheads). In the cerebellum, both GLT1a and GLT1b were expressed in Bergmann glia, and in astrocytes in the granule cell layer (Fig. 1H, 1I) but GLT1a was expressed at clearly higher levels. In the spinal cord, both GLT1a and GLT1b were expressed in astrocytes evenly throughout the gray and white matter areas (Fig. 1K, 1L). No neuronal cell bodies were labeled with any probe in the spinal cord.
Figure 1. Overview of GLT1a and GLT1b mRNA expression in brain and spinal cord.

GLT1 mRNA labeling in rat brain using probes covering the full length GLT1 coding sequence (GLT1pan, A, D, G, J), or specific stretches of the 3′-UTR sequence of GLT1a (B, E, H, K) and GLT1b (C, F, I, L). Regions shown are cerebral cortex and hippocampus (A–C), dorsal olfactory tubercle including the anterior olfactory nucleus (D–F), cerebellum (G–I), and spinal cord (J–L). GLT1a and GLT1b labeling patterns are similar and the combination of them equals the labeling seen with the GLT1pan probe. GLT1a is the predominant GLT1 mRNA expressed in the CA3 pyramidal cells in hippocampus (B, arrowhead) or the neurons of the dorsal olfactory nucleus (E, arrowhead). Generally GLT1a and GLT1b labeling in astrocytes appear similar in intensity, though Bergmann glia in cerebellum are more intensly labeled for GLT1a than for GLT1b. Inserts in G–I and J–L show magnifications of Bergmann glia (arrows in H, I) in cerebellum and astrocytes in the ventral horn, respectively. Bars: C, L 200 μm; F, I 100 μm.
Expression in neurons
We have previously demonstrated with a differential fluorescent double-labeling technique, in which the fluorescent astrocytic GLT1 signal is blocked by the NBT/BCIP precipitate of the GLAST labeling, that neuronal GLT1 expression can be demonstrated in a number of neuronal subgroups in the hippocampus (CA3 neurons), cerebral cortex (layer II–VI), thalamus, anterior olfactory nucleus and olivary nucleus (Berger and Hediger, 1998). Using this approach we have recently shown the expression of both GLT1a and GLT1b mRNA in neurons in the CA3 subfield of hippocampus (Chen et al, 2004). For the present study, we employed DAPI-costaining of alkaline-phosphatase developed sections to demonstrate GLT1a and GLT1b mRNA expression in neurons in the cerebral cortex. We chose this approach because the fluorescent technique did not provide the required sensitivity to show labeling of cortical neurons with the short probes. As shown in the top row of Figure 2, neuronal GLT1 expression in layer VI neurons could be distinguished at low magnification for GLT1pan, GLT1a, and, to a lesser extent for GLT1b (arrows in Fig. 2A, 2B, 2C). At high magnification, the expression of both GLT1a and GLT1b isoforms in these neurons was clearly shown with the help of DAPI-costaining. The second row of Figure 2 shows the alk-phos labeling of GLT1pan, GLT1a, and GLT1b alone (Fig. 2D, 2E, 2F); the third row shows alk-phos and DAPI-staining simultaneously (Fig. 2g, 2H, 2I), and the bottom rows shows the DAPI-staining alone (Fig. 2j, 2K, 2L). The neuronal cell nuclei could be identified using DAPI because they were bigger and stain less intensely than the glial cell nuclei whose chromatin is packed more densely than neuronal chromatin. In Figure 2, panels D–L, examples of neurons that are labeled for GLT1pan, GLT1a or GLT1b are indicated by arrows. Note that GLT1a labeling in neurons was more intense than neuronal GLT1b labeling. The neuronal GLT1b labeling was weak but was above background since other cells, which were probably microglia, did not show any labeling around their nuclei (arrowheads in Fig. 2F, 2I, 2L). Similar results were found with GLT1 positive neurons in the anterior olfactory nucleus (not shown). These data indicate a similar distribution for both GLT1 isoforms in neurons, with GLT1a mRNA levels higher than GLT1b mRNA levels.
Figure 2. Expression of GLT1a and GLT1b mRNA in layer VI cortical neurons.

GLT1pan (A, D, G), GLT1a (B, E, H), and GLT1b (C, F, I) mRNA expression in layer VI neurons of cerebral cortex. Panels A–C show a low power view of layer VI, which is indicated by arrows. Panels D–F, G–I, and J–L, show higher magnification views of layer VI neurons co-stained for the nuclear marker DAPI. The second row shows the alkaline phosphatase labeling alone, the third row shows the alk-phos and DAPI labeling simultaneously, and the fourth row shows DAPI alone. Neurons can be identified using DAPI stain, because their chromatin is less densely packed than in glial cells, their DAPI staining appears less intense, and the neuronal nuclei are also generally bigger than glial nuclei. The horizontal arrows point to neurons labeled for GLT1pan, GLT1a or GLT1b, in each of the three lower rows. Note that the neuronal GLT1a labeling is more intense than that of GLT1b. The GLT1b labeling in the indicated neurons is not background because other smaller DAPI-stained cells are present which do not show any GLT1b labeling (arrowheads in F, I, L).. Bars: C, 50 μm; L, 16.6 μm.
Sub-cellular localization in astrocytes
The astrocytes in hippocampus generally showed labeling for both GLT1a and GLT1b, yet there were differences in the labeling patterns. Figure 3 shows the molecular layer of CA1 labeled with GLT1pan (Fig. 3A), GLT1a (Fig. 3B), or GLT1b (Fig. 3C) probes. GLT1a mRNA labeling was relatively weak in this area (compare with Fig. 3C), and was present primarily in astrocyte processes and only weakly in the cell bodies. In contrast, GLT1b mRNA was expressed primarily in the cell bodies and to a lesser degree in the astrocyte processes. All of the labeled cells were astrocytes, as was demonstrated by the double-labeling for GLAST mRNA (Figs. 3D–I). Figures 3D, E, and F show simultaneous viewing of the fluorescent GLAST labeling and the bright-field labeling for GLT1pan, GLT1a and GLT1b, respectively. Arrows point to individual cells that can be seen to possess both GLT1 and GLAST labels. Figures 3G, H and I show the fluorescent GLAST labeling alone. All GLT1a and GLT1b labeled cells also show fluorescent GLAST labeling, demonstrating their astrocytic nature. In the case of full-length GLT1, the GLAST labeling is obscured by the strong AP labeling (Fig. 3G). Additional examples for the different mRNA localizations in the molecular layer can be seen in Figure 4B and 4D and at higher magnification in 4F and 4H.
Figure 3. Different subcellular localization of GLT1a and GLT1 b mRNA in astrocytes.

GLT1 labeling in adjacent sections through the molecular layer of CA1 using the full length GLT1 (A, D), or specific GLT1a (B, E), or GLT1b (C, F) probes. The sections were double-labeled using AP detection for the GLT1 probes, as shown in the upper row (A–C), and fluorescence detection for the GLAST probe, as shown in the bottom row (G–I). The middle row shows both labels simultaneously (D–E). GLT1a labeling (B) was present primarily in astrocytic processes, whereas GLT1b labeling (C) was mainly in the cell bodies of the astrocytes. All the GLT1 labeled cells were astrocytes, as demonstrated by co-labeling with GLAST (arrows point to individual double labeled cells in B, E, H for GLT1a and C, F, I for GLT1b). Note: the fluorescent GLAST labeling in D and G is mostly blocked by the strong labeling of the full-length GLT1 probe. Bar: 50 μm.
Figure 4. Different regional expression of GLT1a and GLT1b in hippocampal subfields.
GLT1a (A, B, E, F) and GLT1b (C, D, G, H) mRNA expression levels in astrocytes in CA1 pyramidal cell layer (A, C, E, G) and CA1 molecular layer (B, D, F, H). GLT1a labeling shows a higher intensity in astrocytes within the pyramidal cell layer (arrows) than in astrocytes in the molecular layer. In contrast, GLT1b labeling does not show a distinct difference in intensity between these two regions. These results suggest that GLT1a and GLT1b mRNA expression is differentially regulated. Bars: D, 50 μm; H, 25 μm.
Regional heterogeneity of expression
In addition to the difference in subcellular localization of GLT1a and GLT1b mRNA, we also noted a difference in astrocyte labeling intensity between the isoforms in different areas of the hippocampus. Whereas the GLT1a labeling was relatively strong in astrocytes situated within the CA1 pyramidal cell layer (Fig. 4A arrow, and 4E), astrocytes in the CA1 molecular layer showed a much lower labeling intensity (Fig. 4B arrow, and 4F). In contrast, the labeling for GLT1b did not show such a distinct difference between different areas in hippocampus (Figs. 4C, D, G, and H). This finding suggests that the expression of GLT1a and GLT1b in astrocytes is regulated via different mechanisms.
In our previous studies of the expression patterns of GLT1 mRNA in rat brain, we observed certain areas where GLT1 expression was low, as well as some non-astrocytic cell types that also expressed GLT1 message (Berger and Hediger, 1998, 2000, 2001). In these areas or cell types, GLT1a and GLT1b probes showed similar labeling patterns. For example, in the subfornical organ, where we have shown that the glutamate transporter GLAST is strongly expressed but GLT1 is low (Berger and Hediger, 2000), both GLT1a and GLT1b expression was low (Figs. 5A, B, C). Similarly, in globus pallidus, expression for both isoforms was low (Figs. 5D, E, F). However, both GLT1a and GLT1b were distinctly expressed in the subependymal cells at the dorsal border of the striatum (Figs. 5G, H, I). Neither GLT1pan, GLT1a nor GLT1b labeling were found in the epithelial cells of the choroid plexus (Figs. 5G, H, I). The tanycytes in the dorsal walls of the third ventricle showed almost identical labeling patterns for GLT1a and GLT1b (Figs. 5J, K, L). Regular cuboidal ependymal cells in the roof of the third ventricle or tanycytes in the floor of the third ventricle were not labeled for GLT1a or GLT1b (Fig. 5J, K, L).
Figure 5. GLT1a and GLT1b mRNA labeling is similar in specialized astrocytic cells within the brain.

GLT1pan (A, D, G, J), GLT1a (B, E, H, K) and GLT1b (C, F, I, L) labeling in adjacent sections of the subfornical organ (asterisks, A–C), globus pallidus (asterisks, D–F), choroid plexus and dorsal border of striatum (G–I), and third ventricle of hypothalamus (J–L). GLT1a and GLT1b labeling show similar expression levels in astrocytes in the subfornical organ and in the globus pallidus, in subependymal cells (arrows, G–I) and in tanycytes in the dorsal walls of the third ventricle (arrowhead, J–L). Note lack of labeling in choroid plexus epithelial cells (asterisks, G–I), regular cuboidal epithelial cells in the roof of the third ventricle (J–L) or tanycytes of the third ventricle floor (J–L). Bars: C, F, L, 100 μm; I, 50 μm.
In another circumventricular organ, the pineal gland, we have previously found strong expression of GLT1 message in pinealocytes. Interestingly, this expression was primarily due to the GLT1b isoform, as the GLT1b labeling was significantly more intense than the GLT1a labeling (Figs. 6A, B, C). In the retina, GLT1pan labeling was found in the photoreceptor layer, the inner nuclear layer, and in astrocytes in the ganglion cell layer (Fig. 6D). Similar to pineal gland, this GLT1 expression in the retina was mostly due to GLT1b (Fig. 6F). Some GLT1a mRNA labeling was present but at very low intensity (Fig. 6E). In the pituitary gland, GLT1 was expressed strongly in astrocyte-like cells in the intermediate lobe (Fig. 6G). GLT1a and GLT1b were similarly expressed in these cells (Fig. 6H, J).
Figure 6. GLT1a and GLT1b mRNA labeling differs in cells outside the brain.

GLT1pan (A, D, G), GLT1a (B, E, H) and GLT1b (C, F, I) labeling in adjacent sections of pineal gland (A–C), retina (D–F), and intermediate lobe of pituitary gland (G–I). GLT1 expression in pinealocytes of pineal gland, and bipolar cells and photoreceptor cells of retina is primarily due to GLT1b, whereas expression in astrocytes in the intermediate pituitary is similar for GLT1a and GLT1b. GC: ganglion cell layer, IN: inner nuclear layer, PR: Photoreceptor layer. Bars: C, F, I, 20 μm.
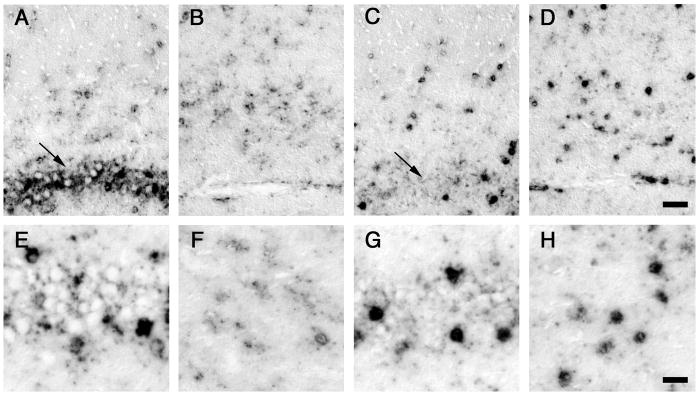
In contrast to our findings, two previous studies have reported homogenous expression of the GLT1b isoform in most neurons (Schmitt et al., 2002, Regan et al. 2004). We suggest that such uniform labeling of neurons is due to a non-specific stretch of sequence within the GLT1b probe. To demonstrate this, we hybridized purified GLT1pan, GLT1a and GLT1b probes with precisely measured concentrations, using a low concentration (20 ng/ml) and a high concentration (240 ng/ml). Figures 7A and 7B show that when the GLT1b probe was used at the high concentration, it produced uniform labeling of the hippocampal pyramidal cells, whereas the GLT1a probe did not label the CA1 neurons. Higher magnifications of the transition zone between CA1, CA2 and CA3 pyramidal cells are shown for the high and low GLT1a and GLT1b probe concentrations in Figures 7C–7F. Arrows point to the approximate start of the CA1 subfield where high GLT1a probe did not label neurons, but high GLT1b probe did cause non-specific labeling. The specific labeling of GLT1b in CA3 neurons at the low concentration of probe, which is not clearly visible at the magnification in Fig. 7F, is highlighted in the inserts in Fig. 7f. In the choroid plexus (Figs. 7G–7J), the high GLT1b probe concentration also caused labeling that must be non-specific (Fig. 7I, arrow), since high GLT1pan probe did not label cells of this structure (Figs. 7). Neither the high GLT1a antisense nor the high GLT1b sense probes labeled cells of the choroid plexus (Fig. 7H, J).
Figure 7. The GLT1b probe causes non-specific labeling at high concentration.

In situ labeling in hippocampus (A–F) and choroid plexus (G–J) produced by elevated (240 ng/ml) concentrations of probes against GLT1a (A, C, H), GLT1b (B, D, I), GLT1pan (G), and GLT1b sense (J), and by a low concentration (20 ng/ml) of GLT1a (E) and GLT1b (F). The high GLT1b probe concentration causes non-specific labeling in CA1 neurons (B, arrow) as well as other neurons, whereas the same concentration for GLT1a (or GLT1pan, not shown) does not label the CA1 neurons (A, arrow). Arrows in C–F point to the edge of the CA1 area at higher magnification. The high GLT1b probe labels the CA1 neurons non-specifically (D), which is not seen at the lower probe concentration (F). The GLT1a probe does not label the CA1 neurons at the high (C) or the low (E) probe concentration. The specific labeling of CA3 neurons by low GLT1b probe in F, which is not clearly seen at this magnification, is highlighted with an arrowhead in the insert. The high GLT1b probe also labels choroid plexus non-specifically (I, arrow), which is again not observed with GLT1pan (G), GLT1a (H), or GLT1b sense (J) probes. For this experiment, probes were purified over RNA columns and the concentrations were precisely measured with a Nanodrop spectrophotometer. Bars: B 250 μm, F 25 μm for inserts, J 50 μm (for C–J).
DISCUSSION
Comparison of expression patterns of GLT1a and GLTb
In situ hybridization using variant specific 3′-UTR directed probes revealed generally similar cellular distribution patterns for GLT1a and GLTb in neurons and astrocytes in the brain. GLT1a is the predominant isoform expressed in neurons. Comparison of labeling intensity in astrocytes showed regional differences for GLT1a, whereas GLTb mRNA expression was more uniform. Thus, GLT1a mRNA labeling in astrocytes was stronger within the CA1 pyramidal cell layer in the hippocampus than within the molecular layers immediately adjacent to it. GLT1b labeling in contrast did not show such a variation. This finding suggests that the local milieu surrounding the astrocyte influences the expression levels of GLT1a more so than those of GLT1b. Furthermore, this finding also suggests that GLT1a and GLT1b expression is regulated via different mechanisms. Possibly, the levels of an unknown factor present in the pyramidal cell layer influence expression of GLT1a, but not GLT1b. Interestingly, higher GLT1a expression in astrocytes in the pyramidal cell layer has also been observed on the protein level using immunocytochemistry (Sullivan et al., 2004). Previous work has shown that GLT1 appears to be upregulated in astrocyte membranes adjacent to excitatory synapses (Lehre and Danbolt, 1998). The finding of strong expression of GLT1a in astrocytes in the pyramidal layer suggests that other factors are operating as well in the regulation of expression of this transporter.
Additional evidence for a difference in the regulation of GLT1a and GLT1b expression was found in the subcellular localization of GLT1a and GLT1b mRNA. Within astrocytes, the GLT1a signal was localized primarily in processes (Fig. 3B; Fig. 4B, F) whereas the GLT1b signal filled mainly the cell body, with only rare labeling in the processes (Fig. 3C; Fig. 4D, H, I). These differences in mRNA localization may be due to the presence or absence of transport signals in the 3′-UTRs of the mRNAs for the two variant forms, and are evidence that the two probes labeled different species of RNA. The different subcellular localization of the mRNA is mirrored on the protein level, as has been elegantly shown recently by Sullivan et al. (2004). Using sub-type specific antibodies, GLT1a (called GLT1alpha in that study) and GLT1b (called GLT1v) were found on separate stretches of astrocyte processes. GLT1a immunostaining was primarily expressed in distal regions of the processes whereas GLTb staining was mainly localized near the cell soma (Sullivan et al. 2004).
Relative expression levels of GLT1a and GLT1b
Our findings indicate that GLT1a is the predominant isoform expressed in neurons in various locations such as the CA3 region in the hippocampus, layer VI of the cerebral cortex and in the anterior olfactory nucleus. In astrocytes, the difference in labeling intensity between GLT1a and GLT1b was for the most part not as distinct. Thus, low expression for both GLT1a and GLT1b was observed in the globus pallidus, subfornical organ or in regular cuboidal ependymal cells, and similar expression levels were found in the highly expressing third ventricle tanycytes, subependymal cells and astrocytes in the intermediate pituitary. We did observe, however, a few regions where there were differences between GLT1a and GLT1b expression. In Bergmann glia, GLT1a was the predominant form, whereas GLT1 expression in pinealocytes was primarily due to GLT1b. Expression of GLT1 in retinal layers was also primarily due to GLT1b, as has been found previously in in situ studies (Schmitt et al., 2002; Kugler and Schmitt, 2003) and corroborated by protein expression studies (Reye et al., 2002b; Reye et al., 2002a). These findings again suggest that the two transporter isoforms have different functional properties, and that they fulfill different roles in different cells and tissues.
Comparison of present results with other recent mRNA studies
Although this is the first detailed study that has compared the mRNA distribution patterns for both GLT1a and GLT1b in the rat brain, two other recent studies have reported on the localization of GLT1b mRNA in the rat brain (Schmitt et al. 2002, Reagan et al. 2004). Using non-isotopic in situ hybridization and an almost identical GLT1b probe, Schmitt et al. (2002) have reported that GLT1b mRNA is expressed primarily by neurons in the rat brain, whereas astrocytes only occasionally express this isoform. In addition, positive labeling was found in other glial cells such as oligodendrocytes, ependymal cells, epithelial cells of the choroid plexus and satellite cells and Schwann cells. Reagan et al. (2004), who used an isotopic approach with isoform-specific probes that were similar to ours, found also widespread expression of GLT1b by neurons and some expression in astrocytes as well, though astrocytic expression was not examined in detail. Both of these previous studies found uniform labeling of GLT1b in CA1 and CA3 pyramidal neurons in hippocampus. While the present study has not addressed the expression of GLT1b in oligodendrocytes or peripheral satellite cells and Schwann cells, we did not observe any expression in ependymal cells or choroid plexus, neither with the isoform probes nor with the long pan probe. Furthermore, we observed the selective labeling pattern of CA3 neurons in the hippocampus, as has been shown previously by several studies (Torp et al., 1994; Schmitt et al., 1996; Torp et al., 1997; Berger and Hediger, 1998). We suggest that these discrepant results may be due to a non-specific stretch within the GLT1b probe. We were not able to identify this stretch but we could demonstrate that if used at higher concentrations, the GLT1b probe also caused labeling of CA1 neurons and the choroid plexus. This did not occur with the GLT1a probe or the GLT1pan probe. This result can only be explained by the existence of a non-specific stretch within the 3′-UTR sequence of GLT1b, since it is not possible that a probe for a subset of GLT1 transcripts, i.e. the GLT1b 3′-UTR fragment, could produce labeling not seen with a probe for all GLT1 transcripts, namely the whole GLT1pan sequence. Thus we surmise that the GLT1b probe may have been used at too high a concentration in the two previous studies reporting widespread neuronal labeling and that the reported labeling was non-specific.
Functional significance of GLT1a and GLT1b
The significance of the existence of alternative splicing isoforms with distinct cellular distribution patterns is not clear. Since functional studies have shown that both isoforms have similar transport characteristics, alternative splicing does not create different glutamate clearance properties. Rather, as suggested by Sullivan et al. (2004), the alternative splicing and subsequent differential targeting to the membrane may be a mechanism to independently regulate extracellular glutamate in different areas near the synapses. In addition, since GLT1b, but not GLT1a, terminates in a PDZ interaction sequence (Chen et al., 2002), alternative splicing might provide GLT1 access to PDZ domain containing proteins and the pathways of targeting, trafficking, and signal transduction in which these proteins participate (Sheng and Sala, 2002). In fact, in a yeast 2-hybrid screen, we discovered that GLT1b interacts with PICK1, a protein originally cloned as an interactor with protein kinase C (protein interacting with c kinase) (Staudinger et al., 1995; Staudinger et al., 1997), and subsequently rediscovered as an interactor with metabotropic and ionotropic glutamate receptors (Dev et al., 1999; Xia et al., 1999; Boudin et al., 2000; Dev et al., 2000; El Far et al., 2000). The interaction between GLT1b and PICK1 is specific and appears to regulate the downregulation of GLT1 function by activated protein kinase C (Chen et al., 2001; Mahadomrongkul et al., 2002; Bassan et al., 2003; Bassan et al., 2004). These results are reported in a manuscript recently submitted for publication.
Interestingly, several recent studies have shown that the two isoforms are differentially affected in certain disease models. Thus, GLT1b (GLT1v) is downregulated independently from GLT1a in a mouse model of ALS/parkinsonism (Wilson et al. 2003). In addition, in human ALS brain tissue GLT1b (EAAT2b) protein expression was reported to be significantly increased whereas the GLT1a (EAAT2) protein was severely decreased (Maragakis et al. 2004). Finally, tianeptine, a dendrite-remodeling blocker, differentially affected the stress-induced upregulation of GLT1a and GLT1b protein levels in the hippocampal CA3 area (Reagan et al. 2004). These studies suggest that GLT1a and GLT1b expression is differentially regulated.
In summary, our analysis of the mRNA distribution patterns for GLT1a and GLT1b revealed that both isoforms are expressed by astrocytes as well as by neurons. Although the mRNA expression levels in astrocytes were roughly comparable, GLT1a mRNA expression in neurons was clearly predominant. Differences in regional expression levels and differences in subcellular mRNA distribution provide further evidence that the two glutamate transporter isoforms are regulated by different mechanisms and that they fulfill different functions.
Acknowledgments
Supporting grant information: This work was funded by grants to P.A.R. from the Ron Shapiro Charitable Foundation, the Muscular Dystrophy Association, National Institutes of Health (NS 40753 and NS 41883), and to Children’s Hospital (Mental Retardation Core Grant HD18655).
LITERATURE CITED
- Bassan M, Liu H, Chen W, Irwin N, Rosenberg PA. Functional interaction of GLT1b, a variant form of the glutamate transporter GLT1, with PICK1. Soc Neurosci Abstr. 2003;29:372.8. [Google Scholar]
- Bassan M, Liu H, Chen W, Madsen KL, Gether U, Irwin N, Rosenberg PA. Interaction of the glutamate transporter GLT1b with the PDZ protein PICK1 and GLT1a. Soc Neurosci Abstr. 2004;30:503.16. [Google Scholar]
- Berger UV, Hediger MA. Comparative analysis of glutamate transporter expression in rat brain using differential double in situ hybridization. Anat Embryol (Berl) 1998;198:13–30. doi: 10.1007/s004290050161. [DOI] [PubMed] [Google Scholar]
- Berger UV, Hediger MA. Distribution of the glutamate transporters GLAST and GLT-1 in rat circumventricular organs, meninges, and dorsal root ganglia. J Comp Neurol. 2000;421:385–399. doi: 10.1002/(sici)1096-9861(20000605)421:3<385::aid-cne7>3.0.co;2-s. [DOI] [PubMed] [Google Scholar]
- Berger UV, Hediger MA. Differential distribution of the glutamate transporters GLT-1 and GLAST in tanycytes of the third ventricle. J Comp Neurol. 2001;433:101–114. doi: 10.1002/cne.1128. [DOI] [PubMed] [Google Scholar]
- Boudin H, Doan A, Xia J, Shigemoto R, Huganir RL, Worley P, Craig AM. Presynaptic clustering of mGluR7a requires the PICK1PDZ domain binding site. Neuron. 2000;28:485–497. doi: 10.1016/s0896-6273(00)00127-6. [DOI] [PubMed] [Google Scholar]
- Chen W, Berger UA, Brasch M, Irwin N, Rosenberg PA. A variant form of the glutamate transporter GLT1 interacts with the PDZ protein PICK1 in rat forebrain. Soc Neurosci Abstr. 2001;27:607.4. [Google Scholar]
- Chen W, Aoki C, Mahadomrongkul V, Gruber CE, Wang GJ, Blitzblau R, Irwin N, Rosenberg PA. Expression of a variant form of the glutamate transporter GLT1 in neuronal cultures and in neurons and astrocytes in the rat brain. J Neurosci. 2002;22:2142–2152. doi: 10.1523/JNEUROSCI.22-06-02142.2002. [DOI] [PMC free article] [PubMed] [Google Scholar]
- Chen W, Mahadomrongkul V, Berger UV, Bassan M, DeSilva T, Tanaka K, Irwin N, Aoki C, Rosenberg PA. The glutamate transporter GLT1a is expressed in excitatory axon terminals of mature hippocampal neurons. J Neurosci. 2003 doi: 10.1523/JNEUROSCI.1586-03.2004. submitted. [DOI] [PMC free article] [PubMed] [Google Scholar]
- Danbolt NC. Glutamate uptake. Prog Neurobiol. 2001;65:1–105. doi: 10.1016/s0301-0082(00)00067-8. [DOI] [PubMed] [Google Scholar]
- Dev KK, Nishimune A, Henley JM, Nakanishi S. The protein kinase C alpha binding protein PICK1 interacts with short but not long form alternative splice variants of AMPA receptor subunits. Neuropharmacol. 1999;38:635–644. doi: 10.1016/s0028-3908(98)00230-5. [DOI] [PubMed] [Google Scholar]
- Dev KK, Nakajima Y, Kitano J, Braithwaite SP, Henley JM, Nakanishi S. PICK1 interacts with and regulates PKC phosphorylation of mGLUR7. J Neurosci. 2000;20:7252–7257. doi: 10.1523/JNEUROSCI.20-19-07252.2000. [DOI] [PMC free article] [PubMed] [Google Scholar]
- El Far O, Airas J, Wischmeyer E, Nehring RB, Karschin A, Betz H. Interaction of the C-terminal tail region of the metabotropic glutamate receptor 7 with the protein kinase C substrate PICK1. Eur J Neurosci. 2000;12:4215–4221. doi: 10.1046/j.1460-9568.2000.01309.x. [DOI] [PubMed] [Google Scholar]
- Kugler P, Schmitt A. Complementary neuronal and glial expression of two high-affinity glutamate transporter GLT1/EAAT2 forms in rat cerebral cortex. Histochem Cell Biol. 2003 doi: 10.1007/s00418-003-0530-7. [DOI] [PubMed] [Google Scholar]
- Madl JE, Burgesser K. Adenosine triphosphate depletion reverses sodium-dependent, neuronal uptake of glutamate in rat hippocampal slices. J Neurosci. 1993;13:4429–4444. doi: 10.1523/JNEUROSCI.13-10-04429.1993. [DOI] [PMC free article] [PubMed] [Google Scholar]
- Mahadomrongkul V, Aoki C, Rosenberg PA. The glutamate transporter GLT1b & PICK1 both localize to pre- and post-synaptic processes of pyramidal neurons as well as astrocytes of intact adult rat cerebral cortex. Soc Neurosci Abstr. 2002;28:44.7. [Google Scholar]
- Mangano RM, Schwarcz R. Chronic infusion of endogenous excitatory amino acids into rat striatum and hippocampus. Brain Res Bull. 1983;10:47–51. doi: 10.1016/0361-9230(83)90073-4. [DOI] [PubMed] [Google Scholar]
- Reye P, Sullivan R, Pow DV. Distribution of two splice variants of the glutamate transporter GLT-1 in the developing rat retina. J Comp Neurol. 2002a;447:323–330. doi: 10.1002/cne.10218. [DOI] [PubMed] [Google Scholar]
- Reye P, Sullivan R, Fletcher EL, Pow DV. Distribution of two splice variants of the glutamate transporter GLT1 in the retinas of humans, monkeys, rabbits, rats, cats, and chickens. J Comp Neurol. 2002b;445:1–12. doi: 10.1002/cne.10095. [DOI] [PubMed] [Google Scholar]
- Rosenberg PA, Amin S, Leitner M. Glutamate uptake disguises neurotoxic potency of glutamate agonists in cerebral cortex in dissociated cell culture. J Neurosci. 1992;12:56–61. doi: 10.1523/JNEUROSCI.12-01-00056.1992. [DOI] [PMC free article] [PubMed] [Google Scholar]
- Rossi DJ, Oshima T, Attwell D. Glutamate release in severe brain ischaemia is mainly by reversed uptake. Nature. 2000;403:316–321. doi: 10.1038/35002090. [DOI] [PubMed] [Google Scholar]
- Rothstein JD, Martin L, Levey AI, Dykes-Hoberg M, Jin L, Wu D, Nash N, Kuncl RW. Localization of neuronal and glial glutamate transporters. Neuron. 1994;13:713–725. doi: 10.1016/0896-6273(94)90038-8. [DOI] [PubMed] [Google Scholar]
- Rusakov DA, Kullmann DM. Extrasynaptic glutamate diffusion in the hippocampus: ultrastructural constraints, uptake, and receptor activation. J Neurosci. 1998;18:3158–3170. doi: 10.1523/JNEUROSCI.18-09-03158.1998. [DOI] [PMC free article] [PubMed] [Google Scholar]
- Schmitt A, Asan E, Lesch KP, Kugler P. A splice variant of glutamate transporter GLT1/EAAT2 expressed in neurons: cloning and localization in rat nervous system. Neuroscience. 2002;109:45–61. doi: 10.1016/s0306-4522(01)00451-1. [DOI] [PubMed] [Google Scholar]
- Schmitt A, Asan E, Puschel B, Jons T, Kugler P. Expression of the glutamate transporter GLT1 in neural cells of the rat central nervous system: non-radioactive in situ hybridization and comparative immunocytochemistry. Neuroscience. 1996;71:989–1004. doi: 10.1016/0306-4522(95)00477-7. [DOI] [PubMed] [Google Scholar]
- Staudinger J, Lu J, Olson EN. Specific interaction of the PDZ domain protein PICK1 with the COOH terminus of protein kinase C-alpha. J Biol Chem. 1997;272:32019–32024. doi: 10.1074/jbc.272.51.32019. [DOI] [PubMed] [Google Scholar]
- Staudinger J, Zhou J, Burgess R, Elledge SJ, Olson EN. PICK1: a perinuclear binding protein and substrate for protein kinase C isolated by the yeast two-hybrid system. J Cell Biol. 1995;128:263–271. doi: 10.1083/jcb.128.3.263. [DOI] [PMC free article] [PubMed] [Google Scholar]
- Storm-Mathisen J, Danbolt NC, Rothe F, Torp R, Zhang N, Aas JE, Kanner BI, Langmoen I, Ottersen OP. Ultrastructural immunocytochemical observations on the localization, metabolism and transport of glutamate in normal and ischemic brain tissue. Prog Brain Res. 1992;94:225–241. doi: 10.1016/s0079-6123(08)61753-7. [DOI] [PubMed] [Google Scholar]
- Szatkowski M, Barbour B, Attwell D. Non-vesicular release of glutamate from glial cells by reversed electrogenic glutamate uptake. Nature. 1990;348:443–446. doi: 10.1038/348443a0. [DOI] [PubMed] [Google Scholar]
- Tanaka K, Watase K, Manabe T, Yamada K, Watanabe M, Takahashi K, Iwama H, Nishikawa T, Ichihara N, Kikuchi T, Okuyama S, Kawashima N, Hori S, Takimoto M, Wada K. Epilepsy and exacerbation of brain injury in mice lacking the glutamate transporter GLT-1. Science. 1997;276:1699–1702. doi: 10.1126/science.276.5319.1699. [DOI] [PubMed] [Google Scholar]
- Torp R, Hoover F, Danbolt NC, Storm-Mathisen J, Ottersen OP. Differential distribution of the glutamate transporters GLT1 and rEAAC1 in rat cerebral cortex and thalamus: an in situ hybridization analysis. Anat Embryol (Berl) 1997;195:317–326. doi: 10.1007/s004290050051. [DOI] [PubMed] [Google Scholar]
- Torp R, Danbolt NC, Babaie E, Bjoras M, Seeberg E, Storm-Mathisen J, Ottersen OP. Differential expression of two glial glutamate transporters in the rat brain: an in situ hybridization study. Eur J Neurosci. 1994;6:936–942. doi: 10.1111/j.1460-9568.1994.tb00587.x. [DOI] [PubMed] [Google Scholar]
- Torp R, Lekieffre D, Levy LM, Haug FM, Danbolt NC, Meldrum BS, Ottersen OP. Reduced postischemic expression of a glial glutamate transporter, GLT1, in the rat hippocampus. Exp Brain Res. 1995;103:51–58. doi: 10.1007/BF00241964. [DOI] [PubMed] [Google Scholar]
- Utsunomiya-Tate N, Endou H, Kanai Y. Tissue specific variants of glutamate transporter GLT-1. FEBS Lett. 1997;416:312–316. doi: 10.1016/s0014-5793(97)01232-5. [DOI] [PubMed] [Google Scholar]
- Xia J, Zhang XQ, Staudinger J, Huganir RL. Clustering of AMPA receptors by the synaptic PDZ domain- containing protein PICK1. Neuron. 1999;22:179–187. doi: 10.1016/s0896-6273(00)80689-3. [DOI] [PubMed] [Google Scholar]