

Abstract
The left-handed DNA structure, Z-DNA, is believed to play important roles in gene expression and regulation. Z-DNA forms sequence-specifically with a preference for sequences rich in pyrimidine/purine dinucleotide steps. In vivo, Z-DNA is generated in the presence of negative supercoiling or upon binding proteins that absorb the high energetic cost of the B-to-Z transition including the creation of distorted junctions between B-DNA and Z-DNA. To date, the sequence-preferences for the B-to-Z transition have primarily been studied in the context of sequence repeats lacking B/Z junctions. Here, we develop a method to characterize sequence-specific preferences for Z-DNA formation and B/Z junction localization within heterogeneous DNA duplexes that is based on combining 2-aminopurine fluorescence measurements with a new quantitative application of CD spectroscopy for determining the fraction of B- versus Z-DNA. Using this approach, we show that at least three consecutive CC dinucleotide steps, traditionally thought to disfavor Z-DNA, can be incorporated within heterogeneous Z-DNA containing B/Z junctions upon binding to the Zα domain of the RNA adenosine deaminase (ADAR1) protein. Our results indicate that the incorporation of CC steps into Z-DNA is driven by favorable sequence-specific Z/Z and B/Z stacking interactions as well as by sequence-specific energetics that localize the distorted B/Z junction at flexible sites. Together, our results expose higher order complexities in the Z-DNA code within heterogeneous sequences and suggest that Z-DNA can in principle propagate into a wider range of genomic sequence elements than previously thought.
Introduction
Following its discovery over thirty years ago1, there was a great deal of skepticism regarding the significance and biological role of the left-handed Z-DNA double helix2. Initial studies showed that the B-to-Z transition required extreme ionic strength conditions (4M NaCl) and was largely limited to poly(CG)x sequences3. This view changed gradually over the past 30 years as studies showed that CG and CA repeats as well as some heterogeneous sequences can readily form Z-DNA at low ionic strength in the presence of negative supercoiling2,4-8. The subsequent discoveries of proteins that bind specifically to Z-DNA, and induce the B-to-Z transition under physiological conditions in the absence of supercoiling, rigorously established the occurrence and biological significance of Z-DNA in vivo9,10. Although the biological role of Z-DNA is not fully understood, it is thought to function as a general sponge for absorbing negative supercoiling thereby modulating processes such as transcription and nucleosome positioning2,11-16.
The B-to-Z transition is a major structural transformation (Figure 1). In right-handed B-DNA, bases adopt an anti orientation and stack on both 5′ and 3′ neighboring bases while the sugar moieties adopt the C2’ endo pucker (Figure 1). In Z-DNA, alternating bases, typically purine residues, adopt a syn orientation in which the base flips 180 degrees about the glycosidic bond (χ) and the sugar adopts the C3’-endo pucker (Figure 1)17. The base-pair partner, typically a pyrimidine residue, and its corresponding sugar simultaneously flip over with respect to B-DNA to accommodate the left-handed helix while retaining Watson-Crick base-pairing and adopting an anti conformation with C2’-endo sugar pucker (Figure 1). In Z-DNA, the syn purine only stacks with its 3′ neighbor, while the anti pyrimidine stacks with its 5′ neighbor and with the 3′ pyrimidine on the other strand (Figure 1). Thus, the B to Z transition entails the loss and creation of new stacking interactions that are highly sequence-dependent, and accordingly, the propensity to undergo the B-to-Z transition is highly dependent on sequence.
Figure 1.

Schematic of the B-to-Z transition. Shown are the conformational changes and Zα domain/nucleobase interactions that take place upon transitioning between right-handed B-DNA into left-handed Z-DNA. The B/Z junction is colored green, stacking interactions are indicated using grey boxes, nucleobase protein interactions are dashed red lines, and sugars with C3’-endo puckering are colored blue.
Thus far, studies exploring the sequence-specificity of the B-to-Z transition have primarily focused on DNA repeats and the use of supercoiling or high salt concentrations to trigger the B-to-Z transition7,8,18,19. These studies have been used to generate thermodynamic preferences for forming Z-DNA for all 16 dinucleotide steps, which are in turn used in current algorithms to predict Z-DNA favoring regions in genomes in vivo20-23. However, in genomes, Z-DNA must form within a sea of heterogeneous B-DNA sequences. Much less is known about the sequence preferences for forming Z-DNA in such heterogeneous sequences containing, Z-DNA, B-DNA and B/Z junctions. There is growing evidence that sequence preferences for forming Z-DNA derived from studies of repeats do not fully capture the sequence-specific energetic contributions that drive the B-to-Z transition in heterogeneous sequences which include creation and loss of B/B, Z/Z and B/Z stacking interactions that are absent in sequence repeats (Figure 1).
Indeed, recent studies indicate that current thermodynamic models for predicting Z-DNA cannot fully explain the occurrence of Z-DNA. For example, only 2 out of 186 regions located near promoter regions that are computationally predicted to form Z-DNA hotspots were found to have a high propensity to form Z-DNA in vivo as determined using a protein crosslinking chromatin affinity precipitation assay21. Furthermore, the only available X-ray structure of a B/Z junction (Z-JXN, Figure 2a) reveals the unusual localization of the B/Z junction away from the end of a CG repeat, such to incorporate an additional CC step and localize the junction at an A-T base-pair which adopts an extruded conformation24. This is the case even though the incorporation of CC steps into Z-DNA is ~1.7 kcal/mol more energetically unfavorable per dinucleotide as compared to CG steps20. In a more recent study, we showed that the A-T junction base-pair of Z-JXN is unstable in the B-form, and proposed that localization of the junction at this site, and incorporation of CC steps, is driven in part by a desire to minimize the energetic cost for distorting the B/Z junction25. Consistent with this idea, replacement of the flexible A-T junction site with a more stable G-C base-pair resulted in significantly lower propensities to form Z-DNA as judged by CD spectroscopy, suggesting localization of the junction near the end of the CG repeat. These results suggest that the energetics of junction formation are sequence-specific and important determinants for B/Z junction formation and localization in heterogeneous sequences.
Figure 2.

Probing B/Z junction localization using 2AP steady-state fluorescence. (a) Crystal structure (PDB: 2ACJ24) of a B/Z junction (Z-JXN) composed of B-DNA (black), Z-DNA (grey) and extruded bases (yellow). (b) Sequence of Z-JXN (black) and Z-CG (green) with 2AP fluorescent probes indicated using a star. The differences between Z-JXN and Z-CG are highlighted in green. (c) Relative change in fluorescence (Zα bound intensity/free intensity) upon inducing the B-to-Z transition with saturating Zα domain. The fluorescence increase for junction A24 is indicated with a dashed line for comparison. (d) Fits of Zα bound CD spectra with the location of the 2AP label relative to the 5′ end of each sequence’s (CG)3 element indicated using a star. The expected number of Z-DNA base-pairs is indicated with a dashed line.
Additional complexities in the sequence-specific preferences for Z-DNA could potentially arise when triggering the B-to-Z transition using Z-DNA binding proteins. However, the Zα domain of the RNA adenosine deaminase (ADAR1) protein has been shown to primarily interact with the Z-DNA backbone26 and though it is observed to make contacts with syn bases (Figure 1), these interactions have been observed in pyrimidine and purine bases alike27, 28. Thus, the Zα domain is conformation rather than sequence specific in its interaction with DNA supporting a genomic role for interacting with heterogeneous sequences.
One of the challenges in characterizing sequence-propensities to form Z-DNA in heterogeneous sequences is the lack of techniques that can be used to characterize the extent of Z-DNA formation and the specific location of B/Z junctions in such heterogeneous environments. Bulk techniques such as Circular Dichroism (CD)29,30 and Raman31, 32 spectroscopy can be used to characterize the presence or absence of B/Z junctions but provide limited information regarding the location of the B/Z junction along the DNA. Single molecule techniques and NMR spectroscopy have been used to obtain valuable insights into B/Z junctions but their application to explore a wide range of sequences is impractical33,34. Measurement of fluorescence intensity increases in DNA samples labeled with 2-aminopurine (2AP) at or near the extruded B/Z junction35 provides a convenient approach to monitor junction formation. However, the measured fluorescence intensity increases cannot unambiguously be interpreted as evidence for an extruded base-pair at a B/Z junction since other conformational changes36-38, including formation of Z-DNA39, and possibly other structures, can also result in fluorescence intensity enhancements leaving a great deal of uncertainty in defining the likely location of the B/Z junction.
Here, we combine 2AP fluorescence measurements with a new CD spectroscopic approach for quantitatively measuring the total number of Z-DNA base-pairs in heterogeneous sequences containing B- and Z-DNA. Using this approach, and the Zα domain of ADAR1 to trigger the B-to-Z transition, we show that at least three consecutive CC steps, traditionally thought to disfavor Z-DNA, can be incorporated into heterogeneous Z-DNA containing B/Z junctions. Our results indicate that the incorporation of CC steps into Z-DNA is driven by favorable sequence-specific Z/Z and B/Z stacking interactions as well as by sequence-specific energetics that localize the distorted B/Z junction at flexible sites. Our results also suggest that heterogeneous DNA duplexes bound to the Zα domain of ADAR1 do not adopt a single conformation, but rather, likely exist as an ensemble of conformations that vary with respect to the precise location of the B/Z junction. Together, our results expose higher order complexities in the Z-DNA code within heterogeneous sequences and suggest that Z-DNA can in principle propagate into a wider range of genomic sequence elements than previously thought.
Materials and Methods
Sample Preparation
DNA oligos were purchased from Integrated DNA Technologies (Coraville, IA) and purified by standard desalting with the exception of Z-19, which was purified by HPLC. Single-stranded DNA was suspended in 15 mM phosphate, 25 mM NaCl, 0.1 mM EDTA at pH 7.5. The concentration of each single stranded oligo was determined by UV using extinction coefficients provided by Integrated DNA Technologies. DNA oligos were combined in equal molar ratios and heated to 95 °C for 5 minutes and allowed to equilibrate at room temperature for several hours to allow duplex formation. The Zα domain of ADAR1 was prepared closely following a procedure described previously40 with the following modifications. Protein expression was induced with 0.2 mM IPTG at 1.0 A600 units. The protein was purified using HisSelect resin (Sigma), followed by HiTrapS chromatography, without the intervening thrombin cleavage step.
Fluorescence Spectroscopy
Steady-state fluorescence spectroscopy experiments were carried out using a Fluormax-2 fluorimeter. Fluorescence spectra were recorded using an excitation wavelength of 320 nm and emission was recorded from 335-500 nm at a temperature of 25 °C. The Zα domain was titrated into DNA samples (2.5 μM DNA) and the complex was allowed to equilibrate such that the fluorescence intensity was constant (typically 30 minutes). Fluorescence spectra were background corrected by subtracting an emission spectrum of the buffer. All sequences studied were found to reach saturation with Zα at a molar ratio less than or equal to 6:1. Relative changes in fluorescence intensities (in fold) were calculated by comparing the ratio of free and Zα saturated fluorescence intensities at 370 nm.
CD Spectroscopy
Circular dichroism (CD) spectroscopy experiments were performed using an Aviv 62DS CD spectrometer. DNA samples (2.5 μM DNA) were pipetted into a 1 cm quartz cuvette and spectra were recorded in duplicate using a 1 nm interval and averaged for 2 seconds at a temperature of 25 °C. CD spectra were baseline corrected by subtracting reference spectra consisting of either buffer or buffer with Zα protein of the same concentration as bound DNA samples. DNA samples for CD experiments were prepared independently from fluorescence experiments to ensure that the titrated Zα protein concentration was identical to the Zα reference for background subtraction. We note that small sample losses resulted from pipetting over the course of the fluorescence Zα titrations therefore requiring preparation of independent CD and fluorescence samples. Zα bound CD spectra used for fitting were recorded with a 6:1 molar ratio of protein to DNA and all sequences were shown by fluorescence to complete the transition at a ratio less than or equal to 6:1 Zα:DNA.
To determine the extent of Z-DNA formation via CD, we quantitatively analyzed our data in a manner similar to protein studies where the CD spectrum is assumed to be a linear combination of its structural components41. We used the CD spectral region of 270-310 nm to determine the fraction of residues in B- versus Z-DNA. At wavelengths < 270 nm (CG)x sequences in the B conformation have a significantly stronger CD ellipticity than heterogeneous sequences in the B conformation. When the (CG)x sequences transition into Z-DNA they no longer have such a large negative contribution to the CD ellipticity at wavelengths < 270 nm compared to heterogeneous sequences that remain in B-form. Thus, fitting CD spectra from 240-310 nm generally resulted in fits that exceeded the expected number of base-pairs in the Z conformation due to the large ellipticity arising from the CG repeats that transition into Z-DNA. The 270-310 nm range also has a minimal protein background ellipticity, which increases at lower wavelengths, thus making background subtraction easier. The reference B-form CD spectrum was recorded for each sequence in the absence of protein, thus minimizing errors due to variations in CD spectra across different B-form helices.
For proteins, linear combinations of secondary structure (alpha helix, beta sheet, etc) reference spectra are used to best fit an experimental CD spectrum, and the resulting structural composition fits can achieve up to ~5-15% accuracy for the determination of secondary structure41. Similar to proteins, we assumed the CD spectrum to be a linear combination of its secondary structural components,
| (1) |
where θEXP is the experimental CD spectrum , α is the percentage of B-DNA, θBis the free B-form CD spectrum, β is the percentage of Z-DNA, and θZ is a pure Z-DNA spectrum (we used a Zα bound (CG)6 as the pure Z-DNA reference). Equation 1 was fit using the “NonLinearModelFit” function built into Wolfram Mathematica 8. The errors obtained from fitting Equation 1 (< 0.2 base-pairs) were not reflective of variations observed between repeat experiments where the standard deviation between experiments was ~ 0.5 base-pairs. Here, we ignore contributions from the B/Z junction, which cannot be independently measured, but that based on the size of B/Z junctions it is expected to account for at most 10% of the CD signal for the size of constructs studied. Also, unlike the chemically equivalent protein backbone, the spectral region (220-230 nm) used for nucleic acids reports on the local structure of the chemically heterogeneous nucleobases of which each has slightly different optical properties. Therefore, CD provides a rough estimate of how much Z-DNA is present, which can in turn help to alleviate uncertainty in B/Z junction location determined by fluorescence data.
Results and Discussion
Probing B/Z Junction Location using 2AP Steady–State Fluorescence
We performed a series of experiments to test the limits of the applicability of 2AP fluorescence measurements in defining the location of B/Z junctions35. We used the well-characterized Z-JXN sequence containing a (CG)3 repeat, for which an X-ray structure has previously been reported (Figure 2a,b)24. We incorporated a 2AP label at the B/Z junction, and specifically at the extruded residue A24 and measured the steady-state fluorescence intensity following the incremental addition of increasing concentrations of Zα domain. We observed an increase in fluorescence intensity upon addition of the Zα domain and a binding curve that saturates at the expected Zα:DNA molar ratio of ~4:1 (Figure S1). Studies have shown that two Zα domains bind to (CG)326,42 and a total of four Zα domains bind to Z-JXN which contains a (CG)3CC Z-DNA helix24.
We observed a significant (~4.3X) increase in fluorescence intensity in the presence of saturating Zα domain indicating that A24 loses stacking interactions upon binding Zα, consistent with the extruded conformation observed in the X-ray structure (Figure 2a,b,c). Much smaller fluorescence intensity increases (1.1-2.5X) were observed when placing the 2AP at residues above the B/Z junction, which according to the X-ray structure, undergo little to no changes upon binding Zα. We also observe little to no change in fluorescence (1.3X) and CD measurements when scrambling the (CG)3 repeat in the Z-JXN sequence, indicating that the conformational change sensed at A24 is dependent on Z-DNA formation (Figure S3, Z-JXNcont).
The increase in fluorescence intensity observed at A24 cannot unambiguously be interpreted as evidence that A24 is 100% extruded as observed in the X-ray structure, or even, that it is the site of the B/Z junction. First, we cannot rule out the possibility that A24 exists in a dynamic equilibrium between flipped in and flipped out conformations, and therefore that Z-JXN exists as ensemble of conformations with varying B/Z junction locations. Second, we cannot exclude the possibility that the 2AP is incorporated into a Z-DNA helix rather than adopting a flipped out conformation. Prior studies have shown that 2AP undergoes ~10X enhancement in fluorescence intensity upon transitioning from B-DNA to Z-DNA39. This can be attributed to a loss of stacking interactions since in Z-DNA, the 2AP only stacks with its 3′ neighboring base (Figure 1). Indeed, we observed a 6.2X increase in fluorescence intensity when incorporating a 2AP into the center of a (CA)6 duplex and inducing a B-to-Z transition in the entire duplex using the Zα domain (Figure S2). This introduces a great deal of uncertainty in pinpointing the location of B/Z junctions using purely fluorescence. In this regard, the small florescence intensity increases (1.5–2.5X) observed at sites above the junction could reflect slight changes in B-form structure or even partial formation of Z-DNA.
To explore these contributions further, we studied a construct in which we replaced the Z-disfavoring CC step in Z-JXN with a Z-favoring CG step. This substitution should make it even more energetically favorable to localize the B/Z junction at A24, as observed recently for a similar sequence using single molecule techniques33. Thus, we did not expect to see any differences between Z-JXN and Z-CG, since in both cases, the junction should localize at A24. Fluorescence experiments were carried out on Z-CG using the same 2AP labels used to study Z-JXN (Figure 2b,c). We observed saturation at Zα:DNA molar ratios of ~4:1 similar to those observed for Z-JXN, indicating that Zα proteins bind Z-CG in a manner identical to Z-JXN. As expected, the largest increase in fluorescence intensity was observed at A24 (8.4X) while changes at other sites ranged from 0.9-2.2X (Figure 2c). Importantly, despite working under similar saturating conditions, we observe a much larger fluorescence intensity increase at A24 in Z-CG as compared to Z-JXN. These differences are difficult to explain based on differences in 2AP stacking interactions in each of the two B-form helices, which should give rise to smaller variations. These results suggest that A24 is not 100% extruded in Z-JXN, possibly because it exists as an ensemble of conformations with different junction locations, and that replacing the CC step with a Z-DNA favoring CG step biases the junction ensemble towards the A24 site. This is further supported by CD data (Figure 2d), which generally shows a greater amount of Z-DNA in Z-CG as compared to Z-JXN. We can rule out large differences in the propagation of Z-DNA above the junction given the observation of otherwise near identical fluorescence intensity increases observed at sites above the junction in Z-JXN and Z-CG (Figure 2c).
CD Spectroscopy as a Quantitative Probe of B/Z Junction Formation
We used CD spectroscopy as a complementary probe of the B-to-Z transition to help pinpoint the location of the junction. Thus far, CD has largely been used qualitatively to infer the existence of Z-DNA and B/Z junctions. Surprisingly, very few studies have employed quantitative linear combination43 or singular value decomposition44 methods to assess the relative fraction of B-form versus Z-form DNA, in analogy to what is routinely done in characterizing extent of secondary structure in proteins. One of the problems in deconvoluting DNA CD spectra into contributions from B-DNA and Z-DNA is that different sequences can give rise to slightly different helical structures, and/or have different optical properties, which cannot easily be taken into account when quantifying the amount of B- versus Z-DNA.
We took a number of steps to minimize errors from the above-mentioned contributions so that the amount of Z-DNA in a given sample can be reliably determined by fitting the spectrum to linear contributions of reference CD spectra for B-DNA and Z-DNA. First, the reference B-form CD spectrum was measured for each tested sequence, thus minimizing errors due to variations in CD spectra across different B-form helices. Second, we used the 270-310 nm CD spectral region to determine the fraction of residues in B- versus Z-DNA. At wavelengths < 270 nm (CG)x sequences in the B-DNA conformation have a significantly larger CD ellipticity as compared to mixed sequences of B-DNA. As a result, fitting CD spectra in the region of 240-310 nm nearly always leads to overestimation of the number of Z-DNA base-pairs in CG rich sequences. The 270-310 nm range also minimizes the protein background signal, which increases at lower wavelengths, thus making background subtraction easier.
We used the Z-JXN sequence with known X-ray structure as a benchmark for our quantitative CD fitting analysis24. We obtained the DNA component of the Zα bound CD spectra by subtracting the CD spectrum of the free Zα domain from the spectrum measured for DNA bound to Zα domain. X-ray and NMR structures of the Zα domain free and bound to Z-DNA reveal minimal conformational changes upon binding Z-DNA26,45; therefore, its free and bound CD spectra are likely to be very similar making this a valid background subtraction. Great care was taken to ensure that the concentration/volume of Zα protein in DNA samples and in the reference sample were very similar.
Fits to the individually 2AP labeled Z-JXN samples (Figure 2d) yielded 7.3-8.1 base-pairs in the Z-DNA conformation, which compares favorably with a value of 7.9 obtained for Z-JXN in the absence of 2AP labeling and in excellent agreement with the 8 Z-DNA base-pairs observed in the crystal structure of Z-JXN24. A representative example of the CD fits is shown in Figure 3. In general, we did observe minor variations in the CD spectra in the differently 2AP labeled samples, particularly in their B-form which most likely reflect small differences in optical properties and local structure46. We do not observe any trends between fitted Z-DNA base-pair counts and the location of the 2AP label, indicating that the 2AP does not impact the propensities to undergo the B-to-Z transition.
Figure 3.
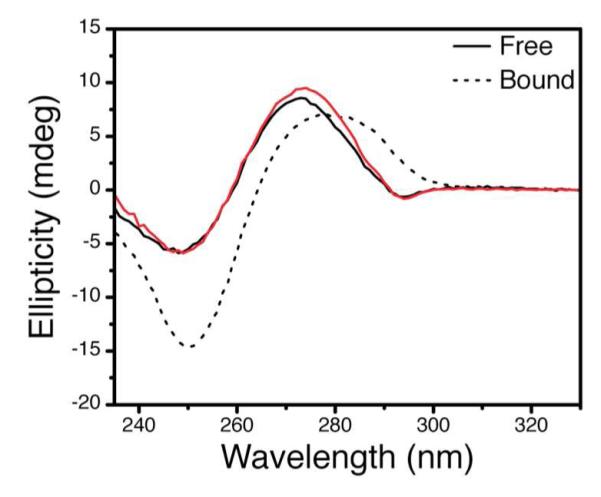
Representative example of quantitative CD fitting. Shown are experimental (black) and fitted (red) spectra of Z-JXN with a 2AP label at A27 (Figure 2b) bound to saturating Zα domain. The resulting fit (red) of 48.7% Z-DNA is consistent with Zα bound crystal structure of Z-JXN which is 53.3% Z-DNA having 8 of 15 base-pairs in the Z conformation24.
Next, we applied our CD approach to characterize the number of Z-DNA base-pairs in the 2AP labeled Z-CG samples. This analysis yielded on average a slightly larger number of Z-DNA base-pairs (7.7-9.3) as compared to Z-JXN (7.3-8.1), consistent with larger fluorescence enhancements measured for Z-CG (8.4X) as compared to Z-JXN (4.3X). These results reinforce the fluorescence data (Figure 2c) and suggest that Z-JXN exists as a dynamic equilibrium with varying junction location and that the Z-CG sequence biases the ensemble of junctions towards the A24 position observed in the X-ray structure. The dynamic equilibrium of Z-JXN observed in our study is consistent with previous studies involving heterogeneous Z-DNA formation with B/Z junctions47-50.
Incorporating Additional CC Steps into Z-JXN
Previous experimental studies have demonstrated the incorporation non-pyrimidine/purine steps under multiple Z-DNA favoring contexts. Single non-pyrimidine/purine steps have been incorporated into Z-DNA upon binding the Zα domain28. In another linear sequence, the incorporation of multiple non-pyrimidine/purine steps into Z-DNA required the combination of high salt (1.8M MgCl2) and ethanol (~20 %) to induce the B-to-Z transition in a sequence containing a CCGG, but without the presence of a B/Z junction51. Studies of closed-circular DNA under the influence of negative supercoiling have also shown the incorporation of single or two continuous non-pyrimidine/purine steps into Z-DNA7,49,50. We combined the fluorescence and CD approaches to examine whether additional CC steps could be incorporated into Z-DNA within the Z-JXN framework (Figure 4) upon binding the Zα domain. We used the Zα domain as a tool to probe Z-DNA formation since it binds conformation rather than sequence-specifically27,42 and its binding is reflective of a sequence’s intrinsic thermodynamic propensity form Z-DNA42,52. In Z-JXN, the syn C23 at the B/Z junction experiences favorable stacking interactions with B-DNA (Figure 1)24. Thus, we examined whether additional CC steps could be incorporated without the potential benefits of having stacking interactions with B-DNA. The X-ray structure of a CC step incorporated into a pure Z-DNA helix reveals that the syn C experiences a near complete loss stacking interactions and also undergoes significant base-pair buckling53. Thus, we expected that the incorporation of more than one CC step into Z-JXN might be unfavorable and result in a preference for locating the junction at the end of the CG repeat.
Figure 4.

Probing the incorporation of multiple CC steps into heterogeneous Z-DNA using 2AP steady state florescence. (a) Sequence of Z-JXN (black), Z-17 (red), Z-19 (green) with 2AP fluorescent probes indicated using a star. The differences between Z-JXN and Z-17 and Z-19 are highlighted in red and green, respectively. (b) Relative change in fluorescence (Zα bound intensity/free intensity) upon inducing the B-to-Z transition with saturating Zα domain. (c) Fits of Zα bound CD spectra with the location of the 2AP label relative to the 5′ end of each sequence’s (CG)3 element indicated using a star.
We designed DNA constructs in which we introduced one (Z-17) and two (Z19) additional CC steps to Z-JXN and 2AP labeled the position equivalent to A24 (Figure 4a). Strikingly, the incremental addition of Zα protein resulted in a significant increase in fluorescence intensities (11.1X and 4.6X for Z-17 and Z-19, respectively), indicating that the additional CC steps were incorporated into Z-DNA (Figure 4b). In both cases, saturation was achieved at slightly higher protein:DNA molar ratios of approximately 6:1 (Figure S1). The much larger steady-state fluorescence intensity increase observed with Z-17 as compared to Z-JXN and Z-19, which have similar intensity increases, is highly reproducible, and needs explanation. One possibility is that additional Zα proteins bind the Z-17 and drive the transition to Z-DNA more to completion as compared to Z-19, which binds a similar number of proteins based on Zα saturation data, but that has one additional CC step that has to be incorporated into Z-DNA. Another possibility is that the continuous CC steps adopt different length dependent conformations when free of the Zα domain, thus modulating the observed increases in fluorescence intensities.
Fitting of the Zα bound CD spectra yielded 8.1 and 11.0 Z-form base-pairs for Z-17 and Z-19, respectively (Figure 4c). Combined with the fluorescence results, this suggests that the B/Z junction is positioned near the 2AP labels in Z-17 and Z-19 where 10 and 12 base-pairs are in Z form, respectively (Figure 4). We note that the CD prediction for Z-17 is 2 base-pairs less than if the junction localized at the 2AP labeled A28 assuming an all or nothing transition model. One possible explanation for the CD underestimation of Z-DNA is that the spectrum used for fitting, a (CG)6 in Z-DNA, might not fully agree with a non-CG Z helix, therefore reducing fitting accuracy with the continued incorporation of additional non-CG steps. However, the CD fitting of Z-19, which has 3 CC steps, agrees within 1 base-pair of the location of its de-stacked 2AP B/Z junction probe. Another possibility is that CD is sensitive to the full complexity of the protein/DNA ensemble where differing lengths of Z-DNA may exist, unlike fluorescence which is only site specifically sensitive. Regardless of the uncertainty in CD interpretation, the fluorescence enhancement observed for Z-17 unequivocally indicates that the Z-DNA helix minimally incorporated two CC steps. We did not explore further additions of CC steps as this results in long continuous stretches of guanine that have a high propensity for quadruplex formation. Thus, at least three CC steps can be incorporated into Z-DNA within heterogeneous sequences even though the currently known intrinsic B-to-Z transition thermodynamics would predict this to be a highly unfavorable process.
Role of CG Repeat and Junction/B-form DNA in Incorporating CC steps into Z-DNA
There are three contributions that can modify sequence preferences for incorporating CC steps into Z-DNA within heterogeneous sequences such as Z-JXN as compared to sequence repeats. First, CC steps may form favorable Z-DNA/Z-DNA stacks with CG repeats. Second, on the other side, CC steps may form favorable Z-DNA/B-DNA (or if the junction propagates further, Z-DNA/Z-DNA) stacks with A6-T25 in Z-JXN. Finally, localization of the junction at the flexible A24 may favor the incorporation of CC into Z-DNA because the cost of disrupting this base-pair is lower than that for other base-pairs, including the C22-G9 immediately above the CG repeat.
Attempts to examine whether the CC repeats will incorporate into Z-DNA in the absence of nearby CG repeats or the junction/B-form region of Z-JXN were complicated by the tendency of CC repeats to adopt either quadruplex or A-form like structures (Supplementary Discussion and Figures S3,4). Nevertheless, our studies and prior single molecule studies provide no evidence that CC repeats will incorporate into Z-DNA in the absence of either CG repeats or the junction/B-form region of Z-JXN33. This and other data (see below) also argues that the observed incorporation of CC steps into Z-DNA is not entirely driven by favorable sequence-specific interactions with the Zα domain.
To assess the importance of the sequence-specific Z-DNA/B-DNA stacking interactions above the junction, we used our approach to measure the extent of Z-DNA in a previously reported control sequence, TGT, (Figure 5a) in which the B-form A6-T25 base-pair above the junction is replaced with a G-C base-pair25. We previously showed that this mutation diminishes Z-DNA formation based on CD but did not rigorously quantify this effect or examine it by fluorescence25. We observed a small 3.1X increase in 2AP fluorescence upon addition of Zα domain (Figure 5b). Using our CD fitting approach, we found that the number of Z-DNA base-pairs drops from 8.1 in Z-JXN to 4.7 in the TGT mutant (Figure 5c). Thus, the junction appears to primarily localize at the end of the CG repeat as would be expected based on the known thermodynamic propensities. Thus, sequence-specific Z-DNA/B-DNA stacking interactions are an important determinant of B/Z junction location and the incorporation of CC steps into Z-DNA is not predominantly driven by favorable sequence-specific interactions with the Zα domain.
Figure 5.

Role of Junction/B-form DNA in incorporating CC steps into heterogeneous Z-DNA using 2AP steady state florescence. (a) Sequence of Z-JXN (black), TGT (red), TAC (blue) with 2AP fluorescent probes indicated using a star. The differences between Z-JXN and TGT and TAC are highlighted in red and blue, respectively. (b) Relative change in fluorescence (Zα bound intensity/free intensity) upon inducing the B-to-Z transition with saturating Zα domain. (c) Fits of Zα bound CD spectra with the location of the 2AP label relative to the 5′ end of each sequence’s (CG)3 element indicated using a star.
To assess the importance of sequence-specific extrusion of base-pairs, we studied a sequence, TAC, (Figure 5a) in which the junction T7-A24 is replaced with a stronger C-G base-pair. We previously showed that this mutation diminishes Z-DNA formation but did not rigorously quantify this effect25. Unlike Z-JXN and TGT we were unable to directly probe the incorporation of the CC step into Z-DNA by monitoring 2AP fluorescence at position 24 due to the A to G mutation. However, we inserted a 2AP at A6 and observed an insignificant (1.1X) change in fluorescence upon addition of Zα, consistent with no helical transition at A6 (Figure 5b). Using our CD fitting approach, we found that the number of Z-DNA base-pairs drops from 8.1 in Z-JXN to 5.1 in the TAC mutant, again indicating that the junction primarily localizes at the end of the CG repeat (Figure 5c). Thus, the sequence-specific energetics for extruding base-pairs are also an important determinant of B/Z junction location. These data also reinforce that the incorporation of CC steps into Z-DNA is not predominantly driven by favorable sequence-specific interactions with the Zα domain.
Incorporating Other Steps into Z-DNA within Heterogeneous Sequences
Finally, we examined if dinucleotide steps other than CC could be incorporated into Z-DNA within the Z-JXN framework. We began by substituting the CC step in Z-17 that neighbors the CG repeats with a Z-DNA favorable CG step (Figure 6a, Z-17CG). Insertion of the CG is predicted to make Z-17CG energetically more Z favorable than Z-17 and indeed fluorescence (12.8X) and CD data (11.3 base-pairs) suggest that the junction is localized at A28 similar to Z-17. Next we made a similar substitution with either a GC (Figure 6a, Z-17GC) or GG (Figure 6a, Z-17GG) step. The free energy cost to undergo the B-to-Z transition in these two steps is predicted to be either two-fold higher (for GC) or equal (for GG) to that of CC steps20. In both cases, we observed small (2.9X and 3.1X for Z-17GC and Z-17GG respectively) changes in fluorescence upon addition of Zα domain and CD fitting suggesting that only 5.1 and 6.1 base-pairs were in the Z conformation, respectively (Figure 6b,c). Thus, in both cases, the B/Z junction does not localize at A28, but rather, most likely localizes at the end of the (CG)3 repeat. These data suggest that the thermodynamic advantage of forming the favorable CCA junction is outweighed by the penalty associated with incorporating the GC and GG steps into Z-DNA when binding the Zα domain. Both of these examples help to highlight the energetic tug of war between junction formation and extension of Z-DNA helices where the stacking of dinucleotides within the Z-DNA helix also determine the extent of Z-DNA formation.
Figure 6.

Examining the incorporation of GC and GG steps into heterogeneous Z-DNA using 2AP steady state florescence. (a) Sequence of Z-17 (red), Z-17CG (purple), Z-17GC (green), Z 17GG (blue) with 2AP fluorescent probes indicated using a star. The differences between Z17, Z-17CG, Z17-GC, and Z17-GG are highlighted in red, purple, green, and blue, respectively. (b) Relative change in fluorescence (Zα bound intensity/free intensity) upon inducing the B-to-Z transition with saturating Zα domain. (c) Fits of Zα bound CD spectra with the location of the 2AP label relative to the 5′ end of each sequence’s (CG)3 element indicated using a star.
Conclusions
In conclusion, we have developed a method to determine the location of B/Z junctions within heterogonous DNA duplexes that contain B- and Z-DNA that combines 2AP fluorescence with a new quantitative application of CD spectroscopy for determining the fraction of B- versus Z-DNA in heterogeneous sequences. Application of this method revealed that as many as three CC steps, which are thought to disfavor the Z-DNA conformation, can readily be incorporated into Z-DNA with simultaneous B/Z junction formation upon binding the Zα domain. Our results argue against preferential incorporation of CC steps into Z-DNA due to sequence-specific interactions with the Zα domain. Rather, our results suggest that the incorporation of CC steps into Z-DNA is driven by favorable sequence-specific Z/Z and B/Z stacking interactions as well as by sequence-specific energetics for creating distorted B/Z junctions within heterogeneous sequences. Taken together, this study highlights higher order complexities within the Z-DNA code and suggests that Z-DNA might propagate into a wider range of sequence space than previously thought. Finally, we note that formation of Z-DNA in vivo requires the formation of two unfavorable B/Z junctions while simultaneously competing with a multitude proteins that do not bind Z-DNA such as histones adding additional layers of complexity into the Z-DNA code that requires further investigation.
Supplementary Material
Acknowledgement
We thank Dr. James Windak for maintenance of the University of Michigan chemistry departmental CD spectrometer and fluorimeter. This work was supported by the National Institutes of Health (R01 GM089846).
Funding Sources This work was supported by the National Institutes of Health (RO1 GM089846).
Footnotes
Author Contributions J.R.B. and H.M.A. conceived the experiments and J.R.B. with assistance from K.L. performed the experiments and analyzed data. The manuscript was written through contributions from all authors. All authors have given approval to the final version of the manuscript.
Supporting Information. Supplementary discussion, example fluorescence titrations, 2AP B-to-Z transition control data, and CD and fluorescence spectra of additional sequences. This material is available free of charge via the Internet at http://pubs.acs.org.
References
- 1.Wang AH, Quigley GJ, Kolpak FJ, Crawford JL, van Boom JH, van der Marel G, Rich A. Molecular structure of a left-handed double helical DNA fragment at atomic resolution. Nature. 1979;282:680–686. doi: 10.1038/282680a0. [DOI] [PubMed] [Google Scholar]
- 2.Rich A, Zhang S. Timeline: Z-DNA: the long road to biological function. Nat Rev Genet. 2003;4:566–572. doi: 10.1038/nrg1115. [DOI] [PubMed] [Google Scholar]
- 3.Pohl FM, Jovin TM. Salt-induced co-operative conformational change of a synthetic DNA: equilibrium and kinetic studies with poly (dG-dC) J Mol Biol. 1972;67:375–396. doi: 10.1016/0022-2836(72)90457-3. [DOI] [PubMed] [Google Scholar]
- 4.Peck LJ, Nordheim A, Rich A, Wang JC. Flipping of cloned d(pCpG)n.d(pCpG)n DNA sequences from right- to left-handed helical structure by salt, Co(III), or negative supercoiling. Proc Natl Acad Sci U S A. 1982;79:4560–4564. doi: 10.1073/pnas.79.15.4560. [DOI] [PMC free article] [PubMed] [Google Scholar]
- 5.Singleton CK, Klysik J, Stirdivant SM, Wells RD. Left-handed Z-DNA is induced by supercoiling in physiological ionic conditions. Nature. 1982;299:312–316. doi: 10.1038/299312a0. [DOI] [PubMed] [Google Scholar]
- 6.Haniford DB, Pulleyblank DE. Facile transition of poly[d(TG) × d(CA)] into a left-handed helix in physiological conditions. Nature. 1983;302:632–634. doi: 10.1038/302632a0. [DOI] [PubMed] [Google Scholar]
- 7.Ellison MJ, Kelleher RJ, 3rd, Wang AH, Habener JF, Rich A. Sequence-dependent energetics of the B-Z transition in supercoiled DNA containing nonalternating purine-pyrimidinesequences. Proc Natl Acad Sci U S A. 1985;82:8320–8324. doi: 10.1073/pnas.82.24.8320. [DOI] [PMC free article] [PubMed] [Google Scholar]
- 8.Ellison MJ, Feigon J, Kelleher RJ, 3rd, Wang AH, Habener JF, Rich A. An assessment of the Z-DNA forming potential of alternating dA-dT stretches in supercoiled plasmids. Biochemistry. 1986;25:3648–3655. doi: 10.1021/bi00360a026. [DOI] [PubMed] [Google Scholar]
- 9.Herbert AG, Rich A. A method to identify and characterize Z-DNA binding proteins using a linear oligodeoxynucleotide. Nucleic Acids Res. 1993;21:2669–2672. doi: 10.1093/nar/21.11.2669. [DOI] [PMC free article] [PubMed] [Google Scholar]
- 10.Herbert A, Lowenhaupt K, Spitzner J, Rich A. Chicken double-stranded RNA adenosine deaminase has apparent specificity for Z-DNA. Proc Natl Acad Sci U S A. 1995;92:7550–7554. doi: 10.1073/pnas.92.16.7550. [DOI] [PMC free article] [PubMed] [Google Scholar]
- 11.Liu LF, Wang JC. Supercoiling of the DNA template during transcription. Proc Natl Acad Sci U S A. 1987;84:7024–7027. doi: 10.1073/pnas.84.20.7024. [DOI] [PMC free article] [PubMed] [Google Scholar]
- 12.Wittig B, Dorbic T, Rich A. Transcription is associated with Z-DNA formation in metabolically active permeabilized mammalian cell nuclei. Proc Natl Acad Sci U S A. 1991;88:2259–2263. doi: 10.1073/pnas.88.6.2259. [DOI] [PMC free article] [PubMed] [Google Scholar]
- 13.Wittig B, Wolfl S, Dorbic T, Vahrson W, Rich A. Transcription of human c-myc in permeabilized nuclei is associated with formation of Z-DNA in three discrete regions of the gene. Embo J. 1992;11:4653–4663. doi: 10.1002/j.1460-2075.1992.tb05567.x. [DOI] [PMC free article] [PubMed] [Google Scholar]
- 14.Garner MM, Felsenfeld G. Effect of Z-DNA on nucleosome placement. J Mol Biol. 1987;196:581–590. doi: 10.1016/0022-2836(87)90034-9. [DOI] [PubMed] [Google Scholar]
- 15.Liu R, Liu H, Chen X, Kirby M, Brown PO, Zhao K. Regulation of CSF1 promoter by the SWI/SNF-like BAF complex. Cell. 2001;106:309–318. doi: 10.1016/s0092-8674(01)00446-9. [DOI] [PubMed] [Google Scholar]
- 16.Wong B, Chen S, Kwon JA, Rich A. Characterization of Z-DNA as a nucleosome-boundary element in yeast Saccharomyces cerevisiae. Proc Natl Acad Sci U S A. 2007;104:2229–2234. doi: 10.1073/pnas.0611447104. [DOI] [PMC free article] [PubMed] [Google Scholar]
- 17.Rich A, Nordheim A, Wang AH. The chemistry and biology of left-handed Z-DNA. Annual review of biochemistry. 1984;53:791–846. doi: 10.1146/annurev.bi.53.070184.004043. [DOI] [PubMed] [Google Scholar]
- 18.Peck LJ, Wang JC. Energetics of B-to-Z transition in DNA. Proc Natl Acad Sci U S A. 1983;80:6206–6210. doi: 10.1073/pnas.80.20.6206. [DOI] [PMC free article] [PubMed] [Google Scholar]
- 19.Vologodskii AV, Frank-Kamenetskii MD. Left-handed Z form in superhelical DNA: a theoretical study. J Biomol Struct Dyn. 1984;1:1325–1333. doi: 10.1080/07391102.1984.10507523. [DOI] [PubMed] [Google Scholar]
- 20.Ho PS, Ellison MJ, Quigley GJ, Rich A. A Computer-Aided Thermodynamic Approach for Predicting the Formation of Z-DNA in Naturally-Occurring Sequences. Embo Journal. 1986;5:2737–2744. doi: 10.1002/j.1460-2075.1986.tb04558.x. [DOI] [PMC free article] [PubMed] [Google Scholar]
- 21.Li H, Xiao J, Li JM, Lu L, Feng S, Droge P. Human genomic Z-DNA segments probed by the Z domain of ADAR1. Nucleic Acids Res. 2009;37:2737–2746. doi: 10.1093/nar/gkp124. [DOI] [PMC free article] [PubMed] [Google Scholar]
- 22.Zhabinskaya D, Benham CJ. Theoretical Analysis of the Stress Induced B-Z Transition in Superhelical DNA. Plos Computational Biology. 2011;7 doi: 10.1371/journal.pcbi.1001051. [DOI] [PMC free article] [PubMed] [Google Scholar]
- 23.Ho PS. Thermogenomics: thermodynamic-based approaches to genomic analyses of DNA structure. Methods. 2009;47:159–167. doi: 10.1016/j.ymeth.2008.09.007. [DOI] [PubMed] [Google Scholar]
- 24.Ha SC, Lowenhaupt K, Rich A, Kim YG, Kim KK. Crystal structure of a junction between B-DNA and Z-DNA reveals two extruded bases. Nature. 2005;437:1183–1186. doi: 10.1038/nature04088. [DOI] [PubMed] [Google Scholar]
- 25.Bothe JR, Lowenhaupt K, Al-Hashimi HM. Sequence-Specific B-DNA Flexibility Modulates Z-DNA Formation. J Am Chem Soc. 2011;133:2016–2018. doi: 10.1021/ja1073068. [DOI] [PMC free article] [PubMed] [Google Scholar]
- 26.Schwartz T, Rould MA, Lowenhaupt K, Herbert A, Rich A. Crystal structure of the Zalpha domain of the human editing enzyme ADAR1 bound to left-handed Z-DNA. Science. 1999;284:1841–1845. doi: 10.1126/science.284.5421.1841. [DOI] [PubMed] [Google Scholar]
- 27.Ha SC, Choi J, Hwang HY, Rich A, Kim YG, Kim KK. The structures of non-CG-repeat Z-DNAs co-crystallized with the Z-DNA-binding domain, hZ alpha(ADAR1) Nucleic Acids Res. 2009;37:629–637. doi: 10.1093/nar/gkn976. [DOI] [PMC free article] [PubMed] [Google Scholar]
- 28.Kim YG. Protein-induced sequence diversity of Z-DNA. B Kor Chem Soc. 2007;28:1063–1066. [Google Scholar]
- 29.Sheardy RD, Winkle SA. Temperature-Dependent Cd and Nmr-Studies on a Synthetic Oligonucleotide Containing a B-Z Junction at High Salt. Biochemistry. 1989;28:720–725. doi: 10.1021/bi00428a046. [DOI] [PubMed] [Google Scholar]
- 30.Doktycz MJ, Benight AS, Sheardy RD. Energetics of B-Z Junction Formation in a 16 Base-Pair Duplex DNA. J Mol Biol. 1990;212:3–6. doi: 10.1016/0022-2836(90)90297-Y. [DOI] [PubMed] [Google Scholar]
- 31.Dai Z, Thomas GA, Evertsz E, Peticolas WL. The Length of a Junction between the B-Conformations and Z-Conformations in DNA Is 3 Base-Pairs or Less. Biochemistry. 1989;28:6991–6996. doi: 10.1021/bi00443a032. [DOI] [PubMed] [Google Scholar]
- 32.Peticolas WL, Dai Z, Thomas GA. The Use of Raman-Spectroscopy to Characterize Double B/Z Conformational Junctions in DNA. Journal of Molecular Structure. 1991;242:135–141. [Google Scholar]
- 33.Bae S, Kim D, Kim KK, Kim YG, Hohng S. Intrinsic Z-DNA is stabilized by the conformational selection mechanism of Z-DNA-binding proteins. J Am Chem Soc. 2011;133:668–671. doi: 10.1021/ja107498y. [DOI] [PubMed] [Google Scholar]
- 34.Lee YM, Kim HE, Park CJ, Lee AR, Ahn HC, Cho SJ, Choi KH, Choi BS, Lee JH. NMR study on the B-Z junction formation of DNA duplexes induced by Z-DNA binding domain of human ADAR1. J Am Chem Soc. 2012;134:5276–5283. doi: 10.1021/ja211581b. [DOI] [PubMed] [Google Scholar]
- 35.Kim D, Reddy S, Kim DY, Rich A, Lee S, Kim KK, Kim YG. Base extrusion is found at helical junctions between right- and left-handed forms of DNA and RNA. Nucleic Acids Res. 2009;37:4353–4359. doi: 10.1093/nar/gkp364. [DOI] [PMC free article] [PubMed] [Google Scholar]
- 36.Reddy YV, Rao DN. Binding of EcoP15I DNA methyltransferase to DNA reveals a large structural distortion within the recognition sequence. J Mol Biol. 2000;298:597–610. doi: 10.1006/jmbi.2000.3673. [DOI] [PubMed] [Google Scholar]
- 37.Gowher H, Jeltsch A. Molecular enzymology of the EcoRV DNA-(Adenine N (6))-methyltransferase: kinetics of DNA binding and bending, kinetic mechanism and linear diffusion of the enzyme on DNA. J Mol Biol. 2000;303:93–110. doi: 10.1006/jmbi.2000.4127. [DOI] [PubMed] [Google Scholar]
- 38.Beck C, Jeltsch A. Probing the DNA interface of the EcoRV DNA-(adenine-N6)-methyltransferase by site-directed mutagenesis, fluorescence spectroscopy, and UV cross-linking. Biochemistry. 2002;41:14103–14110. doi: 10.1021/bi025979a. [DOI] [PubMed] [Google Scholar]
- 39.Tashiro R, Sugiyama H. A nanothermometer based on the different pi stackings of B- and Z-DNA. Angewandte Chemie. 2003;42:6018–6020. doi: 10.1002/anie.200352752. [DOI] [PubMed] [Google Scholar]
- 40.Schwartz T, Lowenhaupt K, Kim YG, Li L, Brown BA, 2nd, Herbert A, Rich A. Proteolytic dissection of Zab, the Z-DNA-binding domain of human ADAR1. J Biol Chem. 1999;274:2899–2906. doi: 10.1074/jbc.274.5.2899. [DOI] [PubMed] [Google Scholar]
- 41.Greenfield NJ. Using circular dichroism spectra to estimate protein secondary structure. Nature protocols. 2006;1:2876–2890. doi: 10.1038/nprot.2006.202. [DOI] [PMC free article] [PubMed] [Google Scholar]
- 42.Herbert A, Schade M, Lowenhaupt K, Alfken J, Schwartz T, Shlyakhtenko LS, Lyubchenko YL, Rich A. The Zalpha domain from human ADAR1 binds to the Z-DNA conformer of many different sequences. Nucleic Acids Res. 1998;26:3486–3493. doi: 10.1093/nar/26.15.3486. [DOI] [PMC free article] [PubMed] [Google Scholar]
- 43.Ivanov V, Grzeskowiak K, Zocchi G. Evidence for an intermediate state in the B-to-Z transition of DNA. Journal of Physical Chemistry B. 2003;107:12847–12850. [Google Scholar]
- 44.Sheardy RD, Suh D, Kurzinsky R, Doktycz MJ, Benight AS, Chaires JB. Sequence dependence of the free energy of B-Z junction formation in deoxyoligonucleotides. J Mol Biol. 1993;231:475–488. doi: 10.1006/jmbi.1993.1295. [DOI] [PubMed] [Google Scholar]
- 45.Schade M, Turner CJ, Kuhne R, Schmieder P, Lowenhaupt K, Herbert A, Rich A, Oschkinat H. The solution structure of the Zalpha domain of the human RNA editing enzyme ADAR1 reveals a prepositioned binding surface for Z-DNA. Proc Natl Acad Sci U S A. 1999;96:12465–12470. doi: 10.1073/pnas.96.22.12465. [DOI] [PMC free article] [PubMed] [Google Scholar]
- 46.Dallmann A, Dehmel L, Peters T, Mugge C, Griesinger C, Tuma J, Ernsting NP. 2-Aminopurine incorporation perturbs the dynamics and structure of DNA. Angewandte Chemie. 2010;49:5989–5992. doi: 10.1002/anie.201001312. [DOI] [PubMed] [Google Scholar]
- 47.Hayes TE, Dixon JE. Z-DNA in the rat somatostatin gene. J Biol Chem. 1985;260:8145–8156. [PubMed] [Google Scholar]
- 48.Johnston BH, Ohara W, Rich A. Stochastic distribution of a short region of Z-DNA within a long repeated sequence in negatively supercoiled plasmids. J Biol Chem. 1988;263:4512–4515. [PubMed] [Google Scholar]
- 49.Kladde MP, Kohwi Y, Kohwi-Shigematsu T, Gorski J. The non-B-DNA structure of d(CA/TG)n differs from that of Z-DNA. Proc Natl Acad Sci U S A. 1994;91:1898–1902. doi: 10.1073/pnas.91.5.1898. [DOI] [PMC free article] [PubMed] [Google Scholar]
- 50.Ho PS. The non-B-DNA structure of d(CA/TG)n does not differ from that of Z-DNA. Proc Natl Acad Sci U S A. 1994;91:9549–9553. doi: 10.1073/pnas.91.20.9549. [DOI] [PMC free article] [PubMed] [Google Scholar]
- 51.Eichman BF, Schroth GP, Basham BE, Ho PS. The intrinsic structure and stability of out-of-alternation base pairs in Z-DNA. Nucleic Acids Res. 1999;27:543–550. doi: 10.1093/nar/27.2.543. [DOI] [PMC free article] [PubMed] [Google Scholar]
- 52.Seo YJ, Ahn HC, Lee EH, Bang J, Kang YM, Kim HE, Lee YM, Kim K, Choi BS, Lee JH. Sequence discrimination of the Zalpha domain of human ADAR1 during B-Z transition of DNA duplexes. FEBS letters. 2010;584:4344–4350. doi: 10.1016/j.febslet.2010.09.036. [DOI] [PubMed] [Google Scholar]
- 53.Schroth GP, Kagawa TF, Ho PS. Structure and thermodynamics of nonalternating C.G base pairs in Z-DNA: the 1.3-A crystal structure of the asymmetric hexanucleotide d(m5CGGGm5CG).d(m5CGCCm5CG) Biochemistry. 1993;32:13381–13392. doi: 10.1021/bi00212a002. [DOI] [PubMed] [Google Scholar]
Associated Data
This section collects any data citations, data availability statements, or supplementary materials included in this article.