

Abstract
This paper describes a novel optical method for label-free quantitative imaging of cerebral blood flow (CBF) and intracellular motility (IM) in the rodent cerebral cortex. This method is based on a technique that integrates dynamic light scattering (DLS) and optical coherence tomography (OCT), named DLS–OCT. The technique measures both the axial and transverse velocities of CBF, whereas conventional Doppler OCT measures only the axial one. In addition, the technique produces a three-dimensional map of the diffusion coefficient quantifying nontranslational motions. In the DLS–OCT diffusion map, we observed high-diffusion spots, whose locations highly correspond to neuronal cell bodies and whose diffusion coefficient agreed with that of the motion of intracellular organelles reported in vitro in the literature. Therefore, the present method has enabled, for the first time to our knowledge, label-free imaging of the diffusion-like motion of intracellular organelles in vivo. As an example application, we used the method to monitor CBF and IM during a brief ischemic stroke, where we observed an induced persistent reduction in IM despite the recovery of CBF after stroke. This result supports that the IM measured in this study represent the cellular energy metabolism-related active motion of intracellular organelles rather than free diffusion of intracellular macromolecules.
Keywords: acute stroke, animal models, cerebral blood flow measurement, microscopy, optical imaging
Introduction
The energy-consuming active motion of intracellular organelles is an important physiological quantity as it is directly related to cellular metabolism and viability. This intracellular motility (IM) has been shown to exhibit diffusion-like dynamics by using either fluorescence label-based methods1, 2 or label-free methods based on dynamic light scattering (DLS) analysis.3, 4, 5, 6, 7 However, IM has not been imaged in the cerebral cortex of a living animal, probably because the dynamics are obscured by the larger contribution from cerebral blood flow (CBF). In this paper, we describe a novel method for label-free in vivo imaging of both IM and CBF.
The method is based on a technique integrating DLS and optical coherence tomography (OCT), named DLS–OCT. DLS is used to measure flow and diffusion of particles,8, 9 while OCT is used for high-resolution three-dimensional (3D) imaging of tissue structure;10, 11 and thus the integration enables 3D imaging of flow and diffusion of constituents in tissue. We show that the method enables simultaneous 3D imaging of IM and CBF in the cortex by exploiting the spatial resolution of OCT and using the fact that the former is diffusive while the latter is translational. This ability will provide a means of simultaneous long-term monitoring of blood perfusion and IM in vivo without the aid of exogenous contrast agents.
In addition to IM, the DLS–OCT technique provides quantitative imaging of CBF, which is useful for the study of brain pathophysiology. Laser Doppler flowmetry is used to measure blood flow at a fixed point,12, 13 and its imaging corollary provides the two-dimensional map of blood flow.14 Doppler OCT enables depth-resolved measurement of axial flow velocity with microscopic resolution, resulting in a 3D map of blood flow.15 Compared with these techniques, DLS–OCT can measure both the speed and angle of flow velocity in a volumetric way.
Dynamic light scattering–optical coherence tomography imaging of the rodent cerebral cortex resulted in 3D maps of the diffusion coefficient, the flow velocity, and the coefficient of determination that quantifies how much the motion is close to either flow or diffusion. Combining these information revealed CBF in vessels with capillary resolution and IM in neuronal cell bodies with cellular resolution. The utility of the method is shown by a preliminary application investigating the effect of ischemic stroke on CBF and IM in the animal model.
Materials and Methods
Animal Preparation
Sprague–Dawley rats (250–300 g, n=3) were initially anesthetized with isofluorane (1.5–2.5%, v/v), and ventilated with a mixture of air and oxygen during surgical procedures. Tracheotomy and cannulation of the femoral artery and vein were done. After this, the head was fixed in a stereotaxic frame, and the scalp retracted. A craniotomy was performed using a saline-cooled dental drill and a 3 mm × 3 mm area over the somatosensory cortex was exposed. The dura was carefully removed, and then the brain surface was covered with agarose gel and a glass coverslip and sealed with dental acrylic cement. After surgery, rats were anesthetized with a mixture of ketamine–xylazine (20 mg/kg/hour–2 mg/kg/hour, intravenously) and moved to our OCT system for experiment. Physiological signs such as heart rate, body temperature, and blood pressure were continuously monitored during surgery and during the experiment.
For the stroke animal model, 3-month-old mice (n=3) were subjected to 1-hour transient middle cerebral artery occlusion (MCAO). A day before imaging, the thinned and reinforced skull procedure was performed on the right side of the skull. An area up to 3 mm by 3 mm over the right somatosensory cortex was thinned using a drill. Thinning was only performed for a few seconds at a time and the skull was constantly wetted with saline to prevent heating. During the thinning process, the drill bit was moved with the axis of rotation to minimize chatter and create a smoother surface. The final thickness of the skull was 10–50 μm, with the pial vessels clearly visible through the wetted bone. After polishing with the drill, the skull was washed and let to briefly dry. A drop of cyanoacrylate glue (no. 31428 H04308, ND Industries, Clawson, MI, USA) was put on the thinned region and an 8-mm diameter glass coverslip was used to cap the glue. For MCAO, a nylon monofilament was inserted via the external carotid under laser Doppler flowmetry monitoring. The monofilament nylon suture with its tip rounded by heating near a flame was introduced until it blocked the origin of the middle cerebral artery. Immediately after MCAO, animals were moved to our OCT imaging system. Once the imaging was completed, reperfusion was achieved by withdrawal of the suture until the tip cleared the middle cerebral artery, which took less than an hour, and then another DLS–OCT imaging was performed.
All animal experimental procedures were reviewed and approved by the Massachusetts General Hospital Subcommittee on Research Animal Care, according to the guidelines and policies of office of laboratory animal welfare (OLAW) and public health service, National Institutes of Health.
Spectral-Domain–Optical Coherence Tomography System and Scanning Protocol
We optimized an spectral-domain–OCT system (Thorlabs, Newton, NJ, USA) for dynamic in vivo imaging of the rodent cerebral cortex as described in a previous publication (Figure 1).16 We used a large-bandwidth near infrared light source (1310±170 nm) for a large imaging depth (1 mm) and high axial resolution (3.5 μm in tissue). The light source with the center wavelength of 1300 nm was used as it offers a larger imaging depth than conventional 800-nm light sources. Even though water absorption is larger in 1300 nm, light scattering is smaller so that the overall imaging depth becomes larger. The spectrum of interfered light is measured with a 1024-pixel InGaAs line scan camera (i.e., 0.17-nm spectral sampling frequency) at 47,000 spectra/second. In this study, we used three objective lenses ( × 5, × 10, and × 40) with transverse resolutions of 7, 3.5, and 0.9 μm. Each objective was used with different spatial scanning steps of 2.8, 1.4, and 0.7 μm, respectively. The surface of the cortex is illuminated by another light source, with a wavelength of 570±5 nm, so that the cortical surface is simultaneously imaged by a charge-coupled device.
Figure 1.

Schematics of the spectral-domain–optical coherence tomography (OCT) system for in vivo dynamic light scattering–OCT imaging of the rodent cerebral cortex. CCT, charge-coupled device; SLD, superluminescent diode; QTH, quartz tungsten halogen.
A-scans (1D scans) were repeated 100 times at a fixed position, and this scanning was repeated in the raster manner to scan the 3D volume of interest in the cortex. Raw data of the OCT spectrum were acquired, and the complex-valued spectral-domain–OCT signals were obtained from the spectrum data. An angiogram was obtained using the method described previously.16, 17, 18
Dynamic Light Scattering–Optical Coherence Tomography Analysis
Technical details of DLS–OCT theory and analysis have been described in our previous publication.19 In brief, dynamic OCT imaging of a sample produced four-dimensional (space and time) data of the complex-valued reflectivity, R(r, t). The field autocorrelation function was obtained as
 |
where * denotes the complex conjugate,<>t means the averaging over time, and E[ ] means the average over initial positions of the scatterers. We used the DLS–OCT model derived under the assumption that static and moving particles are mixed in the resolution volume of OCT and the moving particles can exhibit either translational or diffusive motion:
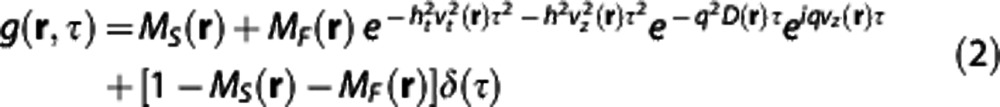 |
where MS(r), MF(r), vt(r), vz(r), and D(r) are the parameters of particle dynamics to be estimated for each position, while the others are the parameters given by the measurement system (all physical quantities used in this paper are listed in Supplementary Table S1). MS is the fraction of the static particles, MF is the fraction of the moving particles, vt is the transverse component of the flow velocity, vz is the axial component, and D is the effective diffusion coefficient quantifying the diffusive motion of particles. This autocorrelation function adequately explained the general behavior of the measured one (Figure 2A).
Figure 2.

Validation of dynamic light scattering–optical coherence tomography (DLS–OCT) analysis. (A) An example of the autocorrelation function of the OCT signal measured in the cerebral cortex of a living animal. Data of the complex-valued field autocorrelation function are presented in the complex plane (left), where each spot represents the autocorrelation function value for each timelag (time difference=20 μs). Data (spots) are chosen from a voxel with a vessel, and its fitting result (line) shows that our model effectively explains the measured autocorrelation function. The center and right panels present the magnitude and phase of the MF-term in Equation 2, respectively. (B) Phantom experiments for validation of DLS–OCT measurement of the velocity (left and center) and diffusion (right). The gray line in the right panel shows the Einstein–Stokes equation. Data are presented in mean±s.d. The panel B is reprinted from our previous paper.19
In practice, the four-dimensional field autocorrelation function (for 25 timelag points with the temporal difference of 20 μs) was convolved with a 3 × 3 × 3 (in voxels) spatial kernel, as the autocorrelation function requires the average over initial particle positions (Equation 1). While the axial size of the convolution kernel was constant as 10 μm, its lateral size varied across objectives: 8.4, 4.2, and 2.1 μm for the × 5, × 10, and × 40 objectives, respectively. Analysis of the autocorrelation function data led to 3D maps of the axial velocity, the transverse velocity, the diffusion coefficient, and the coefficient of determination. The values for poorly fitted voxels (R2<0.5, less than 0.1% in population) were replaced with the mean value of the neighboring well-fitted voxels. As noise can result in a small MF and large v or D, the velocity and diffusion maps were weighted by MF, while MF smaller than 0.1 was forced to zero. Then, each map was convolved with a 3D Gaussian kernel (five voxels in diameter).
Validation of DLS–OCT Measurement
Phantom experiments validated DLS–OCT measurement of the flow velocity and diffusion (Figure 2B). For the velocity measurement, a piezoelectrically actuated static sample was used to simulate axial movements of particles, while transverse movements were implemented by galvanometric lateral scanning of OCT beam. The absolute and axial velocities were reliably measured across various true values of the flow velocity and angle, where the absolute velocity is v=(vt2+vz2)1/2. Microsphere samples of 0.1 and 1 μm in diameter were used for validating the diffusion measurement. The measured diffusion coefficient agreed with the theoretical values given by the Einstein–Stokes equation. The diffusion coefficient was estimated sufficiently small in the velocity phantom experiment, while the diffusion phantom experiment resulted in negligible velocities. These results confirmed that DLS–OCT can effectively distinguish whether the motion is translational or diffusive and accurately measure either the flow velocity or the diffusion coefficient. More details of the phantom experiments are described in our previous paper.19
Results
Dynamic light scattering–optical coherence tomography imaging of cerebral blood flow
Analysis of the autocorrelation function data obtained in the cerebral cortex led to 3D maps of the absolute and axial velocities, the diffusion coefficient, and the coefficient of determination (R2), where R2 quantifies the goodness of fitting. As expected, the pattern of blood flow observed in the absolute velocity map was very close to that in the conventional OCT angiogram (Figure 3A, left and center), with a sufficiently large dynamic range for quantitative measurements of CBF velocity in arteries and veins (Figure 3B, center). In addition, the axial velocity map (Figure 3A, right) looked similar to conventional Doppler OCT images. The angle of flow (vz/v) agreed with the structural angle of vessels observed in the angiogram (Figure 3B, right).
Figure 3.

Dynamic light scattering–optical coherence tomography (DLS–OCT) imaging of the cerebral cortex. (A) Angiogram and DLS–OCT maps (the absolute velocity and the axial velocity). The × 5 objective lens was used. These en face images result from a maximum projection over a 200 μm depth. A negative velocity (blue) in the axial velocity map means that blood flows toward the surface of the cortex. The small range of the velocity is used for high contrast. (B) Additional analysis of the angiogram and velocity maps. Several vascular segments (n=45) were skeletonized, and the vessel diameters were estimated based on the distance transform42 (left). The absolute blood flow velocity for each vascular segment was estimated by averaging through the segment path (center). Fifty positions were chosen within the vascular segments to compare the flow angle to the structural angle (right). The flow angle was determined as cosθ=vz/v from the simultaneously obtained absolute and axial velocity maps, while the structural angle was determined from the eigenvectors of Hessian matrix of the angiogram data.43 The gray line represents the result of linear regression (y=0.92 x − 0.03, P<0.001). (C) Angiogram and DLS–OCT maps (the absolute velocity, diffusion, and the coefficient of determination) with the × 10 objective. The diffusion image (yellow) is overlaid with the absolute velocity image (red). While the en face images (top) result from maximum projection over a 200 μm depth, the XZ cross-section images (bottom) result from a projection over a 100-μm thickness along the transverse Y-axis. In contrast, only a single plane is presented for the R2 image to clearly show the cross-sections of thin vessel walls. The small range of the velocity and diffusion is used for high contrast. Scale bars, 200 μm.
The diffusion map superimposed with the velocity map revealed the motion of vessel walls (Figure 3C). It is interesting that the vessel walls showed significantly lower R2 values and thus the cross-sections of the vessel walls were clearly seen in a single plane of the 3D R2 map. The low R2 suggests that the vessel walls exhibit a motion that is neither translational nor diffusive. Rather, they might exhibit physiologically induced oscillatory movements.
As our model depends on the size of the resolution volume (ht and h in Equation 2), we compared DLS–OCT images obtained with different objective lenses (i.e., different transverse sizes of the resolution volume). The × 5, × 10, and × 40 objective lenses were used, leading to the transverse sizes of voxel of 7, 3.5, and 0.9 μm, respectively. The axial size of voxel was fixed to 3.5 μm as determined by the spectral width of the light source. As shown in Figure 4, a high degree of similarity in the velocity and diffusion maps across different resolutions confirms that the present method works well not only with isotropic voxels but also with anisotropic ones. This result justifies the use of high-magnification objective lenses in DLS–OCT imaging, where high-magnification OCT images permit identification of individual neuronal cell bodies.
Figure 4.
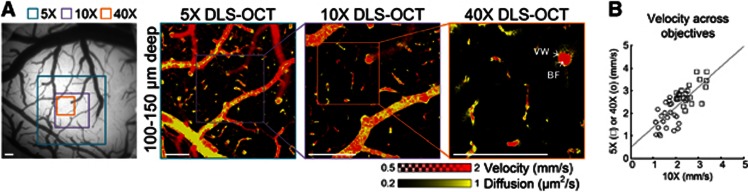
Dynamic light scattering–optical coherence tomography (DLS–OCT) imaging with different transverse resolution. (A) The scanning area for each objective lens is indicated on the charge-coupled device image of the cortical surface (left). These en face images were commonly obtained by the maximum projection over the same depth (50-μm thickness) to compare the position of the segments of vessels. BF, blood flow; VW, vessel wall. Scale bars, 200 μm. (B) For quantitative comparison of cerebral blood flow velocity measurement across different objectives, 25 identical positions were chosen between the × 10 and × 5 velocity maps (□), and another 25 positions between the × 10 and × 40 maps (o). Only positions with v>1 mm/second were chosen. The gray line represents the result of linear regression (y=0.89 x+0.49, P<0.001).
Dynamic light scattering–optical coherence tomography imaging of intracellular motility
We performed × 40 DLS–OCT imaging of the cortex at several depths, as the × 40 objective resulted in a thin volume of measurement (<50 μm in depth; Figure 5). As can be seen in the cross-section images, DLS–OCT provided a thicker volume of measurement compared with the intensity map. This advantage is attributed to the fact that the autocorrelation function in principle does not depend on the intensity of the signal, provided a sufficient signal-to-noise ratio. The high transverse resolution of the × 40 objective enabled us to identify neuronal cell bodies in the minimum intensity projection (Figure 5, MinIP). This OCT imaging of neuronal cell bodies, not astrocytes, has been shown in our previous publication with the identical imaging system.20 The distribution of the nuclei over the depth agreed with the well-known laminar distribution of neurons in the rodent cerebral cortex. Interestingly, the diffusion map revealed high-diffusion spots in the nonvascular area, and their positions were correlated with those of the nuclei. These spots were morphologically confined when viewed in the 3D map, whereas the high diffusion observed at vessel walls extended over a vascular segment. Furthermore, the high-diffusion spots exhibited high R2 values, whereas the vessel walls exhibited the characteristic low R2 values.
Figure 5.

High-magnification dynamic light scattering–optical coherence tomography (DLS–OCT) imaging of the cerebral cortex. Minimum intensity projection (MinIP) maps and DLS–OCT maps (the absolute velocity superimposed with the diffusion coefficient, and the coefficient of determination R2) are presented. Black and white circles in the third row are collocated to show the spatial correlation between the positions of neuronal cell bodies and high-diffusion spots (not all neurons are marked). Scale bar, 200 μm.
We repeatedly observed high-diffusion spots across animals (n=3), one of which is presented in Figure 6. Based on the findings of the difference in R2 between the spots and vessel walls, we produced another map of diffusion masked with high R2 (R2>0.998, green color). The positions of the green spots were highly correlated with those of neuronal cell bodies, but they generally did not fill the whole area of cell bodies (Figure 6B, for example). Some of their morphology (e.g., the first three in Figure 6B, where green spots surround a smaller dark sphere) were quite similar to those of IM in the cytoplasm observed in a high-resolution in vitro imaging study.6 The mean diffusion as a function of the distance from the nucleic center also showed that the peak diffusion did not locate at the center of cell bodies (Figure 6C). These results on morphology indicate that the green spots are distributed over the space surrounding nuclei, likely in the cytoplasm. In addition, the diffusion coefficient of the spots agrees with those of the motion of intracellular organelles measured in vitro.4, 7, 21 Therefore, the green spots likely represent the diffusion-like movements of intracellular organelles of neurons. Interpretation of this result will be further discussed later.
Figure 6.

Dynamic light scattering–optical coherence tomography (DLS–OCT) imaging of neuronal intracellular motility. (A) × 40 DLS–OCT imaging in another animal. The velocity and diffusion images (red and yellow) are superimposed with the map of diffusion with high R2 (green). White circles are collocated to visually guide the spatial correlation between the positions of neuronal cell bodies (dark spots in minimum intensity projection, MinIP) and neuronal IM (green spots). Not all cell bodies are marked. BF, blood flow; IM, intracellular motility; and VW, vessel wall. The small range of the diffusion coefficient is used to increase the image contrast. Scale bar, 200 μm. (B) Several examples of neuronal nuclei observed in MinIP and neuronal IM observed in the high-R2 diffusion map. Image size, 25 μm × 25 μm, for each. (C) The mean intensity (black) and diffusion (green) as the function of the distance from the nucleic centers (n=10). Data are presented in mean±s.d.
Preliminary Application to Ischemic Stroke Study
As an example application of DLS–OCT imaging of the cortex, we used it to investigate how CBF and IM vary before, during, and after ischemic stroke. We performed imaging through the thinned and reinforced skull in a MCAO model, 1 day before surgery, during MCAO, and 1 hour after reperfusion. The absolute velocity maps showed the effect of MCAO on the perfusion (Figure 7A). To quantify changes in CBF and IM caused by ischemia, we counted the number of voxels to obtain the volume fractions of blood flow and IM, for each depth (Figure 7B). Although IM of individual neurons were not seen as we used the × 10 objective for a thicker volume of measurement in this experiment, the depth profile of neuronal IM agreed with the tendency observed in high-magnification imaging.
Figure 7.

Dynamic light scattering–optical coherence tomography imaging of changes in cerebral blood flow and intracellular motility (IM) during ischemic stroke. (A) The absolute velocity maps 1 day before surgery, during middle cerebral artery occlusion (MCAO), and 1 hour after reperfusion. The small range of the velocity is used for high contrast. Scale bar, 200 μm. (B) The depth profile of the volume fraction of each dynamic parameter. The blood flow fraction counted the number of voxels with v>1 mm/second, while the IM fraction counted the voxels with D>0.4 μm2/second and R2>0.998. Thick lines indicate the measurement in the lateral half of the field of view (closer to the middle cerebral artery) and dotted lines indicate the medial half. (C) Changes in the volume fraction of dynamics averaged across animals (n=3). The fractions were normalized by the baseline value (1 day before MCAO). Each normalized fraction was statistically tested about the baseline. Data are presented in mean±s.d.
As a result, the depth profile of each dynamic parameter clearly shows that MCAO caused significant reductions in CBF and, interestingly, in neuronal IM. The reduction was larger in the lateral area that is closer to the occluded middle cerebral artery. After 1 hour of reperfusion, we observed the recovery of CBF and IM (Figure 7B). This tendency was repeatedly observed across three animals. The average across animals revealed that, while CBF recovered to the baseline, neuronal IM was still statistically significantly lower than the pre-stroke baseline despite the 1 hour of reperfusion (Figure 7C).
Discussion and Conclusion
Label-free optical imaging of tissue dynamics generally provides high spatial resolution while being free of several limitations such as phototoxicity and pharmacological side effects; and the present method inherits these general advantages. In addition, DLS–OCT can determine whether the motion is diffusive or translational, enabling simultaneous imaging of CBF and IM. The results also offer the possibility of exploiting R2 and MF as additional contrast mechanisms. The R2 map quantitatively images the degree of how much the motion is close to translational or diffusive ones; and for example, it revealed vessel walls as they exhibited motions neither close to flow nor diffusion. The single plane slices of the R2 map clearly visualized the vessel boundaries (Figure 3C), and thus they will be useful for in vivo studies of vessel wall dynamics including vasodilation and vasoconstriction. The MF map will quantify the fraction of moving particles in each voxel, which is similar to the mobile fraction suggested in nonergodic DLS studies.22, 23
One of the limitations of the present method is the low temporal resolution. Reliable estimation of the dynamic parameters from the autocorrelation function requires a sufficient number of consecutive scans for each position, causing a long imaging time. For example, one volumetric DLS–OCT imaging that consists of 400 × 400 × 100 A-scans (x × y × t) took more than 10 minutes using our system equipped with a 47-kHz spectrometer. This speed may be suitable for some studies like the stroke experiment shown in Figure 7, but may not be sufficient for other studies like functional imaging of CBF responses to somatosensory activation. The volume rate would be enhanced by using a faster OCT system (e.g., VCSEL-based swept-source OCT24), a smaller field of view, and an optimal scanning strategy.
As biological systems generally have heterogeneous scattering centers, our measurement of flow and diffusion might be the ensemble averages of different movements of several types of particles within the resolution volume, as suggested in fluorescence correlation microscopy studies.25 A large variety of scatterers, in terms of size and shape, can be found in biological systems: from single proteins to RBCs. According to Mie scattering theory (Supplementary Fig. S1), scatterers ranging in size from 0.1 to 10 μm are mainly responsible for the OCT signal in our system (1300-nm center wavelength). This range in the scatterer size encompasses intracellular organelles and RBCs. Thus, RBC flow rather than plasma flow is likely the major source of decorrelation of the OCT signal in vessels, and thereby the sharp low-R2 boundaries (Figure 3C) might be because of neither-diffusive-nor-translational motions of the vessel wall rather than perivascular fluid flow (this has yet to be experimentally validated in the future, though). Small intracellular constituents such as ribosomes and proteasomes are too small to contribute significantly to the OCT signal. Therefore, the diffusion coefficient measured as IM in the result might be the ensemble average of the motions of several types of intracellular organelles.
In Figure 3B, we skeletonized several vessels to estimate the mean vessel diameter (left) and flow velocity (center) averaged through their center lines. These measurements of the diameter and velocity offer the feasibility of flow quantification, even in horizontally lied vessels where conventional Doppler OCT is difficult to quantify the flow. However, more accurate quantification of flow will require an additional image processing for an area integral of the velocity map over the vessel's cross-section normal to its center line. As this paper focuses on distinctive measurement of velocity and diffusion, the additional image processing will be further developed and discussed in the future.
It is physiologically important to measure the blood flow velocity in the range of 0 to 1 mm/second, as many RBCs flow at this velocity range in capillaries of the brain cortex.26, 27, 28 Unfortunately, capillary structures were less clear in the DLS–OCT velocity map when compared with the conventional OCT angiogram (Figure 3C). This limitation is likely because of the short decorrelation time used in this paper (max. timelag=0.5 ms) and/or the discrete nature of RBC flow in capillaries. Our experience in the OCT angiogram supports that time gaps larger than 3 ms generally result in a sufficiently large decorrelation of the OCT signal for clear capillary structure visualization (4 ms was used in Figure 3). This means that the DLS–OCT decorrelation time (0.5 ms) may not be sufficient for quantifying slow RBC flow in capillaries. Furthermore, RBCs typically flow one by one in capillaries. This discrete nature likely led to further reduction in the measured velocity with spatial convolution. Finally, the dynamic range of velocity measurement depends on the size of the probing volume as well, and thus a smaller probing volume will be more advantageous in quantifying lower flow velocities (note that the lower velocity range was effective to reveal capillary flow in Figure 6, where the × 40 objective was used). These limitations could be overcome by using a longer acquisition/correlation time of DLS–OCT imaging and/or a smaller probing volume, but has yet to be validated. As this paper focuses on distinctive imaging of flow and diffusion in the brain cortex, quantitative DLS–OCT measurement of capillary blood flow velocity will be further investigated in the future.
The map of high-R2 diffusion revealed high-diffusion spots representing neuronal IM (green spots in Figure 6). The evidence supporting this conclusion can be summarized by: (i) their positions highly correspond to neuronal cell bodies; (ii) they distribute over the space surrounding the nuclei; (iii) their sizes are close to the typical size of neuronal cell bodies (≈5 μm in radius); (iv) the motion of particles are not stochastic but highly fit with the model of diffusive movements (R2>0.998); and (v) the diffusion coefficient of the spots agrees with those of the motion of intracellular organelles measured in vitro.4, 7, 21 In addition, the decrease in neuronal IM observed during ischemic stroke (Figure 7C) suggests that the measured IM may correspond to metabolism-related active motions rather than free diffusion of particles in the cytoplasm. If it corresponded to the latter, IM would likely have increased during occlusion, because ischemic stroke generally results in cell swelling and intracellular-free diffusion increases when the cell volume is enlarged.7, 21
Some movements of macromolecules (<20 nm in diameter) in the cytoplasm can result in an effective diffusion coefficient on the order of 1 μm2/second.21 However, such small macromolecules would not significantly contribute to the OCT signal as discussed above (Supplementary Fig. S1). On the other hand, it is known that intracellular organelles larger than 0.1 μm would not exhibit free diffusion as they exceed the mesh size of cytomatrix (e.g., the pores of microtrabecular lattice);21 and thus they consume cellular energy to support their motion. Further, this motion can be described by an effective diffusion coefficient similar to our result.4, 7 Therefore, the active motion of intracellular organelles may dominantly contribute to the measured neuronal IM and its decrease during ischemic stroke. Cellular nuclei also exhibit motions, a part of which can result in an effective diffusion coefficient on the order of 1 μm2/second.29 This motion of nuclei might also contribute to the measured IM but not solely as discussed in Figure 6C. Meanwhile, anomalous diffusions have been observed in in vitro studies using fluorescence correlation spectroscopy;30, 31 however, anomalous diffusions mostly appeared in the movement of macromolecules whose size is too small to contribute to the intrinsic scattering signal of OCT as discussed above (Supplementary Fig. S1). Therefore, anomalous diffusions would not dominate the autocorrelation function in this study. It will be of interest to make a 3D map of the anomality of diffusion by replacing the decay terms in the model with  , where α is the anomality exponent.
Using the present method, we found that both CBF and IM reduced during a brief ischemic stroke, and CBF recovered by the 1 hour of reperfusion but IM did not (Figure 7C). This result suggests that neuronal IM did not recover as quickly as CBF during reperfusion, probably because of a slow recovery of metabolism and/or persistent cell damage. It seems obvious that the decrease in CBF corresponds to those observed in laser Doppler flowmetry, positron emission tomography, and perfusion-weighted magnetic resonance imaging studies of stroke.13, 32, 33, 34, 35, 36 The persistent reduction in neuronal IM might be related with decreases in the cerebral metabolic rate for oxygen and glucose measured by positron emission tomography in stroke patients.33, 34, 35 Also, the reduced IM is of immediate relevance in quantifying the nature of changes in cellular dynamics revealed by diffusion-weighted magnetic resonance imaging in human studies of stroke.36, 37, 38, 39 For instance, our observation of a decrease in IM of organelles is closely related to the decrease in diffusion of metabolites during and immediately after ischemic stroke, as observed by diffusion-weighted magnetic resonance imaging.40, 41 More detailed analysis of neuronal IM variation with ischemic stroke and its relation to tissue infarction using cellular-resolution DLS–OCT imaging will be the subject of subsequent studies.
In conclusion, this paper describes a DLS–OCT-based method that enables label-free in vivo imaging of both CBF and neuronal IM with cellular resolution. DLS–OCT imaging of the cerebral cortex resulted in the velocity map showing CBF and the diffusion map revealing neuronal IM. This cellular-resolution in vivo imaging of neuronal IM is shown for the first time to our knowledge. The method was applied to a study of how CBF and IM varied during ischemic stroke, leading to the observation of a persistent reduction in IM despite the recovery of CBF after reperfusion.
The authors declare no conflict of interest.
Footnotes
Supplementary Information accompanies the paper on the Journal of Cerebral Blood Flow & Metabolism website (http://www.nature.com/jcbfm)
The sources of support: This study was supported by the NIH (R01-NS057476, R01-EB000790, P01NS055104) and the AFOSR (MFEL FA9550-07-1-0101).
Supplementary Material
References
- Herman B, Albertini DF. A time-lapse video image intensification analysis of cytoplasmic organelle movements during endosome translocation. J Cell Biol. 1984;98:565–576. doi: 10.1083/jcb.98.2.565. [DOI] [PMC free article] [PubMed] [Google Scholar]
- Brangwynne CP, Koenderink GH, MacKintosh FC, Weitz DA. Cytoplasmic diffusion: molecular motors mix it up. J Cell Biol. 2008;183:583–587. doi: 10.1083/jcb.200806149. [DOI] [PMC free article] [PubMed] [Google Scholar]
- Sattelle DB, Green DJ, Langley KH. Subcellular motions in Nitella flexilis studied by photon correlation spectroscopy. Phys Scripta. 1979;19:471. [Google Scholar]
- Dzakpasu R, Axelrod D. Dynamic light scattering microscopy. a novel optical technique to image submicroscopic motions. II: experimental applications. Biophys J. 2004;87:1288–1297. doi: 10.1529/biophysj.104.041400. [DOI] [PMC free article] [PubMed] [Google Scholar]
- Joo C, Evans CL, Stepinac T, Hasan T, de Boer JF. Diffusive and directional intracellular dynamics measured by field-based dynamic light scattering. Opt Express. 2010;18:2858–2871. doi: 10.1364/OE.18.002858. [DOI] [PMC free article] [PubMed] [Google Scholar]
- Yamauchi T, Iwai H, Yamashita Y. Label-free imaging of intracellular motility by low-coherent quantitative phase microscopy. Opt Express. 2011;19:5536–5550. doi: 10.1364/OE.19.005536. [DOI] [PubMed] [Google Scholar]
- Nolte DD, An R, Turek J, Jeong K. Holographic tissue dynamics spectroscopy. J Biomed Opt. 2011;16:087004. doi: 10.1117/1.3615970. [DOI] [PubMed] [Google Scholar]
- Clark NA, Lunacek JH, Benedek GB. A study of Brownian motion using light scattering. Am J Phys. 1970;38:575–585. [Google Scholar]
- Durian DJ, Weitz DA, Pine DJ. Multiple light-scattering probes of foam structure and dynamics. Science. 1991;252:686–688. doi: 10.1126/science.252.5006.686. [DOI] [PubMed] [Google Scholar]
- Huang D, Swanson E, Lin C, Schuman J, Stinson W, Chang W, et al. Optical coherence tomography. Science. 1991;254:1178–1181. doi: 10.1126/science.1957169. [DOI] [PMC free article] [PubMed] [Google Scholar]
- Tearney GJ, Brezinski ME, Bouma BE, Boppart SA, Pitris C, Southern JF, et al. In vivo endoscopic optical biopsy with optical coherence tomography. Science. 1997;276:2037–2039. doi: 10.1126/science.276.5321.2037. [DOI] [PubMed] [Google Scholar]
- Stern MD. In vivo evaluation of microcirculation by coherent light scattering. Nature. 1975;254:56–58. doi: 10.1038/254056a0. [DOI] [PubMed] [Google Scholar]
- Dirnagl U, Kaplan B, Jacewicz M, Pulsinelli W. Continuous measurement of cerebral cortical blood flow by laser-Doppler flowmetry in a rat stroke model. J Cereb Blood Flow Metab. 1989;9:589–596. doi: 10.1038/jcbfm.1989.84. [DOI] [PubMed] [Google Scholar]
- Ances BM, Greenberg JH, Detre JA. Laser Doppler imaging of activation-flow coupling in the rat somatosensory cortex. Neuroimage. 1999;10:716–723. doi: 10.1006/nimg.1999.0510. [DOI] [PubMed] [Google Scholar]
- Izatt JA, Kulkarni MD, Yazdanfar S, Barton JK, Welch AJ. In vivo bidirectional color Doppler flow imaging of picoliter blood volumes using optical coherence tomography. Opt Lett. 1997;22:1439–1441. doi: 10.1364/ol.22.001439. [DOI] [PubMed] [Google Scholar]
- Lee J, Srinivasan V, Radhakrishnan H, Boas DA. Motion correction for phase-resolved dynamic optical coherence tomography imaging of rodent cerebral cortex. Opt Express. 2011;19:21258–21270. doi: 10.1364/OE.19.021258. [DOI] [PMC free article] [PubMed] [Google Scholar]
- Srinivasan VJ, Jiang JY, Yaseen MA, Radhakrishnan H, Wu W, Barry S, et al. Rapid volumetric angiography of cortical microvasculature with optical coherence tomography. Opt Lett. 2010;35:43–45. doi: 10.1364/OL.35.000043. [DOI] [PMC free article] [PubMed] [Google Scholar]
- Jonathan E, Enfield J, Leahy MJ. Correlation mapping method for generating microcirculation morphology from optical coherence tomography (OCT) intensity images. J Biophotonics. 2011;4:583–587. doi: 10.1002/jbio.201000103. [DOI] [PubMed] [Google Scholar]
- Lee J, Wu W, Jiang JY, Zhu B, Boas DA. Dynamic light scattering optical coherence tomography. Opt Express. 2012;20:22262–22277. doi: 10.1364/OE.20.022262. [DOI] [PMC free article] [PubMed] [Google Scholar]
- Srinivasan VJ, Radhakrishnan H, Jiang JY, Barry S, Cable AE. Optical coherence microscopy for deep tissue imaging of the cerebral cortex with intrinsic contrast. Opt Express. 2012;20:2220–2239. doi: 10.1364/OE.20.002220. [DOI] [PMC free article] [PubMed] [Google Scholar]
- Jacobson K, Wojcieszyn J. The translational mobility of substances within the cytoplasmic matrix. Proc Natl Acad Sci USA. 1984;81:6747–6751. doi: 10.1073/pnas.81.21.6747. [DOI] [PMC free article] [PubMed] [Google Scholar]
- Pusey PN, Van Megen W. Dynamic light scattering by non-ergodic media. Phys A. 1989;157:705–741. [Google Scholar]
- Joosten JGH, Geladé ETF, Pusey PN. Dynamic light scattering by nonergodic media: Brownian particles trapped in polyacrylamide gels. Phys Rev A. 1990;42:2161–2175. doi: 10.1103/physreva.42.2161. [DOI] [PubMed] [Google Scholar]
- Jayaraman V, Jiang J, Li H, Heim P, Cole G, Potsaid B, et al. OCT imaging up to 760 Khz axial scan rate using single-mode 1310 nm MEMs-tunable VCSELs with 100 nm tuning range CLEO: Appl Technol 2011. PDPB2.
- Brock R, Hink MA, Jovin TM. Fluorescence correlation microscopy of cells in the presence of autofluorescence. Biophys J. 1998;75:2547–2557. doi: 10.1016/S0006-3495(98)77699-4. [DOI] [PMC free article] [PubMed] [Google Scholar]
- Stefanovic B, Hutchinson E, Yakovleva V, Schram V, Russell JT, Belluscio L, et al. Functional reactivity of cerebral capillaries. J Cereb Blood Flow Metab. 2007;28:961–972. doi: 10.1038/sj.jcbfm.9600590. [DOI] [PMC free article] [PubMed] [Google Scholar]
- Schulte ML, Wood JD, Hudetz AG. Cortical electrical stimulation alters erythrocyte perfusion pattern in the cerebral capillary network of the rat. Brain Res. 2003;963:81–92. doi: 10.1016/s0006-8993(02)03848-9. [DOI] [PubMed] [Google Scholar]
- Kleinfeld D, Mitra PP, Helmchen F, Denk W. Fluctuations and stimulus-induced changes in blood flow observed in individual capillaries in layers 2 through 4 of rat neocortex. Proc Natl Acad Sci. 1998;95:15741–15746. doi: 10.1073/pnas.95.26.15741. [DOI] [PMC free article] [PubMed] [Google Scholar]
- Suissa M, Place C, Goillot E, Freyssingeas E. Internal dynamics of a living cell nucleus investigated by dynamic light scattering. Eur Phys J E. 2008;26:435–448. doi: 10.1140/epje/i2007-10346-5. [DOI] [PubMed] [Google Scholar]
- Schwille P, Haupts U, Maiti S, Webb WW. Molecular dynamics in living cells observed by fluorescence correlation spectroscopy with one- and two-photon excitation. Biophys J. 1999;77:2251–2265. doi: 10.1016/S0006-3495(99)77065-7. [DOI] [PMC free article] [PubMed] [Google Scholar]
- Wachsmuth M, Waldeck W, Langowski J. Anomalous diffusion of fluorescent probes inside living cell nuclei investigated by spatially-resolved fluorescence correlation spectroscopy. J Mol Biol. 2000;298:677–689. doi: 10.1006/jmbi.2000.3692. [DOI] [PubMed] [Google Scholar]
- Moseley ME, Cohen Y, Mintorovitch J, Chileuitt L, Shimizu H, Kucharczyk J, et al. Early detection of regional cerebral ischemia in cats: comparison of diffusion- and T2-weighted MRI and spectroscopy. Magn Reson Med. 1990;14:330–346. doi: 10.1002/mrm.1910140218. [DOI] [PubMed] [Google Scholar]
- Lenzi GL, Frackowiak RSJ, Jones T. Cerebral oxygen metabolism and blood flow in human cerebral ischemic infarction. J Cereb Blood Flow Metab. 1982;2:321–335. doi: 10.1038/jcbfm.1982.33. [DOI] [PubMed] [Google Scholar]
- Marchal G, Rioux P, Petit-Tabou MC, Derlon JM, Baron JC, Serrati C, et al. PET imaging of cerebral perfusion and oxygen consumption in acute ischaemic stroke: relation to outcome. Lancet. 1993;341:925–927. doi: 10.1016/0140-6736(93)91214-7. [DOI] [PubMed] [Google Scholar]
- Heiss WD, Huber M, Fink GR, Herholz K, Pietrzyk U, Wagner R, et al. Progressive derangement of periinfarct viable tissue in ischemic stroke. J Cereb Blood Flow Metab. 1992;12:193–203. doi: 10.1038/jcbfm.1992.29. [DOI] [PubMed] [Google Scholar]
- Rordorf G, Koroshetz WJ, Copen WA, Cramer SC, Schaefer PW, Budzik RF, et al. Regional ischemia and ischemic injury in patients with acute middle cerebral artery stroke as defined by early diffusion-weighted and perfusion-weighted MRI. Stroke. 1998;29:939–943. doi: 10.1161/01.str.29.5.939. [DOI] [PubMed] [Google Scholar]
- Le Bihan D. Looking into the functional architecture of the brain with diffusion MRI. Nat Rev Neurosci. 2003;4:469–480. doi: 10.1038/nrn1119. [DOI] [PubMed] [Google Scholar]
- Warach S, Dashe JF, Edelman RR. Clinical outcome in ischemic stroke predicted by early diffusion-weighted and perfusion magnetic resonance imaging: a preliminary analysis. J Cereb Blood Flow Metab. 1996;16:53–59. doi: 10.1097/00004647-199601000-00006. [DOI] [PubMed] [Google Scholar]
- Roberts TPL, Rowley HA. Diffusion weighted magnetic resonance imaging in stroke. Eur J Radiol. 2003;45:185–194. doi: 10.1016/s0720-048x(02)00305-4. [DOI] [PubMed] [Google Scholar]
- Wick M, Nagatomo Y, Prielmeier F, Frahm J. Alteration of intracellular metabolite diffusion in rat brain in vivo during ischemia and reperfusion. Stroke. 1995;26:1930–1934. doi: 10.1161/01.str.26.10.1930. [DOI] [PubMed] [Google Scholar]
- Abe O, Okubo T, Hayashi N, Saito N, Iriguchi N, Shirouzu I, et al. Temporal changes of the apparent diffusion coefficients of water and metabolites in rats with hemispheric infarction: experimental study of transhemispheric diaschisis in the contralateral hemisphere at 7 Tesla. J Cereb Blood Flow Metab. 2000;20:726–735. doi: 10.1097/00004647-200004000-00010. [DOI] [PubMed] [Google Scholar]
- Maurer CR, Qi R, Raghavan V. A linear time algorithm for computing exact euclidean distance transforms of binary images in arbitrary dimensions. IEEE Trans Pattern Anal. 2003;25:265–270. [Google Scholar]
- Sato Y, Nakajima S, Shiraga N, Atsumi H, Yoshida S, Koller T, et al. Three-dimensional multi-scale line filter for segmentation and visualization of curvilinear structures in medical images. Med Image Anal. 1998;2:143–168. doi: 10.1016/s1361-8415(98)80009-1. [DOI] [PubMed] [Google Scholar]
Associated Data
This section collects any data citations, data availability statements, or supplementary materials included in this article.