

Abstract
Black tea consumption has been shown to improve peripheral vascular function. Its effect on brain vasculature is unknown, though tea contains small amounts of caffeine, a psychoactive substance known to influence cerebral blood flow (CBF). We investigated the effects on CBF due to the intake of tea components in 20 healthy men in a double-blinded, randomized, placebo-controlled study. On separate days, subjects received a single dose of 184 mg caffeine (equivalent to one strong espresso coffee), 2,820 mg black tea solids containing 184 mg caffeine (equivalent to 6 cups of tea), 2,820 mg decaffeinated black tea solids, or placebo. The CBF and cerebrovascular reactivity (CVR) to hypercapnia were measured with arterial spin labeled magnetic resonance imaging (MRI) before and 2 hours after administration. We found a significant global reduction with caffeine (20%) and tea (21%) in gray matter CBF, with no effect of decaffeinated tea, suggesting that only caffeine influences CBF acutely. Voxelwise analysis revealed the effect of caffeine to be regionally specific. None of the interventions had an effect on CVR. Additional research is required to conclude on the physiologic relevance of these findings and the chronic effects of caffeine and tea intake on CBF.
Keywords: arterial spin labeling, brain, caffeine, flavonoids, regional cerebral blood flow, tea
Introduction
Tea produced from Camellia sinensis has been consumed for thousands of years and is one of the most popular beverages around the world. Epidemiologic studies have shown strong associations between the long-term consumption of tea and a reduced risk of stroke and cognitive decline.1, 2
These associations may be explained by the fact that tea and the flavonoid compounds found in tea have beneficial effects on endothelial function, a powerful predictor of cardiovascular disease risk.3 Flow mediated dilation of the brachial artery is a measure of endothelial function and several intervention studies have shown beneficial effects of tea and other flavonoid-rich foods therein.4, 5 Small doses of flavonoids, equivalent to one cup of tea, already exert a substantial increase in flow mediated dilation.6 A proposed mechanism is that flavonoids improve the bioavailability of nitric oxide (NO), a key mediator of endothelium-dependent vasodilation, by stimulating activity of endothelial NO synthase or by preventing superoxide-mediated NO breakdown. It has been shown, in vitro, that tea and tea flavonoids (theaflavins as well as a fraction of black tea thearubigins) increase the endothelial NO synthase activity by phosphorylation of the enzyme.7
Nitric oxide also plays an important role in the chemoregulation of cerebral blood flow (CBF). Changes in the arterial partial pressure of CO2 (pCO2) lead to vasodilation and increased CBF via an NO-dependent mechanism. In humans, these pCO2 changes can be induced through mild hypercapnia, i.e., an increase in the level of inhaled CO2. Cerebrovascular responsiveness to hypercapnia has been utilized with noninvasive imaging modalities such as transcranial Doppler sonography8 and magnetic resonance imaging (MRI)9 and is reduced in disease states predisposing to increased risk of stroke and cognitive decline.
Compared with the effects of tea and flavonoids on peripheral vascular function, little is known about possible effects on the vasculature of the brain. Sorond et al.10 did demonstrate that consumption of cocoa, another rich source of flavonoids, increased the cerebrovascular responsiveness to CO2 but further research is warranted. We hypothesize that tea consumption may enhance the CBF response to hypercapnia by affecting NO bioavailability.
The MRI technique of arterial spin labeling (ASL) allows the detection and quantification of CBF and the blood oxygenation level-dependent (BOLD) signal in the human brain. The ASL can be used to continuously monitor CBF and BOLD during the administration of a hypercapnic gas mixture, hence measuring changes in CBF and BOLD linked to changes in end-tidal CO2 (ETCO2) levels (cerebrovascular reactivity or CVR). The BOLD signal is complex, depending on changes in CBF, cerebral blood volume, and oxygen metabolism, and is therefore not as easy to interpret as CBF measurements. However, the BOLD signal has higher contrast-to-noise ratio than the ASL-derived CBF signal, and hence may be more sensitive to a hypercapnic-driven change in CBF.
In addition to flavonoids, tea contains low amounts of caffeine (20 to 30 mg per serving size).11 Caffeine is a potent methylxanthine, which stimulates sympathetic nervous activity and increases vascular tone.12 The vasoconstrictive properties of acutely administered caffeine lead to an overall global reduction in CBF as has been shown using MRI techniques.13 To date, there have been limited studies determining precisely how caffeine interacts with cortical perfusion on a regional level. Regulation of CBF is a complex matter. It is composed of contributions from both endothelial and neuronal mechanisms that serve to address metabolic requirements and the autoregulation of cerebral pressure. Caffeine functions as an adenosine antagonist.14 Previous work has shown that topical application of adenosine led to glutamate-mediated vasodilation of the pial artery in the rat brain.15 An adenosine antagonist applied to the A2a led to significant inhibition of pial artery dilation response to glutamate, with an antagonist on the A1 receptor not producing any effect. This evidence strongly suggests neuronally mediated cerebrovascular control via the A2a adenosine receptor.15
Currently, there is a gap in the knowledge regarding the effects of tea and its components other than caffeine on CBF. It is important to build on flow mediated dilation data, as well as the cognitive and clinical work that purports the beneficial effects of the constituents of tea on the vascular system. In this work, we present results of a double-blinded, randomized, placebo-controlled study on a healthy cohort determining separately the effects of tea, and the caffeine present in tea, on regional CBF and CVR using MRI. We include tight control of dietary intake of caffeine and tea, based on previous work that suggests a long-term effect of previous caffeine consumption.13 We hypothesize that caffeine will reduce CBF in a regionally specific manner, according to the distribution of adenosine receptors, but that it will have no effect on CVR. We predict however that tea components other than caffeine, specifically flavonoids, will increase both baseline CBF and CVR. The novelty of this study is the determination of the regional effects of tea components on CBF and CVR. This study is unique in its aim to probe whole brain and regional vascular responses after consumption of black tea and caffeine.
Materials and methods
Approval for this study was obtained from the University of Liverpool Ethics Committee and all volunteers provided signed informed consent before their participation. Twenty healthy male subjects (mean age: 24.2±4 years, mean body mass index: 23.8±3.1 kg/m2) were recruited for this study. Participants first attended a screening visit to ensure compliance with the inclusion/exclusion criteria, in addition to spirometry measures to ensure that lung function was within the normal healthy range. Subjects had to be caffeine consumers (regular consumption of between 1 and 5 caffeinated beverages per day), in good general mental and physical health, with no history of any neurologic or cardiovascular disease. Potential volunteers were excluded if they smoked, consumed >21 units of alcohol per week, exercised in excess of 10 hours/week, were on a medically prescribed or slimming diet, had a body mass index of ⩽19 and ⩾30 kg/m2.
Study Design
The study was a double-blinded, placebo-controlled randomized full crossover design with four treatments: (1) caffeine intervention (184 mg of caffeine) (2) tea intervention (2,820 mg of black tea solids, 32% polyphenols, containing 184 mg of caffeine) (3) decaffeinated black tea (2,820 mg of black tea solids, 28% polyphenols) and (4) placebo (microcrystalline cellulose).
Each treatment was administered on a separate day therefore subjects were required to make four separate visits to the test site. Each treatment was delivered in six capsules that were consumed in a single sitting. The ingestion of 2,820 mg tea solids is based on the upper intake limit of tea studies looking at vascular effects5 and was chosen to maximize our chance of seeing an effect of tea on the brain.
The four visits were separated by a minimum period of 1 week to allow for effective washout of the test products from the subjects' system. Order of administration of interventions was randomized for each subjects' visit using a Williams design.16
Diet restrictions were in place for all subjects during the course of the study. Subjects were requested to curtail their tea/coffee consumption to only 2 cups/day and to avoid red wine and dark chocolate during the study. Subjects were requested to stick to these diet restrictions for 1 week before their visit days. During the 12-hour period before their visit day, subjects were instructed to completely refrain from alcohol, caffeinated drinks, tea, and medication.
Subjects arrived at the test site in the morning in a fasted state and were given a standard cereal bar (consisting of sugar, oats, honey and nuts without any dairy or polyphenols) before the first scan session. After the scan session, subjects were given the six capsules containing a treatment. They were then scanned again 1.5 hours after the capsules were consumed (when tea catechins reach peak plasma level17 and when caffeine plasma level is also high18), with the same scan protocol. In total, each subject had eight scan sessions, two sessions per treatment.
Magnetic Resonance Imaging Acquisition
The MRI measurements were performed using a 3-tesla Trio whole-body scanner (Siemens, Erlangen, Germany). An 8-channel RF coil was used for signal collection and the body coil for signal transmission. The ASL images were acquired using a PICORE tagging scheme with 10 cm tag width, and a 10-mm tag-slice gap with the QUIPSSII modification.19 There were two acquisitions, the first one to collect high quality CBF maps at rest, and the second during a hypercapnia intervention during which simultaneous BOLD and CBF maps were continuously acquired.
For the resting CBF scan, acquisition parameters were repetition time (TR) 2 seconds, inversion time (TI1) 0.7 seconds, TI2 1.4 seconds, echo time (TE) 19 ms, 8 slices of 5 mm thickness and 1 mm gap. In-plane resolution was 3.5 × 3.5 mm. Seventy-five pairs of label and control images were collected, giving a scan acquisition time of 5 minutes. This was repeated for the inferior and superior slice positioning, giving overall whole brain coverage in 10 minutes. Crusher gradients with b=5 mm/s were used to remove signal from the larger vessels.
For the hypercapnia challenge, acquisition parameters were altered slightly to give improved BOLD contrast. The TE was increased to 25 ms, giving a TR of 2.13 seconds, there were 112 label and control pairs, giving an acquisition time of 8 minutes. Twelve slices of 3.5 mm thickness and 0.35 mm gap were collected covering the inferior half of the brain. The pulse sequence included prospective motion correction (PACE20). Two ‘dummy' scans were discarded at the start of each functional run to avoid T1 relaxation effects.
At the end of each ASL sequence, an M0 calibration image was also collected for use in producing quantitative CBF maps (see Analysis section). For this, the ASL sequence with parameters as above was used with the labeling switched off and a TR of 10 seconds.
A structural image was collected using a 3D MPRAGE21 sequence with 1 mm isotropic resolution.
Hypercapnic Intervention
A non rebreathing circuit22 was used to induce hypercapnia in subjects while in the scanner. Hypercapnia was induced 3 minutes into the ASL sequence and was maintained for 5 minutes until the end of the sequence. The gas mixture consisted of a 21% O2 balanced with 79% CO2 delivered from the control room into the scanner. A silicone mouthpiece was connected to an antibacterial filter, which was connected to a 2-way valve. The 2-way valve was connected to a wide corrugated open ended plastic tube which allowed room air to flow in. A thin medical air supply tube connected directly to the gas tank was attached within the corrugated tube, allowing a thin stream of the CO2-rich air to mix with the normal room air. This allowed for the CO2 mixture to gently mix with the room air thus enabling an increase in subjects' CO2 end-tidal levels, which were continuously monitored. The ETCO2 levels were sampled using a thin silicon sample tube attached to the mouth piece. In most cases, subjects were not aware of the CO2 entering their system, and pulse rates were observed to remain stable during the increased CO2.
End-tidal values were monitored using Powerlab (ADI Instruments, Colorado Springs, CO, USA) to ensure all subjects reached an increased end-tidal level ∼1% above their baseline CO2 values. End-tidal levels were controlled using a flowmeter connected directly to the gas tank. Flow rates for the CO2 mixture were set on the first scan session to the level at which an increase of 1% in CO2 end-tidal values was observed. This subject-specific flowmeter value was maintained for all scan sessions in the study. Pulse rate and oxygen saturation were continuously monitored.
Data Analysis
Resting Cerebral Blood Flow
Resting ASL data were analyzed using MATLAB and SPM8 (www.fil.ion.ucl.ac.uk/spm). The perfusion-weighted images were converted into quantitative CBF maps through the use of a model that assumes a single blood compartment model, i.e., assuming that the labeled water does not cross the capillary wall or leave the voxel during the TI.23 The equilibrium magnetization of arterial blood was estimated from the average signal of the M0 calibration image, assuming a whole-brain value of 0.9 for the brain:blood partition coefficient (λ).24 Correcting for the different T2* relaxation times of blood and tissue, perfusion maps were produced using equation 1:
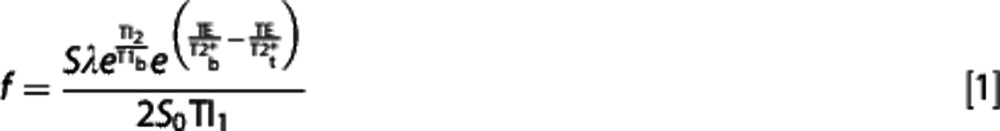 |
where f is perfusion, S is the signal in the difference image, T1b=1.6 seconds is the T1 of blood,25 T2b*=100 ms, and T2t*=50 ms are the approximate T2* of fully saturated arterial blood and tissue, respectively, and S0 is the whole-brain equilibrium tissue magnetization.
The T1-weighted image was normalized to the Montreal Neurological Institute template within SPM and the same transformation was applied to the coregistered CBF images. Gray matter was segmented on the normalized T1-weighted image on an individual basis and CBF values from gray matter were extracted.
Hypercapnia-Driven Responses
Hypercapnia ASL data were processed using in-house MATLAB routines to separate the BOLD and CBF data components: Pairwise label and control images were added to give a temporal series of BOLD images and subtracted and converted into CBF images as described above to give a temporal series of CBF images. Both BOLD and CBF data were then analyzed using Brainvoyager (Brainvoyager QX, Brain Innovation, Maastricht, the Netherlands). Preprocessing consisted of motion correction using a six parameter estimation incorporating three translation and rotation parameters. Spatial smoothing was performed using a 6-mm Gaussian kernel. Temporal smoothing was applied to CBF data with a full width at half maximum of 30 seconds to help reduce temporal noise in the CBF time course. A gray-matter region was defined for each subject by segmenting the T1-weighted image within BrainVoyager. To allow direct comparison of the perfusion changes with brain anatomy, the BOLD and CBF images were coregistered to the T1-weighted image and mean BOLD and CBF time courses were extracted from all voxels within the gray-matter mask.
These time courses were then exported and used to calculate CVR. Percentage BOLD and CBF changes were calculated from the final 3-minute period of hypercapnia relative to the 3 minute baseline period. The ETCO2 values were extracted from the gas traces and converted into units of mm Hg using atmospheric pressure readings from Liverpool University vicinity on the day of the scan. Change in ETCO2 (in units of mm Hg) was calculated from the 3-minute period of hypercapnia relative to the 3-minute baseline period. The CVR was calculated according to equation 2:
 |
Statistical Analysis
Statistical tests were all performed on all three outcome measures (resting CBF, CVRCBF, and CVRBOLD) in gray matter using the MATLAB statistical toolbox. ANOVA was performed on the ‘after intervention' data with ‘subject', ‘intervention type', and the ‘data before intervention' as factors. Age, height, weight, and body mass index were included as covariates in the model. None of the covariates explained any of the variance in the data and so were subsequently removed. Pairwise comparisons were performed and the least squares mean difference between each intervention type was recorded, along with 95% confidence interval.
In addition, for the resting CBF maps, voxelwise analysis was performed to determine regional effects of caffeine and flavonoids using the PET toolbox in SPM8 (www.fil.ion.ucl.ac.uk/spm). A factorial ANOVA design was used, considering the effects of time and intervention. The main effect of caffeine was determined using the contrast of (caffeine−placebo)+(tea−decaff) for the ‘postintervention' CBF images. The main effect of flavonoids was determined using the contrast of (decaff−placebo)+(tea−caffeine) for the ‘postintervention' CBF images. Finally, any interaction between caffeine and flavonoids was determined by considering the contrast ((caffeine−placebo)−(tea−decaff)). For all contrasts, the effects in both directions (i.e., increases or decreases in CBF) were considered. In each voxel, differences in CBF signal between conditions were considered to be significant if P<0.05, corrected for the multiple statistical comparisons across all voxels using Familywise error as implemented in SPM. The minimum cluster size was set to 10 to avoid spurious signal change in isolated voxels. Regions showing significant differences were identified by overlaying onto the anatomical automatic labeling atlas.26
Results
Resting Cerebral Blood Flow
Mean preintervention (baseline) gray matter resting CBF levels for all four scan days across subjects remained relatively unchanged (mean CBF: 37.6±4.8 mL/100 mL per minute). Figure 1 shows the relative changes in resting CBF levels at baseline and after the different interventions. Caffeine significantly reduced gray matter resting CBF by 20% compared with placebo. Tea also produced significant reduction in CBF of 21%. Decaffeinated tea had no significant effect on resting CBF. Finally, there was no significant difference in resting CBF between tea and caffeine, indicating that caffeine was solely responsible for the observed reduction in CBF caused by tea (Table 1).
Figure 1.

Mean resting cerebral blood flow (CBF) for each of the four interventions from global gray matter. Gray bars represent CBF levels before the intervention (i.e., baseline measures) and dark bars CBF levels after the intervention. Standard error bars are also shown for each condition.
Table 1. ANOVA results of the three main outcome measures (resting CBF, CVRCBF, and CVRBOLD in gray matter) after each intervention.
| Comparisons | Resting CBF mL/100 mL per min Difference (95% CI) | CVRCBF%change/mm Hg Difference (95% CI) | CVRBOLD% change/mm Hg Difference (95% CI) |
|---|---|---|---|
| Tea−Placebo | −8.10 (−10.18, −6.03)* | −0.10 (−3.55, 3.36) | −0.04 (−0.14, 0.05) |
| Caffeine−Placebo | −7.52 (−9.62, −5.42)* | −2.12 (−5.67, 1.42) | −0.04 (−0.14, 0.06) |
| Decaff tea−Placebo | −1.58 (−3.71, 0.54) | −1.69 (−5.14, 1.75) | 0.04 (−0.06, 0.14) |
| Tea−Decaff tea | −6.52 (−8.63, −4.41)* | 1.60 (−1.86, 5.06) | −0.08 (−0.18, 0.02) |
| Caffeine−Decaff tea | −5.93 (−8.06, −3.82)* | −0.43 (−4.03, 3.17) | −0.08 (−0.17, 0.02) |
| Tea−Caffeine | −0.58 (−2.62, 1.45) | 2.03 (−1.32, 5.38) | −0.003 (−0.10, 0.09) |
ANOVA, analysis of variance; BOLD, blood-oxygenation-level-dependent; CBF, cerebral blood flow; CI, confidence interval; CVR, cerebrovascular reactivity.
Least squares mean differences are reported for each comparison along with the 95% confidence interval on these differences. Results where the differences are significantly (P<0.05) nonzero are highlighted with *.
Regional differences in CBF were observed using voxel-based analysis performed in SPM. The main effect of caffeine was reduced CBF in regions encompassing subcortical gray matter (thalamus, basal ganglia, hippocampus, and posterior cingulum) and isolated frontal, parietal, and occipital regions (Figure 2; Table 2). There were no regions of significantly increased CBF due to caffeine. There were no significant effects of flavonoids on CBF, nor any interaction between caffeine and flavonoids. These regional differences survived statistical thresholding, while unthresholded t-score maps of the response to caffeine showed widespread reduction in CBF.
Figure 2.

Regions showing significant (P<0.05 corrected for family wise error) reduction in cerebral blood flow (CBF) due to administration of caffeine (i.e., a contrast considering (caffeine−placebo)+(tea−decaff)). The figure shows t-scores as indicated on the color bar. Only slices showing changes in CBF are shown in the figure.
Table 2. Regions of significant (P<0.05, corrected for family wise error) reduction in CBF due to the administration of caffeine (i.e., a contrast considering (caffeine−placebo)+(tea−decaff)).
| Region | Number of voxels in cluster | P value (family wise error-corrected) for cluster | MNI coordinates of peak voxels in cluster (x, y, z) |
|---|---|---|---|
| Bilateral caudate, putamen, pallidus, and thalamus extending into hippocampus, posterior cingulum, and precuneus | 8,141 | 0.0001 | −26, −18, 4 −10, −24, 6 −6, −14, 2 |
| Left middle frontal, inferior frontal gyri | 509 | 0.00006 | −42, 42, −2 |
| Left middle temporal, middle occipital gyri | 263 | 0.0007 | −46, −68, 8 |
| Right middle occipital gyrus | 135 | 0.003 | 44, −76, 4 |
| Left superior parietal lobe | 94 | 0.006 | −14, −72, 56 |
| Right middle frontal and inferior frontal gyri | 241 | 0.0009 | 46, 42, −2 |
| Right superior temporal gyrus | 12 | 0.03 | 52, −20, 2 |
| Right superior parietal lobe | 30 | 0.02 | 26,−56, 60 |
| Right cuneus | 19 | 0.02 | 28, −82, 32 |
CBF, cerebral blood flow; MNI, Montreal Neurological Institute.
Regions showing significant differences (Figure 2) were identified by overlay onto the anatomical automatic labeling atlas. Only regions with at least 10 contiguously ‘active' voxels are shown.
Hypercapnia-Driven Responses
Baseline CBF and BOLD measures across all subjects showed a strong response to hypercapnia, with an increase in gray-matter CBF of 18% averaged across all subjects and sessions, and a BOLD signal increase of 2.3%. Average changes in ETCO2 of 7.9 mm Hg resulted in mean baseline CVR measurements of 3.6%/mm Hg (CVRCBF) and 0.45%/mm Hg (CVRBOLD). Hypercapnia was well tolerated and pulse rate was unaffected (average pulse rate across all subjects: 63.9±8.6 b.p.m. before hypercapnia, 63.9±9.0 b.p.m. during hypercapnia). However, no significant effect of any of the interventions was seen on the CVRCBF or CVRBOLD measures (Table 1). Reproducibility of the CVR measures between visits was calculated for all subjects. This was done using the preintervention scans for each subject across the four different visits. When looking at the 95% confidence interval for these measures as a percentage of the mean measures, it was observed that the baseline CBF measure had the best reproducibility at 14%, in contrast to the CVRCBF and CVRBOLD measures which was 101% and 41%, respectively.
Discussion
This study used advanced magnetic resonance techniques to measure changes in CBF possibly linked to caffeine and other tea components. Baseline CBF measures and a hypercapnic-driven CBF and BOLD response were the key means of probing the cerebrovascular system, and establishing any influence of tea (components). The hypercapnia intervention was introduced in the paradigm as a means of increasing the sensitivity of detecting possible changes in blood flow linked to the influence of tea on the endothelial NO system. A novel finding of this study was the observation of regional-specific CBF changes in response to caffeine intake.
Resting Cerebral Blood Flow
Resting CBF is reduced after both caffeine and tea interventions (Table 1; Figure 1). These reductions are found to be regionally specific (Figure 2). The similarity of the results between tea and caffeine, and the lack of any change in CBF after decaffeinated tea (Table 1; Figure 1), suggest that these changes are primarily due to the presence of caffeine. Indeed, the voxel-based analysis showed no main effect of flavonoids and no interaction between flavonoids and caffeine (Table 2; Figure 2), confirming that the global changes are entirely due to the presence of caffeine in tea. Caffeine shows a widespread reduction in CBF, that is exaggerated in key regions (Figure 2; Table 2). A reduction in CBF due to caffeine is well documented in past magnetic resonance and positron emission tomography studies,27, 28 however, to our knowledge the regional specificity of these changes has not previously been reported. The CBF was reduced in widespread regions spanning primarily subcortical gray matter (thalamus, basal ganglia, hippocampus, and posterior cingulum) and isolated frontal, parietal, and occipital regions. Previous studies that have focused on the effects of caffeine on CBF have primarily used it in conjunction with a clinical cohort29 or with a sensory stimulus30 as part of the paradigm. It is thus difficult, from these preexisting studies, to ascertain direct effects of caffeine on the normal baseline neurophysiology. In the present study, we aimed to reduce as many confounds as possible through a strictly controlled design as far as dietary constraints and potential confounds such as body mass index are concerned.
The observation of region-specific reductions in CBF after caffeine is very interesting as they provide information on the mechanism of action. We see both a general reduction in whole brain CBF and isolated bilateral regions showing a much larger response (Figure 2). This suggests there may be a global vascular mechanism (driving the global change) as well as a regionally specific neuronal mechanism. These regional reductions in CBF due to caffeine may be due to its action as an adenosine antagonist. A study applying an adenosine A2a antagonist in patients with Parkinson's disease31 has revealed areas of similar CBF change, with the thalamus showing the most significant change. Additional support for this argument can be found in a study32 that used positron emission tomography imaging in conjunction with an adenosine-sensitive tracer to identify the locations of adenosine A2a receptors. Regions found in this and other studies33 are similar to regions showing reduced CBF after caffeine administration (Figure 2; Table 2).
It is difficult to be certain whether the regionally specific changes in CBF are directly attributed to neuronal influence or are acting on the vascular adenosine pathways based purely on measures using MRI. The bilateral nature of the regional changes observed and the similarities in activation patterns to studies using adenosine antagonists are suggestive that the A2a receptor which is neuronally implicated is involved. Adenosine has a role in neuronal inhibition as well as in modulating the excitatory neurotransmitter glutamate.34 Considering the link between glutamate and the A2a receptor that has been established in animal model studies discussed earlier and the evidence that caffeine interacts more heavily on the A2a receptor it is likely that the neuronal receptors are playing a role in these changes. It would be useful in future studies to address this point more directly with tools sensitive to neuronal function such as magnetoencephalography. The role of caffeine on mental states has been established in past studies,35 which show that caffeine can be linked to anxiety, addiction, and excitement.
The decaffeinated intervention showed no significant CBF change on comparison with placebo (Table 1; Figure 1). Neither were there any significant changes in CBF due to the administration of flavonoids or any interaction between flavonoids and caffeine. However, it cannot be definitively concluded that components found in black tea are not able to affect brain physiology. It is possible that the decaffeination process could contribute to changes in other compounds found in tea, so altering their action, or that the changes in CBF were too small to be detected in our study. The size and presence of effects might also be dependent on the (vascular) health status of the study population. Also, data on chronic tea intervention are lacking. Finally, the participants in this study were all regular tea drinkers which may have blunted any acute effect of tea beyond the caffeine response.
Hypercapnia-Driven Responses
The use of a hypercapnia intervention was chosen to mimic a condition of increased demand of blood flow in the brain, partly mediated via the vasodilatory effects of NO. We found an increase in CBF and BOLD due to increased CO2 inhalation, in agreement with other studies.36 The CVR calculations enable alterations in ETCO2 to be accounted for in the BOLD and CBF responses. The CVR measures were not altered after any of the interventions, indicating no effect of caffeine or other tea compounds. This is in agreement with a previous study showing no change in CVR due to caffeine.27 While we show that caffeine and tea significantly reduce baseline CBF, CVR is not affected, suggesting that the two mechanisms of blood flow response (i.e., to hypercapnia and caffeine) do not interact.
We hypothesized that tea would increase the hypercapnia-driven CBF response. We do not find evidence for this, but there are a number of limitations in our study: (1) the reproducibility of the CVR responses was found to be quite poor, limiting the change in CVR that we could have been sensitive to (2) hypercapnia could potentially have caused a change in CBF to a maximal physiologic level, such that any further effects imposed by the presence of flavonoids would have been seen. This seems unlikely however as we used moderate levels of hypercapnia, which would not have saturated the CBF response.37
It is difficult to conclude if the observed reduction in CBF has positive or negative physiological consequences, and the relevance of these acute effects for habitual tea drinking remains to be revealed. It is important to bear in mind that the tested single dose was equivalent to ∼6 cups of ‘normal' tea. The much lower dose of caffeine consumed per cup of tea will most likely show much less dramatic changes in CBF.
Clearly, the tea components other than caffeine, such as the flavonoids, appear to neither affect CBF nor counteract the caffeine-induced CBF changes. The recent finding that one strong cup of espresso may easily contain the amount of caffeine tested in this study38 does, however, raise questions about the physiologic and cognitive impact of the observed CBF decline. Tea is associated with reductions in the risk of stroke,1 whereas the evidence for coffee/caffeine is more ambiguous.39 This could imply that the reduction in stroke risk seen with tea is not explained by effects on CBF but rather by effects on other risk factors such as blood pressure.40
In conclusion, while we find strong, regionally specific reductions in CBF after caffeine administration, we do not find evidence for any effect of flavonoids on CBF or CVR. It would be interesting in future work to determine the link between regional CBF changes and neuronal function and its impact on cerebral health.
Acknowledgments
The authors would like to thank Bill Bimson for his help with running the scans and Yvonne Zebregs for her help and advice with practical aspects of the study.
AG & RD are employed by Unilever R&D Vlaardingen. Unilever produces foods of which some are marketed to fit in a healthy diet and lifestyle.
Footnotes
This study was funded by Unilever R&D Vlaardingen.
References
- Arab L, Liu W, Elashoff D. Green and black tea consumption and risk of stroke: a meta-analysis. Stroke. 2009;40:1786–1792. doi: 10.1161/STROKEAHA.108.538470. [DOI] [PubMed] [Google Scholar]
- Feng L, Li J, Ng TP, Lee TS, Kua EH, Zeng Y. Tea drinking and cognitive function in oldest-old chinese. J Nutr Health Aging. 2012;16:754–758. doi: 10.1007/s12603-012-0077-1. [DOI] [PMC free article] [PubMed] [Google Scholar]
- Ras RT, Streppel MT, Draijer R, Zock PL. Flow-mediated dilation and cardiovascular risk prediction: a systematic review with meta-analysis. Int J Cardiol. 2012;S0167-5273:01153–01159. doi: 10.1016/j.ijcard.2012.09.047. [DOI] [PubMed] [Google Scholar]
- Kay CD, Hooper L, Kroon PA, Rimm EB, Cassidy A. Relative impact of flavonoid composition, dose and structure on vascular function: a systematic review of randomised controlled trials of flavonoid-rich food products. Mol Nutr Food Res. 2012;56:1605–1616. doi: 10.1002/mnfr.201200363. [DOI] [PubMed] [Google Scholar]
- Ras RT, Zock PL, Draijer R. Tea consumption enhances endothelial-dependent vasodilation; a meta-analysis. PLoS One. 2011;6:e16974. doi: 10.1371/journal.pone.0016974. [DOI] [PMC free article] [PubMed] [Google Scholar]
- Grassi D, Desideri G, Ferri C. Blood pressure and cardiovascular risk: What about cocoa and chocolate. Arch Biochem Biophys. 2010;501:112–115. doi: 10.1016/j.abb.2010.05.020. [DOI] [PubMed] [Google Scholar]
- Lorenz M, Urban J, Engelhardt U, Baumann G, Stangl K, Stangl V. Green and black tea are equally potent stimuli of NO production and vasodilation: new insights into tea ingredients involved. Basic Res Cardiol. 2009;104:100–110. doi: 10.1007/s00395-008-0759-3. [DOI] [PubMed] [Google Scholar]
- Groeschel K, Terborg C, Schnaudigel S, Ringer T, Riecker A, Witte OW, et al. Effects of physiological aging and cerebrovascular risk factors on the hemodynamic response to brain activation: a functional transcranial Doppler study. Eur J Neurol. 2007;14:125–131. doi: 10.1111/j.1468-1331.2006.01563.x. [DOI] [PubMed] [Google Scholar]
- Hajjar I, Zhao P, Alsop D, Novak V. Hypertension and cerebral vasoreactivity a continuous arterial spin labeling magnetic resonance imaging study. Hypertension. 2010;56:859–U268. doi: 10.1161/HYPERTENSIONAHA.110.160002. [DOI] [PMC free article] [PubMed] [Google Scholar]
- Sorond FA, Lipsitz LA, Hollenberg NK, Fisher NDL Cerebral blood flow response to flavanol-rich cocoa in healthy elderly humans. Neuropsychiatr Dis Treat. 2008;4:433–440. [PMC free article] [PubMed] [Google Scholar]
- Barone JJ, Roberts HR. Caffeine consumption. Food Chem Toxicol. 1996;34:119–129. doi: 10.1016/0278-6915(95)00093-3. [DOI] [PubMed] [Google Scholar]
- Riksen NP, Smits P, Rongen GA. The cardiovascular effects of methylxanthines. Handb Exp Pharmacol. 2011;200:413–437. doi: 10.1007/978-3-642-13443-2_16. [DOI] [PubMed] [Google Scholar]
- Addicott MA, Yang LL, Peiffer AM, Burnett LR, Burdette JH, Chen MY, et al. The effect of daily caffeine use on cerebral blood flow: how much caffeine can we tolerate. Hum Brain Mapp. 2009;30:3102–3114. doi: 10.1002/hbm.20732. [DOI] [PMC free article] [PubMed] [Google Scholar]
- Biaggioni I, Paul S, Puckett A, Arzubiaga C. Caffeine and theophylline as adeonsine receptor antagonists in humans. J Pharmacol Exp Ther. 1991;258:588–593. [PubMed] [Google Scholar]
- Iliff JJ, D'Ambrosio R, Ngai AC, Winn HR. Adenosine receptors mediate glutamate-evoked arteriolar dilation in the rat cerebral cortex. Am J Physiol -Heart Circ Physiol. 2003;284:H1631–H1637. doi: 10.1152/ajpheart.00909.2002. [DOI] [PubMed] [Google Scholar]
- Williams EJ. Experimental designs balanced for the estimation of residual effects of treatments. Austr J Sci Res Series A Phys Sci. 1949;2:149–168. [Google Scholar]
- Lee MJ, Maliakal P, Chen LS, Meng XF, Bondoc FY, Prabhu S, et al. Pharmacokinetics of tea catechins after ingestion of green tea and (-)-epigallocatechin-3-gallate by humans: formation of different metabolites and individual variability. Cancer Epidemiol Biomarkers Prev. 2002;11:1025–1032. [PubMed] [Google Scholar]
- Lelo A, Birkett DJ, Robson RA, Miners JO. Comparative pharmacokinetics of caffeine and its primary demethylated metabolites paraxanthine, theobromine and theophylline in man. Br J Clin Pharmacol. 1986;22:177–182. doi: 10.1111/j.1365-2125.1986.tb05246.x. [DOI] [PMC free article] [PubMed] [Google Scholar]
- Wong EC, Buxton RB, Frank LR. Quantitative imaging of perfusion using a single subtraction (QUIPSS and QUIPSS II) Magn Reson Med. 1998;39:702–708. doi: 10.1002/mrm.1910390506. [DOI] [PubMed] [Google Scholar]
- Thesen S, Heid O, Mueller E, Schad LR. Prospective acquisition correction for head motion with image-based tracking for real-time fMRI. Magn Reson Med. 2000;44:457–463. doi: 10.1002/1522-2594(200009)44:3<457::aid-mrm17>3.0.co;2-r. [DOI] [PubMed] [Google Scholar]
- Mugler JP, Brookeman JR. 3-Dimensional magnetization-prepared rapid gradient-echo imaging (3DMP-RAGE) Magn Reson Med. 1990;15:152–157. doi: 10.1002/mrm.1910150117. [DOI] [PubMed] [Google Scholar]
- Fenn WO, Craig AB. Effect of CO2 on respiration using a new method of administering CO2. J Appl Physiol. 1963;18:1023–1024. doi: 10.1152/jappl.1963.18.5.1023. [DOI] [PubMed] [Google Scholar]
- Parkes LM, Tofts PS. Improved accuracy of human cerebral blood perfusion measurements using arterial spin labeling: accounting for capillary water permeability. Magn Reson Med. 2002;48:27–41. doi: 10.1002/mrm.10180. [DOI] [PubMed] [Google Scholar]
- Roberts DA, Rizi R, Lenkinski RE, Leigh JS. Magnetic resonance imaging of the Brain:Blood partition coefficient for water: application to spin-tagging measurement of perfusion. J Magn Reson Imaging. 1996;6:363–366. doi: 10.1002/jmri.1880060217. [DOI] [PubMed] [Google Scholar]
- Lu HZ, Clingman C, Golay X, van Zijl PCM. Determining the longitudinal relaxation time (T-1) of blood at 3.0 tesla. Magn Reson Med. 2004;52:679–682. doi: 10.1002/mrm.20178. [DOI] [PubMed] [Google Scholar]
- Tzourio-Mazoyer N, Landeau B, Papathanassiou D, Crivello F, Etard O, Delcroix N, et al. Automated anatomical labeling of activations in SPM using a macroscopic anatomical parcellation of the MNI MRI single-subject brain. Neuroimage. 2002;15:273–289. doi: 10.1006/nimg.2001.0978. [DOI] [PubMed] [Google Scholar]
- Chen YF, Parrish TB. Caffeine's effects on cerebrovascular reactivity and coupling between cerebral blood flow and oxygen metabolism. Neuroimage. 2009;44:647–652. doi: 10.1016/j.neuroimage.2008.09.057. [DOI] [PMC free article] [PubMed] [Google Scholar]
- Cameron OG, Modell JG, Hariharan M. Caffeine and human cerebral blood flow - a positron emission tomography study. Life Sci. 1990;47:1141–1146. doi: 10.1016/0024-3205(90)90174-p. [DOI] [PubMed] [Google Scholar]
- Ragab S, Lunt M, Birch A, Thomas P, Jenkinson DF. Caffeine reduces cerebral blood flow in patients recovering from an ischaemic stroke. Age Ageing. 2004;33:299–303. doi: 10.1093/ageing/afh091. [DOI] [PubMed] [Google Scholar]
- Chen YF, Parrish TB. Caffeine dose effect on activation-induced BOLD and CBF responses. Neuroimage. 2009;46:577–583. doi: 10.1016/j.neuroimage.2009.03.012. [DOI] [PMC free article] [PubMed] [Google Scholar]
- Black KJ, Koller JM, Campbell MC, Gusnard DA, Bandak SI. Quantification of indirect pathway inhibition by the adenosine A(2a) antagonist SYN115 in Parkinson disease. J Neurosci. 2010;30:16284–16292. doi: 10.1523/JNEUROSCI.2590-10.2010. [DOI] [PMC free article] [PubMed] [Google Scholar]
- Fukumitsu N, Ishii K, Kimura Y, Oda K, Sasaki T, Mori Y, et al. Imaging of adenosine A(1) receptors in the human brain by positron emission tomography with [C-11]MPDX. Ann Nucl Med. 2003;17:511–515. doi: 10.1007/BF03006445. [DOI] [PubMed] [Google Scholar]
- Svenningsson P, Le Moine C, Fisone G, Fredholm BB. Distribution, biochemistry and function of striatal adenosine A(2A) receptors. Prog Neurobiol. 1999;59:355–396. doi: 10.1016/s0301-0082(99)00011-8. [DOI] [PubMed] [Google Scholar]
- Ciruela F, Escriche M, Soloviev MM, Canela EI, Burgeno J, Mallol J, et al. Adenosine-glutamate receptor-receptor interactions in the central nervous system. Drug Dev Res. 2001;52:316–322. [Google Scholar]
- Benowitz NL. Clinical pharmacology of caffeine. Annu Rev Med. 1990;41:277–288. doi: 10.1146/annurev.me.41.020190.001425. [DOI] [PubMed] [Google Scholar]
- Rostrup E, Law I, Blinkenberg M, Larsson HBW, Born AP, Holm S, et al. Regional differences in the CBF and BOLD responses to hypercapnia: a combined PET and fMRI study. Neuroimage. 2000;11:87–97. doi: 10.1006/nimg.1999.0526. [DOI] [PubMed] [Google Scholar]
- Traystman RJ.Regulation of cerebral blood flow by carbon dioxideIn: Welch KMA, (ed).. Primer on Cerebrovascular Diseases Academic Press: CA, USA; 199755 [Google Scholar]
- Crozier TWM, Stalmach A, Lean MEJ, Crozier A. Espresso coffees, caffeine and chlorogenic acid intake: potential health implications. Food Funct. 2012;3:30–33. doi: 10.1039/c1fo10240k. [DOI] [PubMed] [Google Scholar]
- Freedman ND, Park Y, Abnet CC, Hollenbeck AR, Sinha R. Association of coffee drinking with total and cause-specific mortality. New EnglJ Med. 2012;366:1891–1904. doi: 10.1056/NEJMoa1112010. [DOI] [PMC free article] [PubMed] [Google Scholar]
- Hodgson JM, Puddey IB, Woodman RJ, Mulder TPJ, Fuchs D, Scott K, et al. Effects of black tea on blood pressure: a randomized controlled trial. Arch Intern Med. 2012;172:186–188. doi: 10.1001/archinte.172.2.186. [DOI] [PubMed] [Google Scholar]