

The computational prediction of miRNA targets has been the subject of intensive research. The authors describe the development of a novel approach designed specifically to identify miRNA binding sites within CDSs. They search for conserved motifs that are complementary to the miRNA seed region and also overrepresented in comparison with a background model that maintains both codon usage and amino acid sequence.
Keywords: binding site conservation, microRNA target prediction, microRNA targets in the coding region
Abstract
Finding microRNA targets in the coding region is difficult due to the overwhelming signal encoding the amino acid sequence. Here, we introduce an algorithm (called PACCMIT-CDS) that finds potential microRNA targets within coding sequences by searching for conserved motifs that are complementary to the microRNA seed region and also overrepresented in comparison with a background model preserving both codon usage and amino acid sequence. Precision and sensitivity of PACCMIT-CDS are evaluated using PAR-CLIP and proteomics data sets. Thanks to the properly constructed background, the new algorithm achieves a lower rate of false positives and better ranking of predictions than do currently available algorithms, which were designed to find microRNA targets within 3′ UTRs.
INTRODUCTION
MicroRNAs (miRNAs) are endogenous small, single-stranded RNAs that modulate mRNA levels and/or translation in the cell. Since the discovery of the first functional miRNA targets in Caenorhabditis elegans and Drosophila melanogaster, it has been observed that animal miRNAs act primarily on the 3′ untranslated region (3′ UTR) of the protein-coding genes through incomplete complementarity with the target sequence (Lee et al. 1993; Stark et al. 2003). Binding sites within coding sequences (CDSs) were widely observed only in plants (Jones-Rhoades and Bartel 2004). Because the first examples of functional miRNA binding sites in animals were found in the 3′ UTR, the vast majority of miRNA target prediction algorithms has focused on this region (Alexiou et al. 2009; Bartel 2009). Moreover, different studies have demonstrated that 3′ UTR sites are more effective in down-regulating gene expression than sites located in the coding region (Grimson et al. 2007; Forman et al. 2008; Gu et al. 2009; Forman and Coller 2010; Hafner et al. 2010; Fang and Rajewsky 2011). As a consequence, experimental validation of functional binding sites has been highly biased toward 3′ UTRs, creating an illusion of higher abundance of miRNA binding sites in this part of the gene transcripts.
The main role of the coding region is to carry the sequence information of functional proteins. However, the high degeneracy of the genetic code allows for much more information to be encoded. In particular, one could expect miRNA recognition sites to be found in the coding sequence as well. This hypothesis is already supported by several examples: The most overrepresented 6-mers in the human transcripts down-regulated after overexpression of miR-1 and miR-124 match perfectly the seeds of these miRNAs, and in fact, these motifs are present not only in the 3′ UTRs but also in the CDSs (Lim 2005). Similarly, most of the highly conserved motifs in D. melanogaster CDSs correspond to miRNA seed matches (Forman et al. 2008; Schnall-Levin et al. 2010). These observations together with the growing number of functional sites discovered in the coding region (Forman et al. 2008; Hafner et al. 2010; Schnall-Levin et al. 2010, 2011) have increased the interest in the prediction of miRNA binding sites within coding sequences. Several research groups have recently performed detailed analyses of proteomics data in order to estimate the extent of gene down-regulation caused by either the CDS or 3′ UTR sites in human transcripts (Forman and Coller 2010; Fang and Rajewsky 2011). One such analysis concluded that 3′ UTR sites are more effective than CDS sites in repressing protein synthesis (Forman and Coller 2010). Another study showed that targeting in the coding region enhances repression induced by the more potent 3′ UTR sites (Fang and Rajewsky 2011). As for abundance of binding sites in different regions of the transcript, similar distributions of conserved potential binding sites were reported in 3′ UTRs and CDSs of D. melanogaster genes (Schnall-Levin et al. 2010). Likewise, cross-linking and immunoprecipitation PAR-CLIP experiments in the human (Hafner et al. 2010) have shown that both CDSs and 3′ UTRs contain similar proportions of miRNA binding sites, challenging the notion that target sites are much more abundant in 3′ UTRs.
Seed matches in the coding region have been observed since the appearance of the first prediction methods. However, due to the strong selection pressure in the CDS, overrepresentation of these motifs could not be properly estimated (Lewis et al. 2005; Lim 2005). Motifs matching miRNA seeds may be overrepresented for several reasons different from miRNA-mediated gene regulation. They may be present so as to preserve a given amino acid sequence (i.e., to preserve protein function), or to privilege the use of codons for which the corresponding tRNA isoacceptors are more abundant (i.e., codon usage for translational efficiency) (Novoa et al. 2012). In order to identify seed matches overrepresented specifically due to miRNA function, overrepresentation must be assessed with respect to a background of random sequences that account for these other possible signals (Robins et al. 2008).
In previous studies, Robins and Press (2005) and Murphy et al. (2008) introduced a statistical framework for quantifying the extent of overrepresentation of 3′ UTR miRNA seed matches compared with a Markov model background. If c is the number of seed matches in the real sequence, the overrepresentation is measured by means of the so-called single hypothesis P-value (PSH), which is the probability to find the same seed match by chance at least c times in the random background sequence. Advantages of this approach in identifying and ranking high confidence miRNA-target interactions have been demonstrated on several occasions, where it has been used in conjunction with conservation (Robins and Press 2005; Murphy et al. 2008; Marin and Vanicek 2012) and accessibility filters in the algorithm called PACCMIT (Prediction of ACcessible and/or Conserved MIcroRNA Targets) (Marin and Vanicek 2011, 2012). The original version of the algorithm successfully predicted (Murphy et al. 2008) that the immediate early gene IE1 in the human cytomegalovirus was repressed by hcmv-mir-UL112-1, one of the first known miRNAs encoded by viruses (Pfeffer et al. 2005). Despite the effectiveness of PACCMIT in predicting 3′ UTR targets, this algorithm cannot be directly applied to the coding sequences because of the overwhelming strength of the coding signal in the CDS.
Here, we develop an algorithm to compute PSH in such a way that possible biases due to amino acid sequence and codon usage are removed. To do so, we combined the rigorous Fisher-Yates algorithm for generating permutations (Knuth 1997) with the method used by Fuglsang (2004) and Robins et al. (2005) for generating random background sequences preserving both amino acid sequence and codon usage. This ensures that the best scoring interactions correspond to complementary sites that are maintained for gene regulation purposes only. In contrast to the shuffling algorithm used by Fuglsang (2004), our approach based on the Fisher-Yates algorithm is unbiased; i.e., each permutation of codons is equally likely. Because of the proximity to the method PACCMIT, we have called the new algorithm PACCMIT-CDS (even though at present the new algorithm does not consider accessibility of the binding site).
Our analysis using experimentally validated targets shows that PACCMIT-CDS is, indeed, more appropriate to rank CDS targets than the best algorithms designed for the prediction of 3′ UTR sites. In addition, we present, for the first time, a comparison of the precision and sensitivity achieved by two other methods designed specifically to predict targets in the coding region. We will show that PACCMIT-CDS outperforms those algorithms in terms of precision, especially among the top predictions, which are the most likely to be selected for further experimental validation.
RESULTS
Ranking of predicted targets by overrepresentation of seed matches
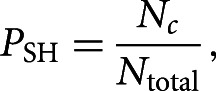
Considering that the gene transcripts have been shaped by millions of years of stochastic mutations and selection, it is reasonable to assume that functional binding sites that have avoided deleterious mutations should be overrepresented with respect to the composition of the surrounding sequence (Robins and Press 2005; Murphy et al. 2008; Marin and Vanicek 2012). If c denotes the number of seed matches (i.e., oligomers complementary to a given miRNA seed) in the real sequence, we can quantify the extent of overrepresentation by computing the probability PSH that this seed match would be found in this sequence at least c times by chance. Specifically, probability PSH is computed as
 |
(1) |
where Nc is the number of random sequences with at least c seed matches and Ntotal is the total number of random sequences. Lower PSH values (i.e., stronger overrepresentation) imply a higher likelihood of coevolution between the miRNA and the seed match and hence, a higher likelihood of biological functionality. The procedure used for the generation of the random sequences is described in the next subsection.
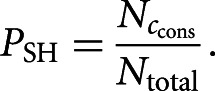
Precision of the algorithm can be increased by considering conservation of the seed match: If ccons is the number of conserved seed matches observed in the real sequence and  the number of random sequences with at least ccons conserved seed matches, the above formula is modified as
 |
(2) |
The procedure to classify a seed match as conserved is described in the Materials and Methods section.
Preservation of the protein sequence and/or codon usage in the random sequences
In order to remove possible false signals due to protein sequence or codon usage, we used four protocols to generate the random background sequences. These protocols differed in the restrictions imposed on the random sequences. In the first protocol, no restrictions (NR) were imposed. Each codon was randomly replaced by any other codon of the genetic code, independently of whether it was present or absent in the original sequence. In order to ensure preservation of the protein sequence (PS), in the second protocol each codon was also replaced randomly but only with synonymous codons. In the third protocol, we ensured the preservation of codon usage (CU) by shuffling all the codons present in the real sequence. The fourth and most restrictive protocol was designed to preserve both protein sequence and codon usage (PS + CU). This was achieved by Fuglsang (2004) and Robins et al. (2005) by shuffling only the codons that encode the same amino acids. However, in our case, in both CU and PS + CU protocols, the shuffling was implemented differently—namely, we used the Fisher-Yates shuffling algorithm (also known as the Knuth shuffle) (Knuth 1997). This method is known to be unbiased; i.e., it generates permutations with equal likelihood, unlike the more straightforward (but unfortunately, not formally correct) shuffling algorithm employed by Fuglsang (2004). For details, see the Materials and Methods section.
Importance of preserving protein sequence and codon usage in the random background
Combining the ranking criterion (Eq. 1) with one of the four backgrounds from the previous subsection yields our new PACCMIT-CDS algorithm. We applied PACCMIT-CDS to search the coding region of human genes for seed matches (i.e., 7-mers complementary to positions 2–8 of a miRNA) to all mature sequences registered in miRBase v18. For each miRNA-gene pair, the PSH-value, computed according to Eq. 1, was used to rank all the predicted interactions. In order to see to what extent the overrepresentation signal can be contaminated by other properties of the sequence unrelated to miRNA binding, we tested the four different background models described above. Naturally, we are interested in the background that provides the lowest signal because this assures that the noise caused by other features is removed. According to Figure 1A, both PS and CU backgrounds are able to remove part of the noise observed in the naive case of NR. However, PS + CU is the background model giving the least contaminated signal, implying that conservation of protein sequence and conservation of codon usage are independent constraints that would cause a substantial bias in the significance of the results if they were not incorporated into the background.
FIGURE 1.
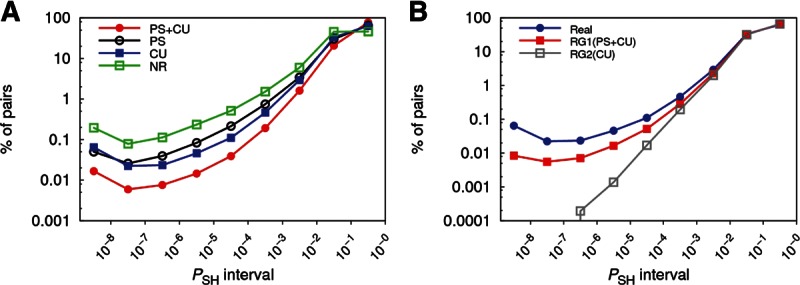
(A) Distribution of predicted miRNA-gene pairs according to their PSH values using four different background models. Percentages are computed with respect to the total number of predicted pairs. (B) Distribution of predicted miRNA-gene pairs for the real and two random genomes. PSH in the three genomes was computed using the CU background. RG1(PS + CU) and RG2(CU) were generated by shuffling the real sequences 1000 times.
An alternative way to corroborate the nonnegligible contamination of the signal caused, e.g., by the preservation of the protein sequence is to compare the signal from a random genome RG1(PS + CU) that preserves the original amino acid sequence and codon usage with that from the real genome, while using a CU background in both cases (see Fig. 1B). The RG1(PS + CU) distribution (red curve) gives an estimate of the part of the signal in the real genome simply due to the conservation of protein sequence. Specifically, we found that ∼30% of the signal observed for the real genome at PSH values below 10−5 comes from preservation of protein sequence. As expected, another random genome RG2(CU), preserving only the codon usage but not protein sequence, shows no signal in the low PSH range, which follows from the figure, since the fraction of miRNA-gene pairs is approximately proportional to PSH. Altogether, our observations confirmed the importance of requiring the preservation of both protein sequence and codon usage in the random background. As a consequence, from now on, PACCMIT-CDS denotes the algorithm based on Eq. 1 and on the PS + CU background, unless a different background is mentioned explicitly.
Requiring conservation of binding sites increases the signal-to-noise ratio
Previous studies have shown that requiring site conservation in 3′ UTRs significantly reduces the rate of false positives in miRNA target prediction. However, in order to effectively implement a similar strategy for predicting targets within CDSs, we must consider only the conservation of nucleotide sequence beyond the conservation of the amino acid sequence. This is done precisely by using the PS + CU background instead of the Markov model background used in PACCMIT. The predictions are now ranked according to the probability (given by Eq. 2) to observe, in a random sequence preserving both protein sequence and codon usage, a motif that matches the miRNA seed and that is conserved among this random sequence and the real sequences of several other species. If a motif that matches the miRNA seed appears in conserved regions of the real sequence but is rarely observed in the conserved regions of the randomly generated sequences, it is reasonable to assume that such a motif has a function beyond maintaining the protein sequence. In our algorithm, we assume that this function is miRNA regulation, but the motif may also be a transcription factor binding site or another regulatory signal. The fact that the motif has been conserved throughout evolution increases the likelihood that the function is real.
In Figure 2A, we show the distribution of the predictions obtained for the real genome and for the random genome RG1(PS + CU). Each of them was analyzed with and without considering site conservation (green and red curves, respectively) and always using a PS + CU background. In the real genome, one observes a higher percentage of conserved interactions than nonconserved interactions in most PSH intervals. In other words, the conservation filter resulted in enrichment in significant interactions. In the random genome, one observes the opposite; i.e., a lower percentage of predicted miRNA-gene pairs when conservation is required. This reflects the difficulty of observing those conserved sites just by chance, even if protein sequence and codon usage are preserved. These two complementary effects are the cause of the strong enhancement of the signal-to-noise ratio observed in Figure 2B. On one hand, these results show that we can achieve much more reliable predictions by requiring target site conservation in our algorithm. On the other hand, the results also show that, even if the conservation filter is not used (e.g., in order to predict species-specific miRNA-gene interactions), the appropriate treatment of the background still ensures that the top predictions are far from mere random occurrences of a given motif with no regulatory function (see red curve in Fig. 2B).
FIGURE 2.
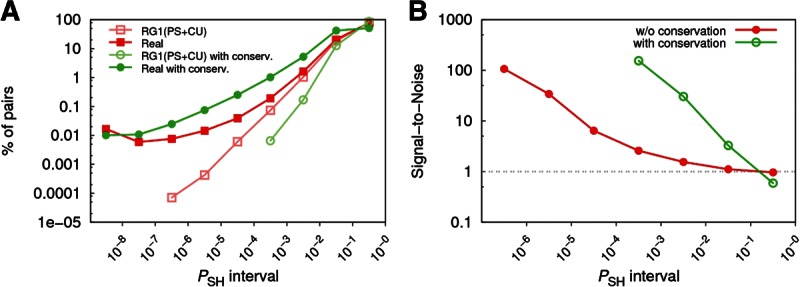
(A) Distribution of predicted miRNA-gene pairs for the real genome and random genome RG1(PS + CU). Results with and without considering site conservation are shown for both genomes. In all cases, PS + CU background is used. (B) Comparison of the signal-to-noise ratios obtained from curves in panel A. The real genome is considered as the signal, whereas RG1(PS + CU) is considered as the noise.
Precision of PACCMIT-CDS
In order to estimate the precision of PACCMIT-CDS, we used a set of positive and negative interactions derived from PAR-CLIP experiments (Hafner et al. 2010). Positive interactions were defined as miRNA-gene pairs in which the genes contained 7-mer seed matches located in the coding regions bound by the AGO-miRNA complex. Negative interactions were defined as miRNA-gene pairs in which the genes contained seed matches but for which binding was not detected. In total, 4376 validated interactions were used to test the predictive power of different algorithms (see Materials and Methods for details about the data set preparation).
Comparison between different background models (PS + CU, CU, and NR) shows that using a background that preserves both protein sequence and codon usage, indeed, removes more false positives than less restrictive randomization schemes, such as CU or NR. This is reflected in the high precision for the PS + CU curves observed in Figure 3. The figure also shows that requiring site conservation increases the precision of the algorithm by as much as ∼20%, independently of the background used (compare solid vs. dashed curves). In the case of “CU with conservation” and “NR with conservation,” many predictions have PSH < 10−8. Since in those cases the resolution obtained with 108 random sequences is not enough to establish a ranking (see Materials and Methods), we plotted the precision expected if such predictions were randomly ordered (flat regions).
FIGURE 3.
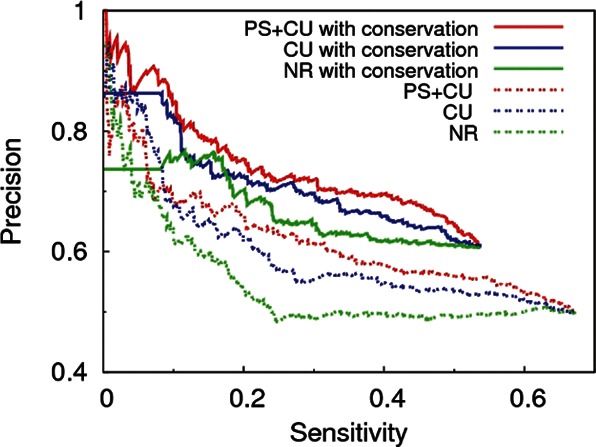
Precision vs. sensitivity curves for three different shuffling methods of PACCMIT-CDS. In all cases, the results with and without the conservation requirement are shown. Flat regions in the case of “CU with conservation” and “NR with conservation” represent the cases in which the resolution obtained with 108 random sequences is not sufficient to establish a ranking (PSH < 10−8).
To sum up, the expected advantages of using a proper background and conservation filter have been confirmed by the precision vs. sensitivity curves.
Changing the length of the seed match
Several different definitions of the minimal seed region have appeared in the literature. We, therefore, investigated the effects that longer or shorter seed matches would have on the performance of PACCMIT-CDS. For this purpose, the “shorter” seed match was defined as the 6-mer complementary to positions 2–7 in the miRNA, and the “longer” seed match was defined as the 8-mer complementary to positions 1–8.
Figure 4A shows the precision vs. sensitivity curves for the three different lengths of the seed match (6-, 7-, and 8-mers), always requiring site conservation. Surprisingly, the precision of the algorithm is not trivially correlated with the length of the seed. As one might expect, higher precision was obtained with 7-mers than with 6-mers. However, in most of the sensitivity range, the use of 7-mers resulted in a higher precision than even that achieved with 8-mers. The precision obtained with 8-mers was similar to that obtained with 7-mers only among the top predictions (below a sensitivity of 0.05). One might object that these observations could be biased by the definition of the data set of validated interactions from PAR-CLIP (we only considered bound 7-mers as functional targets). However, we observed the same relative performance among 6-, 7-, and 8-mers even for the proteomics data set (Selbach et al. 2008), in which the definition of functional and nonfunctional targets is completely independent of any seed match requirement (see Fig. 4B).
FIGURE 4.
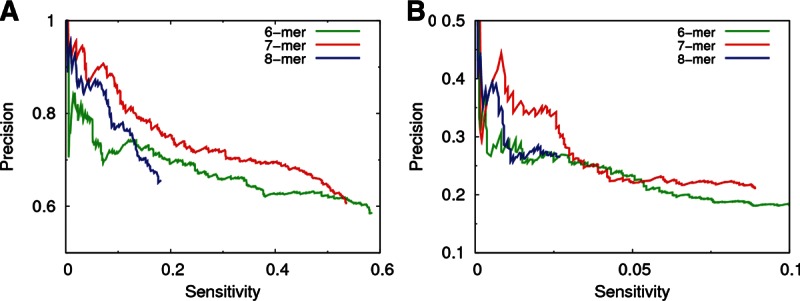
Effect of the length of the seed match on the precision and sensitivity of PACCMIT-CDS. In all cases, site conservation was required and PS + CU background was used. Results are shown for (A) the PAR-CLIP and (B) the proteomics data sets.
The fact that 7-mers perform better than 6-mers is consistent with previous studies in 3′ UTRs showing a higher specificity and effectiveness in gene repression when the target site perfectly matches positions 2–8 of the miRNA than when it only matches positions 2–7 (Grimson et al. 2007; Hafner et al. 2010). On the other hand, the fact that 7-mers are more reliable than 8-mers indicates that complementarity to position 1 does not confer any specificity to the miRNA-target recognition. This is consistent with the observation that conserved 7-mers in the 3′ UTR matching positions 2–8 of the miRNA tend to be flanked downstream by adenines independently of the nucleotide in position 1 of the miRNA (Lewis et al. 2005).
Comparison of different tools for predicting targets in the coding region
While many algorithms have been designed to predict target sites in 3′ UTRs (Hammell 2010), only a few have been specifically designed for target prediction in the coding region. MinoTar (Schnall-Levin et al. 2010) is an extension of the algorithm introduced by Forman et al. (2008), in which targets are determined by the presence of conserved 8-mers in the CDS. During the preparation of this manuscript, we also learned about the existence of DIANA-microT-CDS (Reczko et al. 2012), a method that considers both 3′ UTR and CDS sites. Although both methods have successfully demonstrated their advantages as prediction tools, it is not known how these methods perform with respect to each other. Here, we sought to fill this gap by comparing for the first time three CDS target prediction algorithms; i.e., MinoTar, DIANA-microT-CDS, and PACCMIT-CDS. Moreover, we also included in our comparison some methods designed to predict targets in the 3′ UTR (miRanda [Enright et al. 2003], TargetScan [Garcia et al. 2011], and PACCMIT [Marin and Vanicek 2012]) in order to evaluate whether the algorithmic improvements specific to the coding region, in fact, decrease the false positive rate. In order to avoid bias due to 3′ UTR sites, only targeting in the CDS was evaluated: Namely, predictions that involved at least one 6-mer in the 3′ UTR matching positions 2–7 of the miRNA were removed from the predictions of each method (see Materials and Methods).
Figure 5A shows that, among the CDS algorithms, PACCMIT-CDS and MinoTar are more precise than DIANA-microT-CDS in the region of low sensitivity; i.e., among the top predictions. This is confirmed in Figure 5B, where DIANA-microT-CDS is shown to make two mistakes before predicting the first true positive, whereas MinoTar and PACCMIT-CDS predict 11 and 12 true interactions, respectively, before they make the first mistake. The lower precision of DIANA-microT-CDS is most likely explained by the flexibility of the algorithm, allowing mismatches and wobble pairs inside the seed match. Regarding sensitivity, PACCMIT-CDS and DIANA-microT-CDS by far outperform MinoTar. This is not surprising, given the long seed requirement in MinoTar, in which only 8-mers are considered.
FIGURE 5.
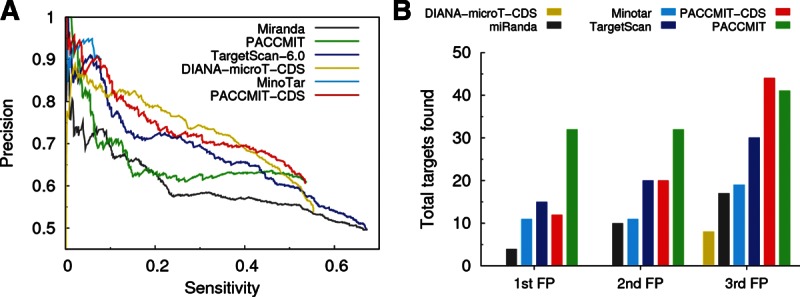
Comparison of different miRNA target prediction algorithms. (A) Precision vs. sensitivity curves for the different methods. (B) Numbers of true positives found before the first, second, and third false positives are found.
Finally, the figure also shows that CDS-specific algorithms perform generally better than 3′ UTR-specific algorithms, confirming that the additional restrictions included in the CDS-specific methods have, indeed, a positive impact on precision. Nevertheless, it is important to remark that, since 3′ UTR methods had not been designed to predict targets in the coding region, a suboptimal performance was expected. Given that the signal in the coding region is strongly “contaminated” with coding information, algorithms designed for the prediction of sites in the 3′ UTR should not be capable of differentiating the real signal from the noise. Because of this, we find it remarkable that PACCMIT and TargetScan always outperformed MinoTar and DIANA-microT-CDS (but not PACCMIT-CDS) as far as the number of mistakes among the very top predictions is concerned (see Fig. 5B).
DISCUSSION
We have introduced a method to predict targets in the coding region of the gene transcripts in which miRNA-gene interactions are ranked according to overrepresentation of conserved seed matches. The use of overrepresentation was inspired by the demonstrated success in predicting targets in the 3′ UTR (Murphy et al. 2008; Marin and Vanicek 2011, 2012). However, due to the fact that CDSs can carry both coding and regulatory information, further restrictions in the modeling of the background sequences were implemented in order to identify overrepresented motifs with a regulatory function. In fact, we have shown that ∼30% of the most overrepresented (PSH < 10−5) seed matches in the human CDSs cannot be reliably associated to a regulatory function. In order to subtract the signal produced by motifs that have no other role than to preserve protein function and translational efficiency, background sequences were required to preserve the amino acid sequence and codon usage.
The practical advantages of using conservation and a proper background were corroborated by using experimentally validated miRNA targets. The resulting precision vs. sensitivity curves showed not only that the best performance of the algorithm was achieved when PS + CU background and site conservation were used but also that PACCMIT-CDS was, indeed, more suitable to predict targets in the CDS than methods designed for 3′ UTR target identification. In addition, we compared, for the first time, the performance of three different methods specifically designed to predict targets in the coding sequence. We found that PACCMIT-CDS was more precise among the top predictions than MinoTar and DIANA-microT-CDS. As our algorithm was able to achieve high precision without having to restrict seed matches to 8-mers, PACCMIT-CDS also turned out to be much more sensitive than MinoTar.
In comparison with the prediction of miRNA targets in the 3′ UTR, target prediction in the coding region has been much less explored, and therefore, there is still room for improvement. The high information content of the coding region and the lower efficacy of CDS sites constitute the main challenges in the prediction of CDS targets. The rigorous approach presented here contributes to the field by describing a new method that effectively removes nonregulatory signals in the coding region and, at the same time, achieves the best balance between precision and sensitivity among available algorithms.
MATERIALS AND METHODS
Fisher-Yates algorithm for generating unbiased shuffles
The shuffling protocols CU and PS + CU employed the Durstenfeld modification of the Fisher-Yates algorithm for generating random permutations (“shuffles”) of an array with N elements (Knuth 1997). The Fisher-Yates-Durstenfeld method consists of performing a pass over the array elements with indices i from 1 to N−1. For each index i, one picks a random integer j satisfying i ≤ j ≤ N and consequently swaps ith and jth elements. This algorithm exhibits linear complexity in N in contrast to the original quadratic implementation of Fisher and Yates. More importantly, both versions generate all of the N! different permutations with equal likelihood. This follows since the total number of generated sequences is N! and since one can attain any possible permutation of the original array with this algorithm. Note that one might be tempted to choose both i and j from the entire range; i.e., 1 ≤ i,j ≤ N (Fuglsang 2004). However, since this “alternative” algorithm can generate NN possible sequences and since NN is, for N > 2, not divisible by N!, one concludes that this approach produces some permutations more often than others.
Acceleration of the calculation of PSH values
Random sequences were generated by the following iterative procedure. In each iteration, the sequence of codons was scanned linearly and the codon at each position was replaced by a codon randomly selected according to one of the NR, PS, CU, and PS + CU protocols. In order to obtain a resolution of 10−n for PSH, 10n random sequences (i.e., 10n randomizing iterations) are required. The value of n = 8 was chosen as a compromise between resolution and computational cost. However, instead of using the same value of n for all genes, the following trick was employed to decrease the computational cost enormously: Because in >95% of the cases PSH was above 10−3, further refinement to a resolution of 10−8 was not necessary. In order to avoid the unnecessary (and expensive) refinement, we started with low resolution (n = 3) and gradually increased it from n = 3 to n = 8. Every time n was increased, we checked PSH values, and whenever all PSH values for gene g (i.e., for all miRNA-g interactions) were at least five times the current resolution (i.e., PSH ≥ 5 × 10−n), we considered PSH values to be sufficiently converged. In this case, PSH values for gene g were not further refined and g was excluded from further iterations. Given that only a few genes actually needed 108 iterations to estimate PSH, the overall computational cost was much lower than it would have been if the PSH values for all genes had been unnecessarily refined with the same resolution.
Distribution of PSH values
The predicted miRNA-gene pairs were divided among different bins according to the extent of overrepresentation. PSH intervals were defined as 10−(n+1) ≤ PSH < 10−n, for n = 0, 1, …, 7. Since the best resolution of PSH that one can achieve with 108 random sequences is 10−8, the last interval was simply defined as PSH < 10−8. Finally, we divided the number of pairs in each bin by the total number of predicted pairs. This facilitated the comparison of distributions in which the total numbers of predicted pairs were different.
The signal-to-noise ratio for a given PSH interval was defined as the ratio between the fractions of predictions within this PSH interval in two genomes: the real genome (signal) and the random background (noise). In other words, noise is the percentage of predicted interactions within a PSH interval that is expected by chance. Thus, a high signal-to-noise ratio implies a high probability that the predictions in that PSH interval are functional.
Data sets of validated targets
In order to compute precision and sensitivity of different methods, we constructed positive and negative data sets using the binding sites reported in the PAR-CLIP experiments (Hafner et al. 2010). In order to obtain a set of bound and unbound sites located in the coding region, we followed a similar procedure to that used by Marin and Vanicek (2012). We only focused on the 100 most abundant miRNAs since these account for 96% of the miRNA sequence reads. From the set of 100 most abundant miRNAs, we selected only the 74 that are conserved (see miRNA conservation section below). Functional miRNA-gene pairs were defined as those pairs in which at least one 7-mer matching miRNA positions 2–8 was found between positions 21 and 30 of the cluster-centered regions (CCRs) that were mapped to the coding region of human transcripts (human assembly hg18). This particular location in the CCR was used because, according to the PAR-CLIP validation, a majority of the perfect miRNA seed matches are found there. A total of N = 2188 highly reliable positive interactions were identified in this way.
As for the negative data set, we first selected all unbound genes; i.e., all genes for which no CCR could be mapped to any region of the whole transcript (5′ UTR, CDS, or 3′ UTR). Among these unbound genes we selected all the cases in which at least one 7-mer complementary to positions 2–8 of any of the 74 conserved miRNAs was found. We call these the “unbound” miRNA-gene pairs. Finally, the negative data set of nonfunctional pairs was constructed by randomly selecting N = 2188 pairs from the list of unbound pairs. We intentionally constructed the negative data set of the same size as the positive data set in order that the values of precision achieved by various methods were well-distributed between 0 and 1 and not concentrated at either of the extremes, as could happen if the proportion of negatives in the data set were too high or too low.
The proteomics data of Selbach et al. (2008), which provides the protein fold changes measured after overexpression of five conserved miRNAs, was also used to compute precision and sensitivity in the case in which different lengths of the seed match were tested.
mRNA sequences and site conservation
Genomic coordinates of Ensembl human genes (hg18) were used to extract the human coding sequences available at the UCSC Table browser (http://genome.ucsc.edu) (Karolchik et al. 2004). When alternative transcript isoforms were reported for the same Ensembl gene ID, only the one with the longest coding sequence was used in the analysis. We also removed exceptional cases (∼1%) in which the length of the sequence was not a multiple of three; i.e., for which not all nucleotides could be assigned to a codon, probably due to errors in the exon annotation. Finally, a total of 21,426 coding sequences was analyzed.
In order to assess the conservation of seed matches in the human genome among different species, we used the 28-species alignment (MAF file) available at the UCSC Table browser (Miller et al. 2007). In particular, we employed the “Any-species” approach introduced by Marin and Vanicek (2012). In this approach, a seed match is considered conserved if it is present in the aligned sequences of at least S species (including the human), regardless of their phylogenetic distance from the human. Increasing S makes the conservation filter more stringent. Since previous parameterization of the filter using 3′ UTR alignments showed that conservation in 12 species (S = 12) provided the best precision-sensitivity trade-off, we used this cutoff (S = 12) in all calculations with PACCMIT and PACCMIT-CDS.
miRNA sequences
Mature human miRNA sequences were obtained from the miRBase v18 (http://www.mirbase.org) (Griffiths-Jones et al. 2006). A total of 1919 sequences was used in our analysis. Conservation of the miRNAs present in the data set of experimental interactions validated by PAR-CLIP was defined in the same way as done by Marin and Vanicek (2012); i.e., miRNAs were considered to be conserved if they shared the same seed sequence (positions 2–8) in different species. Specifically, we call “conserved” miRNAs those labeled as “highly conserved” in the TargetScan database (http://www.targetscan.org).
Predictions by other methods
DIANA-microT-CDS (Reczko et al. 2012): Predictions were downloaded from http://www.microrna.gr/microT-CDS in March 2012. MinoTar (Schnall-Levin et al. 2010): Predictions were obtained from http://www.flyrnai.org/cgi-bin/DRSC_MinoTar.pl in August 2011. MiRanda (Enright et al. 2003): The latest version of the software (August 2010), downloaded from http://www.microrna.org/microrna/getDownloads.do, was used with default parameters. TargetScan (Garcia et al. 2011): The latest version of the software (version 6.0), downloaded from http://www.targetscan.org/cgi-bin/targetscan/data_download.cgi?db=vert_61, was used to compute the total context + scores. PACCMIT (Marin and Vanicek 2012): Predictions were obtained using the “Any-species” approach for conservation of the binding site, with S = 12.
In order to compare the different methods on the same experimental data sets, gene names in the predictions of MinoTar were translated from RefSeq IDs and gene symbols to Ensembl gene IDs using the BioMart tool and Ensembl version 54 (available at http://may2009.archive.ensembl.org). In order to eliminate possible bias due to 3′ UTR targeting, only CDS targets from each method were considered. In the case of DIANA-microT-CDS, this was ensured by selecting only genes with so-called “CDS” sites. In the case of the other algorithms, we removed from the list of predictions all target genes with at least one 6-mer seed match in the 3′ UTR (i.e., complementary to positions 2–7 of the miRNA). This restriction removed between ∼30% and ∼40% of the predictions of the compared methods.
SUPPLEMENTAL MATERIAL
Supplemental material is available for this article and shows PACCMIT-CDS predictions in the human (both with and without the conservation requirement). These predictions were obtained with 7-mer seed matches and with the PS+CU background. The PACCMIT-CDS program is available freely at http://lcpt.epfl.ch/PACCMIT-CDS.
Supplementary Material
ACKNOWLEDGMENTS
This research was supported by Ecole Polytechnique Fédérale de Lausanne.
REFERENCES
- Alexiou P, Maragkakis M, Papadopoulos GL, Reczko M, Hatzigeorgiou AG 2009. Lost in translation: An assessment and perspective for computational microRNA target identification. Bioinformatics 25: 3049–3055 [DOI] [PubMed] [Google Scholar]
- Bartel DP 2009. MicroRNAs: Target recognition and regulatory functions. Cell 136: 215–233 [DOI] [PMC free article] [PubMed] [Google Scholar]
- Enright A, John B, Gaul U, Tuschl T, Sander C, Marks D 2003. MicroRNA targets in Drosophila. Genome Biol 5: R1. [DOI] [PMC free article] [PubMed] [Google Scholar]
- Fang Z, Rajewsky N 2011. The impact of miRNA target sites in coding sequences and in 3′UTRs. PLoS ONE 6: e18067. [DOI] [PMC free article] [PubMed] [Google Scholar]
- Forman JJ, Coller HA 2010. The code within the code: microRNAs target coding regions. Cell Cycle 9: 1533–1541 [DOI] [PMC free article] [PubMed] [Google Scholar]
- Forman JJ, Legesse-Miller A, Coller HA 2008. A search for conserved sequences in coding regions reveals that the let-7 microRNA targets Dicer within its coding sequence. Proc Natl Acad Sci 105: 14879–14884 [DOI] [PMC free article] [PubMed] [Google Scholar]
- Fuglsang A 2004. The relationship between palindrome avoidance and intragenic codon usage variations: A Monte Carlo study. Biochem Biophys Res Commun 316: 755–762 [DOI] [PubMed] [Google Scholar]
- Garcia DM, Baek D, Shin C, Bell GW, Grimson A, Bartel DP 2011. Weak seed-pairing stability and high target-site abundance decrease the proficiency of lsy-6 and other microRNAs. Nat Struct Mol Biol 18: 1139–1146 [DOI] [PMC free article] [PubMed] [Google Scholar]
- Griffiths-Jones S, Grocock RJ, van Dongen S, Bateman A, Enright AJ 2006. miRBase: microRNA sequences, targets and gene nomenclature. Nucleic Acids Res 34: D140–D144 [DOI] [PMC free article] [PubMed] [Google Scholar]
- Grimson A, Farh KK-H, Johnston WK, Garrett-Engele P, Lim LP, Bartel DP 2007. MicroRNA targeting specificity in mammals: Determinants beyond seed pairing. Mol Cell 27: 91–105 [DOI] [PMC free article] [PubMed] [Google Scholar]
- Gu S, Jin L, Zhang F, Sarnow P, Kay MA 2009. Biological basis for restriction of microRNA targets to the 3′ untranslated region in mammalian mRNAs. Nat Struct Mol Biol 16: 144–150 [DOI] [PMC free article] [PubMed] [Google Scholar]
- Hafner M, Landthaler M, Burger L, Khorshid M, Hausser J, Berninger P, Rothballer A, Ascano M Jr, Jungkamp A-C, Munschauer M, et al. 2010. Transcriptome-wide identification of RNA-binding protein and microRNA target sites by PAR-CLIP. Cell 141: 129–141 [DOI] [PMC free article] [PubMed] [Google Scholar]
- Hammell M 2010. Computational methods to identify miRNA targets. Semin Cell Dev Biol 21: 738–744 [DOI] [PMC free article] [PubMed] [Google Scholar]
- Jones-Rhoades MW, Bartel DP 2004. Computational identification of plant microRNAs and their targets, including a stress-induced miRNA. Mol Cell 14: 787–799 [DOI] [PubMed] [Google Scholar]
- Karolchik D, Hinrichs AS, Furey TS, Roskin KM, Sugnet CW, Haussler D, Kent WJ 2004. The UCSC Table Browser data retrieval tool. Nucleic Acids Res 32: D493–D496 [DOI] [PMC free article] [PubMed] [Google Scholar]
- Knuth DE 1997. The art of computer programming, volume 2: Seminumerical algorithms. Addison-Wesley Professional [Google Scholar]
- Lee R, Feinbaum R, Ambros V 1993. The C. elegans heterochronic gene lin-4 encodes small RNAs with antisense complementarity to lin-14. Cell 75: 843–854 [DOI] [PubMed] [Google Scholar]
- Lewis BP, Burge CB, Bartel DP 2005. Conserved seed pairing, often flanked by adenosines, indicates that thousands of human genes are microRNA targets. Cell 120: 15–20 [DOI] [PubMed] [Google Scholar]
- Lim LP 2005. Microarray analysis shows that some microRNAs downregulate large numbers of target mRNAs. Nature 433: 769–773 [DOI] [PubMed] [Google Scholar]
- Marin RM, Vanicek J 2011. Efficient use of accessibility in microRNA target prediction. Nucleic Acids Res 39: 19–29 [DOI] [PMC free article] [PubMed] [Google Scholar]
- Marin RM, Vanicek J 2012. Optimal use of conservation and accessibility filters in microRNA target prediction. PLoS ONE 7: e32208. [DOI] [PMC free article] [PubMed] [Google Scholar]
- Miller W, Rosenbloom K, Hardison RC, Hou M, Taylor J, Raney B, Burhans R, King DC, Baertsch R, Blankenberg D, et al. 2007. 28-Way vertebrate alignment and conservation track in the UCSC Genome Browser. Genome Res 17: 1797–1808 [DOI] [PMC free article] [PubMed] [Google Scholar]
- Murphy E, Vanícˇek J, Robins H, Shenk T, Levine AJ 2008. Suppression of immediate-early viral gene expression by herpesvirus-coded microRNAs: Implications for latency. Proc Natl Acad Sci 105: 5453–5458 [DOI] [PMC free article] [PubMed] [Google Scholar]
- Novoa EM, Pavon-Eternod M, Pan T, Ribas de Pouplana L 2012. A role for tRNA modifications in genome structure and codon usage. Cell 149: 202–213 [DOI] [PubMed] [Google Scholar]
- Pfeffer S, Sewer A, Lagos-Quintana M, Sheridan R, Sander C, Grasser FA, van Dyk LF, Ho CK, Shuman S, Chien MC, et al. 2005. Identification of microRNAs of the herpesvirus family. Nat Methods 2: 269–276 [DOI] [PubMed] [Google Scholar]
- Reczko M, Maragkakis M, Alexiou P, Grosse I, Hatzigeorgiou AG 2012. Functional microRNA targets in protein coding sequences. Bioinformatics 28: 771–776 [DOI] [PubMed] [Google Scholar]
- Robins H, Press WH 2005. Human microRNAs target a functionally distinct population of genes with AT-rich 3′UTRs. Proc Natl Acad Sci 102: 15557–15562 [DOI] [PMC free article] [PubMed] [Google Scholar]
- Robins H, Krasnitz M, Barak H, Levine AJ 2005. A relative-entropy algorithm for genomic fingerprinting captures host-phage similarities. J Bacteriol 187: 8370–8374 [DOI] [PMC free article] [PubMed] [Google Scholar]
- Robins H, Krasnitz M, Levine AJ 2008. The computational detection of functional nucleotide sequence motifs in the coding regions of organisms. Exp Biol Med 233: 665–673 [DOI] [PubMed] [Google Scholar]
- Schnall-Levin M, Zhao Y, Perrimon N, Berger B 2010. Conserved microRNA targeting in Drosophila is as widespread in coding regions as in 3′UTRs. Proc Natl Acad Sci 107: 15751–15756 [DOI] [PMC free article] [PubMed] [Google Scholar]
- Schnall-Levin M, Rissland OS, Johnston WK, Perrimon N, Bartel DP, Berger B 2011. Unusually effective microRNA targeting within repeat-rich coding regions of mammalian mRNAs. Genome Res 21: 1395–1403 [DOI] [PMC free article] [PubMed] [Google Scholar]
- Selbach M, Schwanhausser B, Thierfelder N, Fang Z, Khanin R, Rajewsky N 2008. Widespread changes in protein synthesis induced by microRNAs. Nature 455: 58–63 [DOI] [PubMed] [Google Scholar]
- Stark A, Brennecke J, Russell RB, Cohen SM 2003. Identification of Drosophila microRNA targets. PLoS Biol 1: e60. [DOI] [PMC free article] [PubMed] [Google Scholar]
Associated Data
This section collects any data citations, data availability statements, or supplementary materials included in this article.