Biases in miRNA quantification at the intensity level were systematically investigated by comparing the output of three high-throughput commercial platforms, Agilent and Affymetrix microarrays and Illumina next-generation sequencing. Two approaches were applied to evaluate platform performance: introduction of spiked-in miRNAs into native total RNA as well as quantification of more than 300 endogenously expressed miRNAs. The ability to detect miRNAs was shown to depend strongly on the platform and on miRNA modifications and sequence. This study provides a basis for understanding the sequence attributes that should be considered to adjust platform-dependent detection biases.
Keywords: miRNA, microRNA, differential expression, microarray, next-generation sequencing, miRNA-seq
Abstract
Identification and quantification of small RNAs are challenging because of their short length, high sequence similarities within microRNA (miRNA) families, and the existence of miRNA isoforms and O-methyl 3′ modifications. In this study, the detection performance of three high-throughput commercial platforms, Agilent and Affymetrix microarrays and Illumina next-generation sequencing, was systematically and comprehensively compared. The ability to detect miRNAs was shown to depend strongly on the platform and on miRNA modifications and sequence. Using synthetic transcripts, including mature, precursor, and O-methyl-modified miRNAs spiked into human RNA, a large intensity variation in all spiked-in miRNAs and a reduced capacity in detecting O-methyl-modified miRNAs were observed between the tested platforms. In addition, endogenous human miRNA expression levels were assessed across the platforms. Detected miRNA expression levels were not consistent between platforms. Although biases in miRNA detection were previously described, here the end-point result, i.e., detection intensity, of these biases was investigated on multiple platforms in a controlled fashion. A detailed exploration of a large number of attributes, including base composition, sequence structure, and isoform miRNA attributes, suggests their impact on miRNA expression detection level. This study provides a basis for understanding the attributes that should be considered to adjust platform-dependent detection biases.
INTRODUCTION
Small RNAs (sRNAs) are known to play an important regulatory role in a wide range of organisms in many biological processes, such as gametogenesis, embryo development, cell differentiation, growth/proliferation, defense, migration, and apoptosis/death via regulation of expression of a diverse array of genes (Ghildiyal and Zamore 2009; Zhang 2009; Karginov and Hannon 2010). In addition, they have been shown to regulate cellular processes by affecting chromatin modifications in animals and plants (Bourc’his and Voinnet 2010), fertilization, and early zygotic development (Lejeune and Allshire 2011; Simon and Meyers 2011). Recent studies have also established their increasing impact on disease states, as manifested by aberrant sRNA expression profiles in cancer as well as in neurological and cardiovascular diseases (Chang and Mendell 2007; Esteller 2011). Since sRNAs have been proposed to constitute potential biomarkers, it is of extreme importance to detect and quantify their differential expression accurately (Schöler et al. 2010; Li et al. 2012).
Several classes of sRNA have been identified, including microRNAs (miRNAs), small interfering RNAs (siRNAs), and Piwi-interacting RNAs (piRNAs), all of which modulate mRNA expression by physically binding to specific targets. While they differ in their biogenesis, their modes of target regulation, and in the biological pathways they regulate, all sRNAs are characterized by a 5′ phosphate and a 3′ hydroxyl group. A previously characterized modification, 2′-O-methyl at the 3′ terminus, can be found in plant miRNA and in piRNAs and siRNAs of other organisms (Ghildiyal and Zamore 2009).
The primary miRNA is processed by the Drosha enzyme, releasing an ∼70-nt precursor that is subsequently processed by the Dicer enzyme to result in a mature ∼22-nt product. miRNA precursors have been detected in cell lines and tissues and have been suggested as potential disease markers (Schmittgen et al. 2008; O’Hara et al. 2009). The quantity of mature miRNA does not necessarily correlate with the quantity of its precursor, due to divergent and unique regulation processes individually influencing each molecule (Chugh and Dittmer 2012).
Profiling of mature miRNAs and their precursors has an important role in elucidating the regulatory networks in which they are involved. Real-time qPCR (Shi and Chiang 2005), microarray hybridization (Yin et al. 2008), and next-generation sequencing (NGS) technologies (Fox et al. 2009) have been used to identify and quantify miRNAs. All these miRNA profiling methods face unique challenges, due to several miRNA characteristics: (1) mature miRNAs are very short; (2) miRNAs share high sequence homology within families, with as low as 1 base difference; (3) miRNAs are known to have a large number of isoforms due to RNA editing, single nucleotide, and length polymorphisms. All the above present obstacles for primer or probe design and hybridization in microarrays or qPCR (for review, see Chugh and Dittmer 2012; Pritchard et al. 2012). In NGS, sequence similarity of miRNAs may cause a problem in discriminating between miRNAs due to PCR and sequencing errors. The short and variable length of miRNA reduces the ability to accurately identify the border between the miRNA and the adaptor.
NGS of miRNAs is coming into wider use and provides unmatched efficacy in discovering and detecting miRNAs. However, the library preparation methods used in NGS seem to have systematic biased representation of the miRNAs (Linsen et al. 2009; Tian et al. 2010; Hafner et al. 2011; Van Nieuwerburgh et al. 2011). These biases can be introduced during ligation, cDNA synthesis, and PCR amplification. Biases in microarrays can be caused during labeling and hybridization (Bissels et al. 2009; Willenbrock et al. 2009). In addition, it has been reported that several enzymatic reactions are less efficient on 2′-O-methyl-modified miRNAs and can result in under-representation of the modified miRNAs in quantification experiments (Ebhardt et al. 2005; Munafó and Robb 2010).
Several studies have compared the ability of microarrays and NGS to measure differential miRNA expression (Fahlgren et al. 2009; Willenbrock et al. 2009; Git et al. 2010). Willenbrock et al. (2009) compared microarrays (Exiqon) to NGS (Illumina Genome Analyzer II) by sequencing 16 pools of 744 synthetic human miRNAs using both methods. The investigators conclude that microarrays better reflect the spiked-in quantities and that both methods are equivalent in reproducibility and relative ratio quantification. Fahlgren et al. (2009) separately introduced three synthetic oligoribonucleotides (21 bases) mimicking miRNAs to Arabidopsis RNA samples and then sequenced the samples by NGS. The different spiked-in molecules were found to have varied efficiency of sequencing.
However, a comprehensive study in which specific miRNAs at known concentrations were spiked in and measured within a real biological background has not been performed. The present study undertook an integrative technological approach to compare three high-throughput commercial platforms: Agilent, Affymetrix, and Illumina NGS, in their efficacy of miRNA detection. To the best of our knowledge, this is the first study to evaluate 2′-O-methyl-modified miRNA quantification and to assess whether the presence of precursor miRNA interferes with mature miRNA quantification. For this purpose, human precursor, 2′-O-methyl-modified, and mature spiked-in miRNAs were artificially introduced, in a controlled fashion, into native human total RNA samples. This study comprehensively and systematically compared the efficiency of the three platforms in quantifying a large number of endogenous miRNA and thoroughly explored numerous factors influencing quantification disparities, using the most recent laboratory protocols.
RESULTS
The primary goal of this analysis was to compare the strengths and weaknesses of three widely used high-throughput commercial platforms, namely, Agilent and Affymetrix microarrays and Illumina NGS, for miRNA analysis. This was performed by spiking biological samples with artificial transcripts, in which the relative abundance of spiked-in miRNAs is predetermined. Precursor, 2′-O-methyl-modified, and mature miRNAs were spiked in to total native human RNA at various concentrations. A basic assessment of spiked-in miRNA detection slopes and fold changes between the administered concentrations was performed. Next, the large number of total RNA replicates containing endogenous miRNAs served as a sound basis for comparing the detection abilities of the three platforms and to uncover the factors influencing detection.
Mature spiked-in miRNA behavior
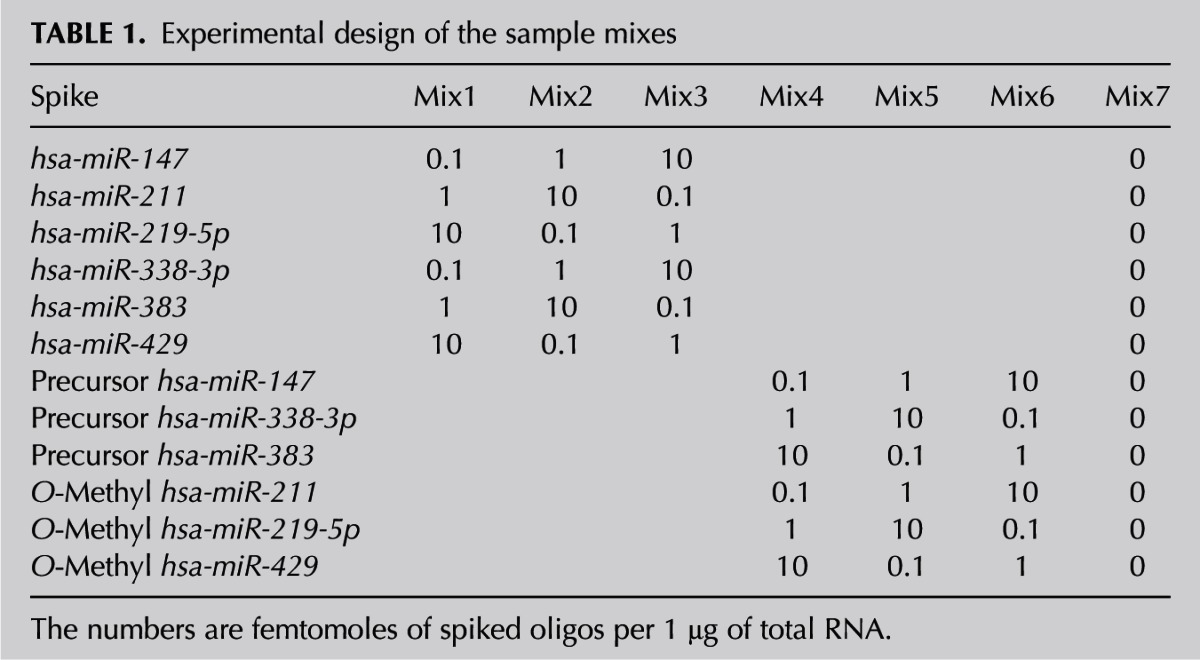
Twelve synthetic transcripts were spiked in to human placenta total RNA, at known input amounts. These transcripts included six mature miRNAs (hsa-miR-147, hsa-miR-338-3p, hsa-miR-383, hsa-miR-211, hsa-miR-219-5p, and hsa-miR-429), three precursor miRNAs (hsa-miR-147, hsa-miR-338-3p, and hsa-miR-383), and three miRNAs carrying an O-methyl 3′ modification (hsa-miR-211, hsa-miR-219-5p, and hsa-miR-429). All spiked-in miRNAs were selected based on prior knowledge that they endogenously occur in human placenta at quantities below the power of microarray detection (Sah et al. 2010). Six mixes were prepared, three of which contained the mature miRNAs spiked at various concentrations, while the others contained a combination of precursor and modified miRNA sequences. Each mix contained 1, 10, or 100 fmol of any given component (Table 1). A control mix containing only native total RNA was added. The entire mix design was repeated in two biological replicates. The starting material used in all platforms was identical.
TABLE 1.
Experimental design of the sample mixes
Linear correlations were found between the amounts of spiked-in miRNA detected (Supplemental Table 5) and the actual amounts added to total RNA samples (Fig. 1). The linear correlations were high and similar among the three platforms, spanning between 0.97 and 1. The slope of the linear fits was between 0.57 and 1.01 in Affymetrix, between 0.9 and 1.4 in NGS and between 0.9 and 1.3 in Agilent. The fluorescence intensities and normalized reads (rpm) obtained for different spikes at the same concentration varied up to 500-fold in Affymetrix (Fig. 1A), 10-fold in NGS (Fig. 1B), and fivefold in Agilent (Fig. 1C) platforms. These variations were miRNA dependent and/or platform dependent, e.g., miRNA 383 showed high detection values in all tested platforms (miRNA dependent), while detection values of miRNA 338-5p were platform dependent (Fig. 1). All coefficients of variance were below 0.15, with the single exception of the Affymetrix platform (Supplemental Table 5), indicating reasonable reproducibility of the spiked-in miRNA detection values. Since all mixes were prepared simultaneously and the same batch was used for all platforms, the variation observed is not a result of technical issues. The spiked-in miRNA at 0.1 fmol lies within the lower end of the detection threshold of the Agilent platform (Fig. 1C). For Affymetrix and NGS, the scattering of the intensity signals was observed for all three tested concentrations of spiked-in miRNA (Fig. 1A,B).
FIGURE 1.
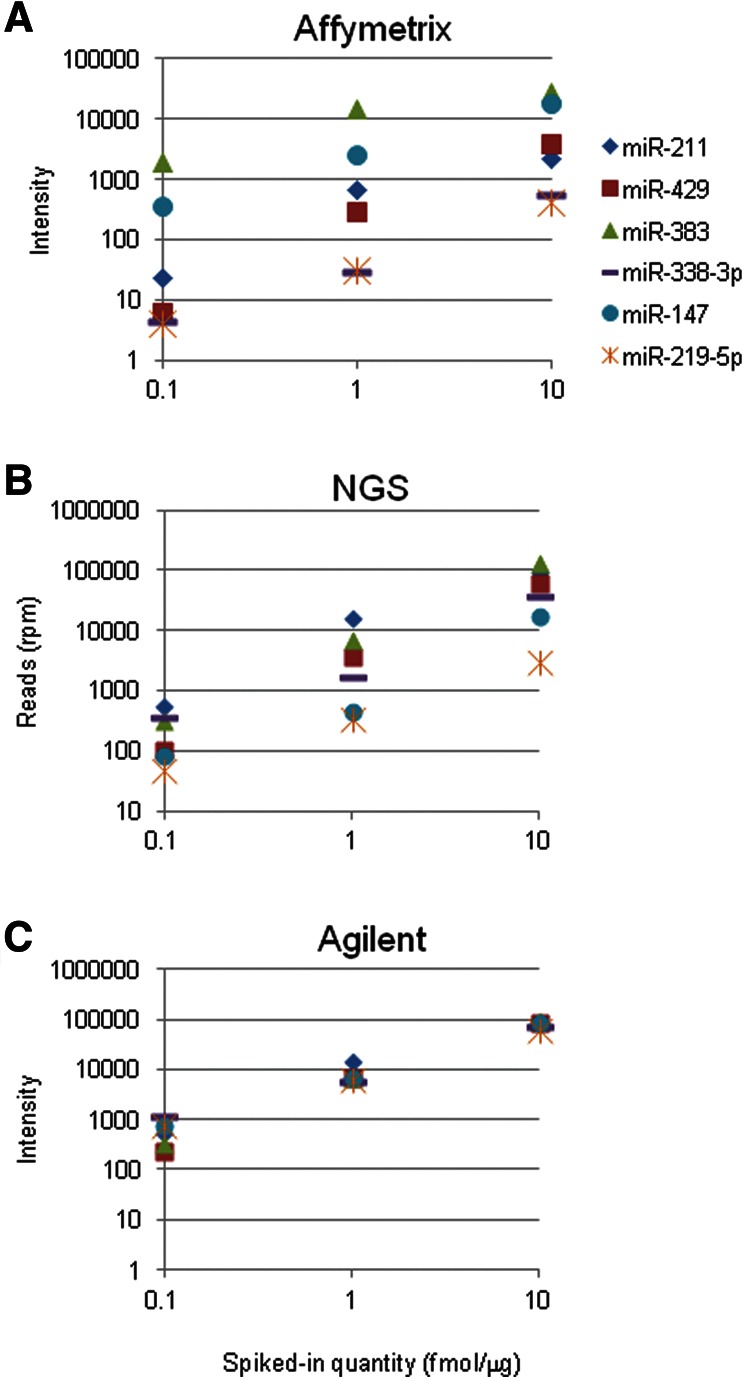
Scatterplots of the amounts of mature spiked-in miRNAs and the observed intensities, in log (base 10) scale on the (A) Affymetrix, (B) NGS, and (C) Agilent platforms.
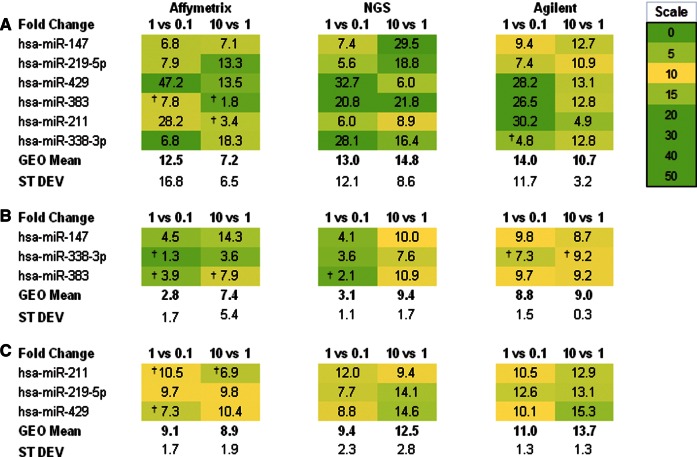
When comparing miRNA expression between samples, differentially expressed genes are usually defined as those undergoing statistically significant changes, with a fold change of ≥1.5. In the present setup, the miRNA to be detected was introduced at concentrations with 10-fold incremental differences; however, the detected differences were as low as 1.8-fold and as high as 47-fold, when using Affymetrix arrays, some of which were not statistically significant. NGS and Agilent detected fold changes ranging 6.0–32.7 and 4.8–30.2, respectively. Agilent was found to be the most accurate platform in comparing the 1- and 10-fmol spiked-in miRNAs, showing the smallest standard deviations (3.2) in the fold change means (10.7) (Fig. 2A).
FIGURE 2.
Fold change differences between the spiked-in miRNA amounts in the three platforms for (A) mature miRNAs, (B) precursors, and (C) O-methyl 3′-modified miRNAs. In the fold change comparison headers, the numbers represent femtomole per 1 μg of total RNA. The symbol † indicates non-statistically significant fold change values (FDR). (GEO Mean) Geometric mean; (ST DEV) standard deviation.
Precursor miRNA detection
The ability of the three detection platforms to discern between mature and precursor miRNA was then evaluated. Spiked-in miRNA precursors were detected by all three platforms. As for mature and modified miRNAs, the detection was miRNA and platform specific. Less than 8% of the mature miRNA signal was detected by Agilent, and <5% by NGS, but 0.6%–73% by Affymetrix (Fig. 3B; Supplemental Table S2). Since Affymetrix arrays include probe sets that are designed to specially bind precursors, the hybridization intensity of the spiked-in precursor miRNAs with these probes was assessed. The three precursors were detected to similar degrees (Supplemental Fig. S1), which resembled those seen for detection of the mature spiked-in miRNA using mature miRNA probes. Two endogenous miRNA precursors were detected at similar levels as the highest concentrations of their spiked-in precursors hsa-mir-516a and hsa-mir-525 (data not shown).
FIGURE 3.
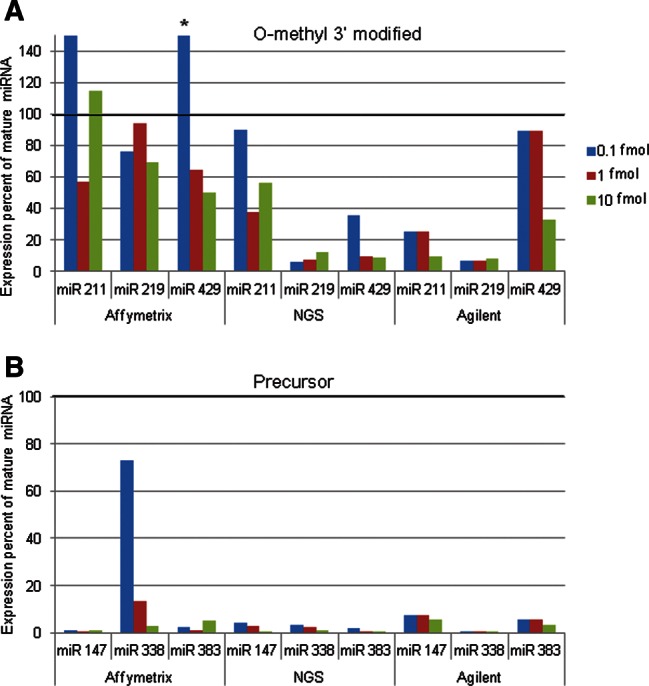
Histogram showing the detection intensity level of the spiked-in (A) O-methyl 3′-modified miRNAs and (B) precursor spiked-in miRNA, as a percentage of the mature matching spiked-in miRNA. The amounts of the spiked-in miRNAs are in femtomoles/microgram of RNA. The thick line indicates the detection intensity level of the spiked-in mature miRNA. (*) A value of 416.
The spiked-in miRNAs precursor fold changes were calculated using the mature miRNA probes. Because the intensity values were low (Supplemental Table 5), the fold changes were unreliable (Fig. 2B).
O-Methyl-modified miRNAs detection
O-Methyl is a 3′ modification known to exist in several classes of sRNAs. The ability to detect such modified miRNAs was evaluated in each platform. Ideally, modified miRNAs should be detected just as effectively as unmodified miRNAs. Thus, the hybridization intensity and the number of reads observed for spiked-in O-methyl-modified miRNAs were examined and compared to their matching spiked-in mature miRNAs. The Agilent and NGS platforms demonstrated decreased sensitivity toward O-methyl-modified miRNAs when compared with their mature miRNA counterparts, with signals as low as 6% of those measured for mature miRNA (Fig. 3A; Supplemental Table S2). This decrease seemed to be miRNA and platform specific; for example, inconsistent changes were recorded for O-methyl-modified miRNA-211, which seemingly underwent a most prominent decrease, as detected by Agilent, yet was better detected by Affymetrix than mature miRNA. Despite these inconsistencies in detection power, the linearity for serial dilutions was preserved (data not shown).
Overall, the spiked-in O-methyl-modified miRNAs’ fold change values were close to their expected values (Fig. 2C). However, in the Affymetrix platform, some of the fold change values were not statistically significant.
Comparison of endogenous mature miRNA expression
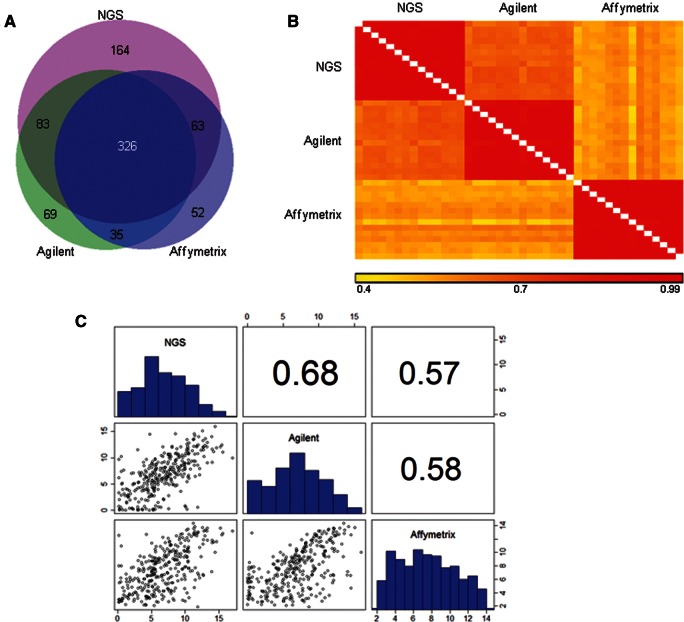
To better understand the influence of specific platforms on miRNA quantification, the reproducibility of the measured endogenous miRNA intensities, as observed by the three platforms, was evaluated. The log-normalized intensities of miRNAs above background from both the Agilent (500 different miRNAs) and Affymetrix (497 miRNAs) analyses were used, along with the log rpm values of the NGS output (640 miRNAs), which had at least five reads in at least one of the 14 libraries. This resulted in 326 overlapping miRNAs (Fig. 4A) and included the six miRNAs that were spiked in. NGS detected the largest number of miRNAs, since it is dependent on the currently available annotation database for the alignment, and not on the probes present on the microarray.
FIGURE 4.
(A) Venn diagram showing the overlap between expressed miRNAs (320 endogenous and six spiked-in miRNAs) in the three platforms. (B) Heat map representing pairwise correlations between the 14 replicates in each platform, seven technical replicates for each biological replicate. (C) Pairwise comparisons of the miRNA expression levels between the platforms. The correlations and scatterplots were performed using the geometric mean of the expression levels of the 14 replicates for each miRNA. Correlation values (above main diagonal), histograms of expression values (main diagonal), and scatterplots (below main diagonal) are shown.
The correlations between expression intensities detected by each platform for the 320 miRNAs remaining after exclusion of the spiked-in miRNAs are expected to be high, since all the samples were prepared from the same tissue. Although the Spearman correlations were high within each platform (>0.9) (Fig. 4B), there were clear differences between the three platforms. The correlation between NGS and Agilent platforms was higher than between either of them and Affymetrix. The Spearman correlation between NGS and Agilent was 0.68, 0.57 between NGS and Affymetrix, and 0.58 between Agilent and Affymetrix (Fig. 4C). The better agreement between Agilent and NGS is also demonstrated in the scatterplots.
Since each platform was normalized differently, the intensities within each platform were ranked, to allow for comparisons. A complex picture emerged when partitioning the miRNAs by K-means into clusters based on their ranked expression intensities (Fig. 5). Six clusters were identified: high signals in NGS and low signals in Agilent (cluster 10), high in NGS and low in Affymetrix (cluster 30), low in NGS and high in Agilent (cluster 11), high in Affymetrix and low in Agilent (cluster 21), high in Agilent and low in Affymetrix (cluster 20), and high in Affymetrix and low in NGS (cluster 31) (Supplemental Table 6). None of the miRNAs had similar ranking across all platforms. Since the clustering method is based on ranking, it is important to note that the distribution of the intensities and the rpm in the three platforms has a similar range and median (Fig. 4C, histograms; Supplemental Fig. S2). The differences in ranking between NGS and Agilent were smaller than the differences between either of them and Affymetrix. In all the comparisons involving Affymetrix (clusters 20, 21, 30, and 31), ∼70% of the rank differences were >50 (Supplemental Fig. S3A). A Kruskal-Wallis test was performed to examine the interplatform differences in ranking. All rank differences were found to be statistically significant (P-adjusted ≤0.022). The maximum absolute pairwise rank difference between platforms was calculated for each of the miRNAs within the clusters (Supplemental Fig. S3B).
FIGURE 5.
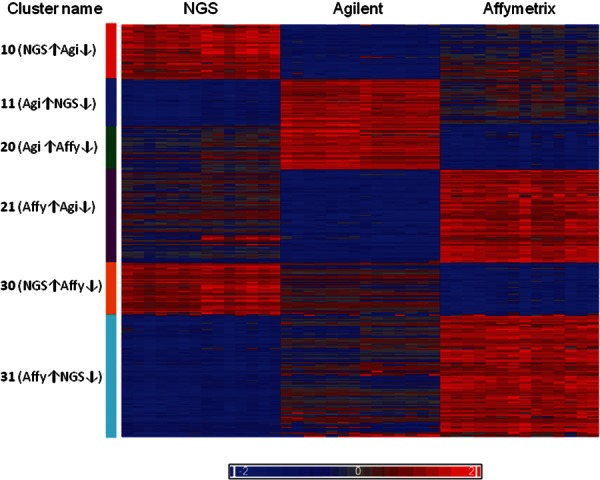
Heat map of six miRNAs clusters according to their expression level. For each miRNA, the expression values were standardized by its median. The left-most columns are NGS log rpm, the middle are Agilent log-normalized expression intensities, and the right-most columns are the normalized log expression intensity Affymetrix values. The arrows (↑↓) indicate high or low expression. (Affy) Affymetrix; (Agi) Agilent.
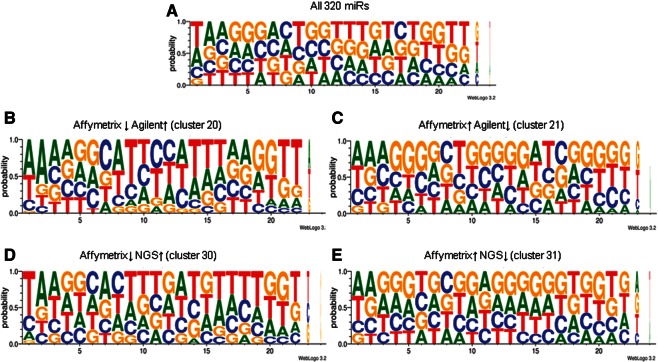
The miRNA sequences of the six clusters were used to create a sequence logo in order to assess the impact of miRNA sequence composition on the differences in gene expression ranking between the clusters. The logos show the probability of each base along the DNA sequence position, representing the endogenous miRNAs (Fig. 6). The logos revealed that miRNAs in the clusters ranked “low” by Affymetrix were rich in thymine (T) (Fig. 6B,D), while miRNAs in the clusters ranked as “high” by this same platform were rich in guanine (G) (Fig. 6C,E). The logos of the clusters were similar for NGS and Agilent platforms (data not shown). Logos were also calculated using bits, and no specific position was found to be conserved within a certain cluster (data not shown).
FIGURE 6.
Sequence logos for (A) the 320 miRNAs present in all three platforms; (B) cluster 20, low in Affymetrix and high in Agilent; (C) cluster 21, high in Affymetrix and low in Agilent; (D) cluster 30, low in Affymetrix and high in NGS; (E) cluster 31, high in Affymetrix and low in NGS. The arrows (↑↓) indicate high or low expression.
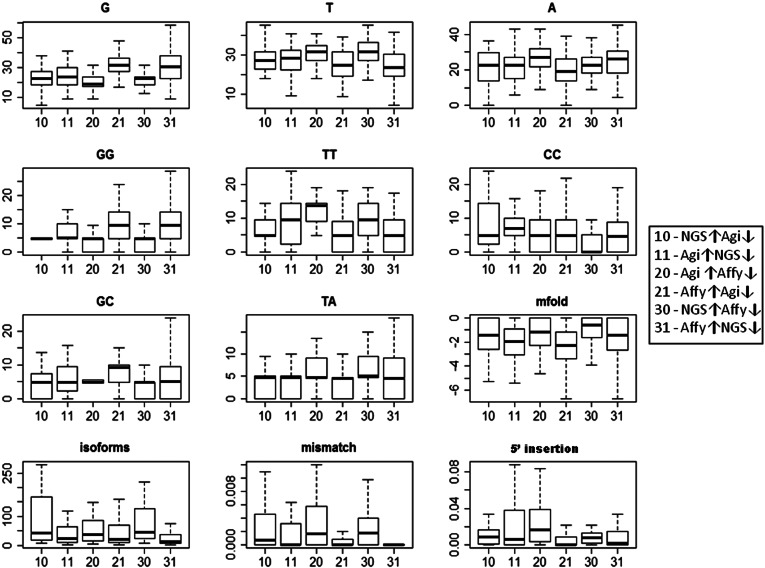
A detailed exploration of miRNA characteristics among the six clusters was performed in efforts to discriminate between the clusters. For each miRNA, attributes related to structure and composition were calculated, and attributes derived from the NGS data, i.e., number of isoforms and variations from the canonical miRNA, were collected. For a detailed list of the 32 attributes, see Materials and Methods. A Kruskal-Wallis test was performed to compare the attribute values between the clusters (Supplemental Table S3). The 12 attributes that were found to differ in at least one cluster (Fig. 7) were tested between reciprocal clusters, such as high in NGS and low in Affymetrix, low in NGS and high in Affymetrix (Supplemental Table S4). Ten attributes (G, T, A, GG, TT, GC, TA, mfold, mismatches, and 5′ insertions) were significantly different between Agilent and Affymetrix, nine of which overlapped with the NGS and Affymetrix comparison. The 5′-insertions attribute did not differ between NGS and Affymetrix; however, the number of isoforms did. Only three attributes differed between NGS and Agilent cluster readings: GG, TT, and the number of isoforms.
FIGURE 7.
Boxplots of the 12 attributes that were found to be significantly different in pairwise comparisons between the clusters. The x-axis shows the clusters. The y-axis shows the attribute values (for more details, see Supplemental Table S6). The arrows (↑↓) indicate high or low expression. (Affy) Affymetrix; (Agi) Agilent.
Multinomial logistic regression model
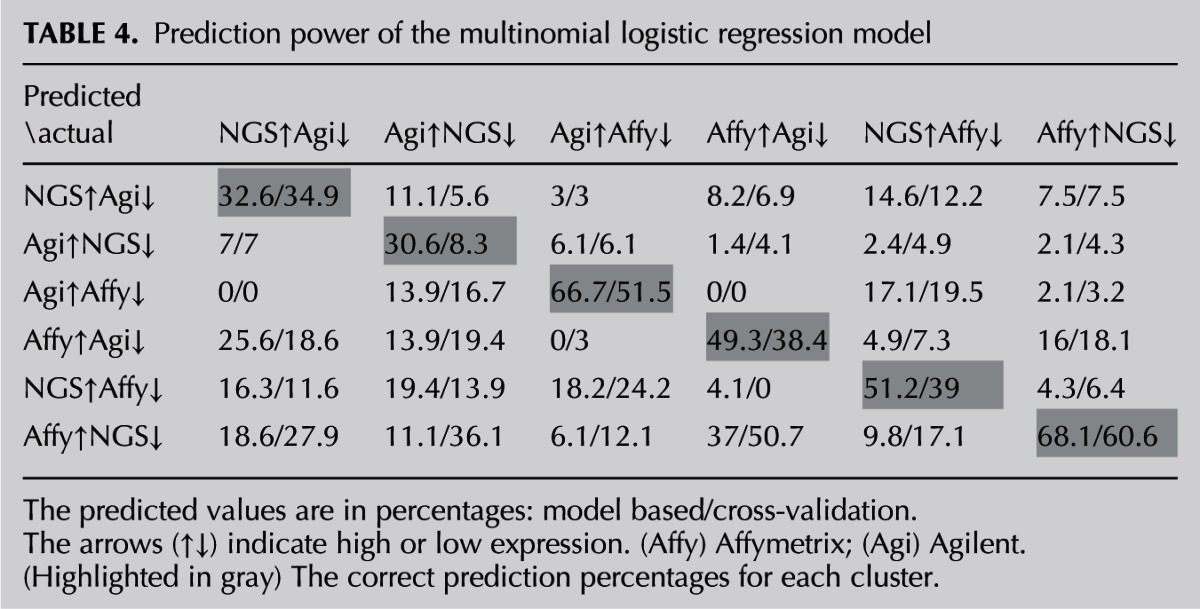
The 12 attributes that were significantly different in at least one cluster were used to build a model explaining intercluster differences. A multinomial logistic regression was then performed. The log of the number of isoforms was used to build the model to obtain a more balanced distribution. Ten attributes were found to be significant in the model and can be applied to predict the miRNA cluster: percentages of single G, A, and T bases and CC, TT, and GC dimers, as well as the mfold, log of the number of isoforms, and the weighted means of mismatches and 5′ insertions (Tables 2, 3). Table 4 demonstrates that the clusters for >50% of the miRNA population (predicted average of the correct cluster), spanning from 30.6% for “high in Agilent—low in NGS” to 68.1% for “high in Affymetrix—low in NGS,” were correctly predicted. It was difficult to distinguish between the reciprocal NGS–Agilent clusters, as well as between the two clusters in which Affymetrix ranking was either high or low. In a random situation, when each cluster has the same probability, 17% accuracy (100% divided by six clusters) in cluster prediction would be expected. Random prediction of the clusters can be performed by calculating their probability according to the cluster abundance. Using this method, probability of the most abundant cluster, “high in Affymetrix—low in NGS,” comprising 94 miRNAs, would result in 29% accuracy. In addition, a model validation was performed by leave-ten-out cross-validation, which yielded a pattern similar to the original model, with an average accuracy of 42% (Table 4).
TABLE 2.
Model effects
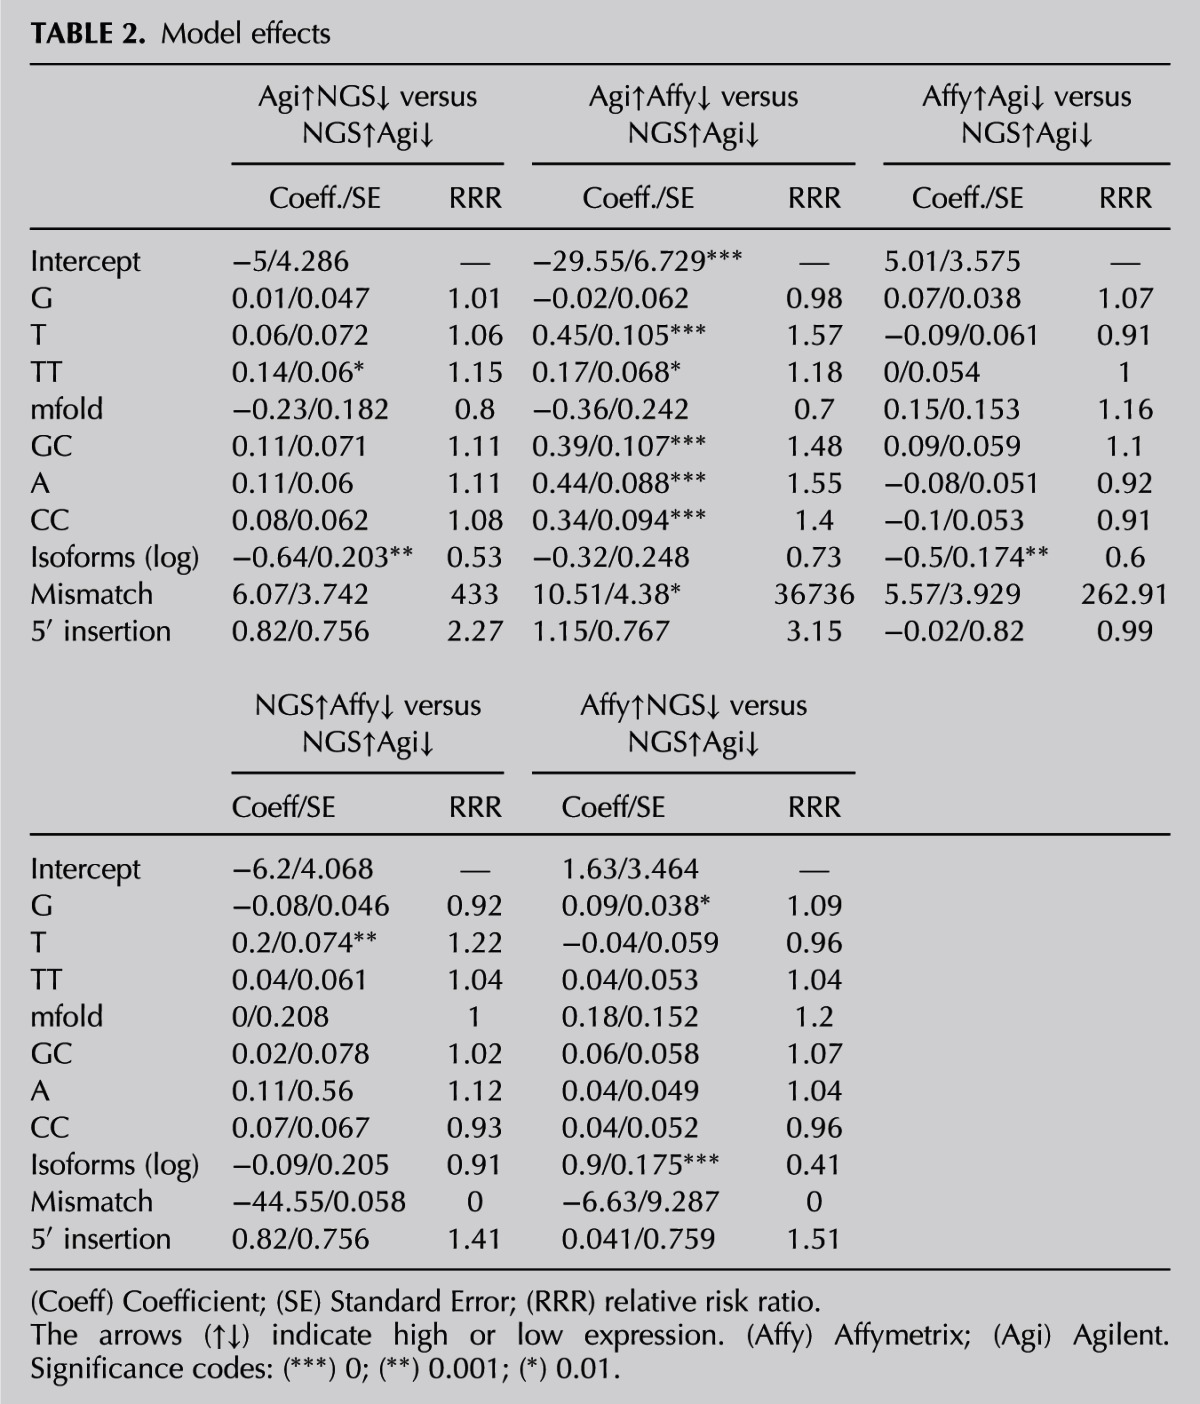
TABLE 3.
Analysis of deviance table (type II tests)
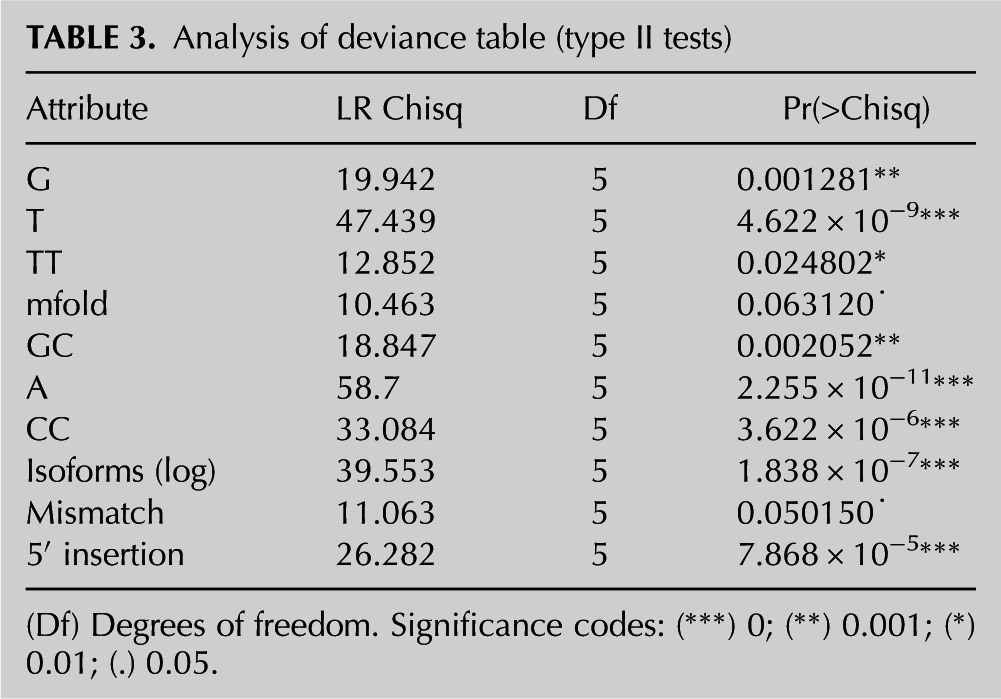
TABLE 4.
Prediction power of the multinomial logistic regression model
DISCUSSION
miRNAs have essential roles in gene expression regulation and have been proposed to serve as diagnostic or prognostic biomarkers in human diseases including cancer, and therefore it is critical to quantify them correctly (Hui et al. 2011). Previous studies have demonstrated differences and biases between various microarray platforms and between microarray platforms and NGS in their ability to determine miRNA expression profiles (Fahlgren et al. 2009; Willenbrock et al. 2009; Baker 2010; Git et al. 2010; Pradervand et al. 2010; Sah et al. 2010). Although biases in miRNA detection were previously described, here we investigated the end-point result (detection intensity) of these biases in a controlled fashion on multiple commercial platforms using the most recent protocols. Furthermore, Affymetrix miRNA 2.0 array and Illumina HiSeq 2000 have not yet been fully evaluated by others for miRNA expression. This study focused on comparative quantification of more than 300 endogenously expressed miRNAs, and explored a large number of attributes (32) that could explain the differences in platform performance using a statistical model, allowing us to focus on the 12 most significant attributes. In addition, this study evaluated miRNA quantification using synthetic spiked-in mature, O-methyl-modified, and precursor miRNA across the three platforms. To the best of our knowledge, this is the first study in which spiked-in modified and precursor miRNAs were used to compare platform performance.
Significant differences in the ability to quantify mature spiked-in miRNAs introduced at the same concentration were observed between platforms; up to 500-fold in Affymetrix, 10-fold in NGS, and fivefold in Agilent. Agilent was found to be the most accurate, as established by the tight distribution of intensities detected for the six spiked-in mature miRNAs. The highest-ranked spiked-in mature miRNA was different in each platform. This, together with the Agilent platform performance, indicates that the differences observed were not due to technical problems in sample and mix preparations. These results stand in agreement with previous studies showing that the Agilent platform performs better than other microarray platforms and than NGS (Git et al. 2010; Sah et al. 2010). The analysis of mature spiked-in miRNAs indicates that in all platforms, including NGS, the signal intensity does not directly infer the absolute amount of miRNA, and therefore only relative abundance studies are reliable with these platforms.
In all platforms, there was a strong correlation between the amount of introduced mature spiked-in miRNA and its detected signal. Agilent was most accurate in revealing the 10-fold change in introduced miRNA concentration. The ability to detect a relative fold change of 10 was shown to be dependent on the platform, the specific miRNA, and on its quantity. Usually, when determining differential expression between samples, one selects statistically significant changes with a fold change of 1.5 or more (Liu et al. 2012; Sokolov et al. 2012). The present findings imply that the tested technologies are not sufficiently sensitive to detect concentration differences within the range and the number of replicates typically used for determining statistical differences in expression; further validation methods would be required.
Interplatform miRNA quantification signal discrepancies can stem from laboratory procedures, array design and manufacturing, detection hardware, intensity signal extraction algorithms, and further bioinformatics analysis. We assume that the major factors responsible for the observed differences are both the enzymatic reactions and an amplification step carried out during sample preparation, as well as microarray probe design. Microarray platforms are not expected to indicate absolute concentrations of miRNAs because of differences in hybridization strength, cross-hybridization, short miRNA length, and oftentimes inability to design complementary microarray probes. It has been shown that NGS suffers from base composition biases (Hansen et al. 2010; Aird et al. 2011), an effect observed in the present study as well. RNA sample integrity, as well as the precision of the miRNA band gel extraction during the library preparation for NGS, can influence miRNA detection and can lead to detection of precursor as if it were a mature miRNA.
Precursor miRNAs are expressed in and can be detected under various biological conditions. Agilent and NGS were not expected to detect precursor miRNAs and, indeed, the amount of spiked-in precursor miRNA that was detected as if it were mature was fairly low. However, at high concentrations, precursor miRNA can be erroneously detected as mature. Spiked-in precursor miRNAs that are not endogenously expressed were detected on the Affymetrix array by both mature and precursor miRNA probe sets, as expected. When a signal is detected as both mature and precursor, determining the correct ratio between the two is not trivial, and proper algorithms should be developed. O-Methyl modification results in a lack of change in signal detection efficacy to a dramatic drop in signal, down to 6% of signals measured for corresponding mature miRNA. This observation implies that miRNAs with this modification, including plant miRNA, piRNA, and siRNA, cannot be accurately quantified using these platforms. Further research and protocol development will be required to enable accurate detection of miRNAs with this modification.
Analysis of the endogenous, non-spiked miRNAs revealed a stronger agreement in detection of mature miRNA between the Agilent and NGS platforms than between either of them and Affymetrix. miRNA clustering revealed that all miRNAs are detected differently in at least two out of the three platforms. The accumulated data suggest that the Affymetrix array suffers from an over-representation of guanine-rich miRNAs and from an under-representation of uracil-rich miRNAs. This bias might be corrected by a normalization procedure that account for the guanine and uracil content of the miRNA. However, for this purpose, the probes sequence information should be public. Availability of probe sequence information would be most beneficial for the suggested correction; however, to date, no such data are being shared.
NGS analysis of the miRNA sequences showed that, in addition to the defined miRNA sequence, variants of the sequence (isoforms) exist, as previously described by others (Morin et al. 2008; Ebhardt et al. 2010; Lee et al. 2010). Therefore, signal detection of a certain miRNA might be misleading due to the existence of miRNAs families and miRNA isoforms. These miRNA variants were identified here by NGS using analyses that retain the sequence information along with its variants, and not merely quantify the canonical mature miRNA. The microarray platforms are designed to detect the canonical miRNA, and therefore it is not clear how well they can detect all isoforms and distinguish between members of miRNA families. Since different isoforms might have different targets (Yang et al. 2006; Seitz et al. 2008), the ability to distinguish between them is of functional relevance. Therefore, microarray platforms must be improved by adding probes matching isoform sequences.
Analyses weighing the attributes that influence the difference in ranking among the platforms demonstrated that the Affymetrix platform had a lower sensitivity, compared with the other two platforms, for those miRNAs that have more isoforms, mismatches, and 5′ insertions. These sample attributes are in addition to the previously discussed base composition biases (Supplemental Table S4). Agilent was more permissive to mismatches and 5′ insertions than Affymetrix. This can be explained by the Agilent probe design that connects the probe to the glass surface by a linker (Wang et al. 2007). The linker is suggested to tolerate hybridization, even when the miRNA has a 5′ tail that does not hybridize to the probe. The Agilent probes also include a hairpin structure and an additional guanine that matches a cytosine added to the 3′ of the miRNA during the labeling procedure. Both probably stabilize miRNA binding and may allow for reasonable hybridization of diverse miRNA isoforms. NGS does not depend on existing probes and features a clear advantage in isoforms detection over microarray platforms. We suggest that in the analysis of the spiked-in miRNA, Affymetrix had a lower performance due to the probe design rather than the end labeling and lack of PCR amplification, which are similar to Agilent laboratory procedures. Biases in NGS might be influenced by the amplification performed in the library preparation. Yet, due to the large number of factors involved in the laboratory procedure until the final read out, further research is required to determine the contribution of each factor.
The model described here explaining the differences between the miRNA clusters can successfully predict the cluster for 50% of the miRNAs. We suggest further using the defined attributes, as well as additional ones, to correct the technologies’ biases and to allow more accurate quantification, as was done for mRNA (Roberts et al. 2011; Hansen et al. 2012).
MATERIALS AND METHODS
Generation of pooled samples
Short RNA oligos with and without 3′-O-methyl modification were purchased from IDT, at a 100 nM scale, and desalted. Long RNA oligos were purchased from Metabion at 200 nM scale and HPLC-purified. Oligos were diluted to 50, 5, and 0.5 fmol/μL and mixed with 5 μg of human placenta RNA (Ambion #AM7950) according to Table 1, generating six mixes (mix 1–6) and a control sample (mix 7) of native RNA without any spiked-in oligos. All dilutions were prepared in duplicate, and each was mixed with separate batches of placenta RNA to generate a biological replicate. All mixes were prepared once and used for all platforms.
Agilent miRNA microarray labeling and hybridization
Each RNA mix (100 ng) was labeled using miRNA complete labeling and the Hyb Kit (Agilent, 5190-0456), following the manufacturer’s instructions. Briefly, RNA was dephosphorylated, labeled with Cy3-pCp, and desalted using Micro Bio-Spin columns. Labeled RNA was hybridized with an 8 × 15 Human miRNA array rel 14 v2 (design number 29297) at 55°C and 20 rpm for 20 h, and then washed according to the manufacturer’s instructions. Scanning was performed on an Agilent Scanner using 5 μM resolution.
Affymetrix miRNA microarray labeling and hybridization and data preprocessing
Each RNA mix (500 ng) was labeled using the Flashtag RNA labeling kit (Genisphere, HSR10FTA) according to the manufacturer’s instructions. Briefly, RNA underwent a poly(A) tailing reaction using 2.5 mM MnCl2, ATP, and poly(A) polymerase, followed by ligation of the biotinylated 3DNA signal molecule to the RNA sample. Each sample was hybridized to a GeneChip miRNA 2.0 Array (Affymetrix) at 48°C and 60 rpm for 16 h, then washed and stained on Fluidics Station 450 (Fluidics script FS450_0003) and scanned on a GeneChip Scanner 3000 7G (Affymetrix).
Illumina miRNA library construction and sequencing
Small RNA library construction from 5 μg of total RNA of each of the 14 samples was carried out using the Illumina TruSeq smRNA Sample Prep Kit, according to the manufacturer’s instructions. Briefly, a 3′ adapter was ligated to total RNA using RNL2, followed by 5′-adapter ligation, using T4 ligase. Reverse transcription with SuperScript II generated cDNA, which was PCR-amplified and size-selected on a gel and then purified. Sequencing was performed on two lanes of HiSeq 2000 using v2 clustering and sequencing reagents; seven libraries were multiplexed on each lane. The sequencing was run using RTA 1.12.4.2 and analyzed by CASAVA-1.8.1.14, resulting in 227.5 million passed filter single reads (11–21 million reads per library), with a length of 50 bases.
Microarray gene expression data analysis
Statistical analysis of microarray data was performed using the Partek Genomics Suite software (Partek Inc.). Affymetrix CEL files (containing raw expression measurements) were imported in to the Affymetrix miRNA QC tool and normalized using default parameters. miRNAs showing normalized intensities under the value of 3 were considered not to be expressed. GeneView.txt files obtained from Agilent Feature Extraction Software 10.7.3.1 were used for data analysis of the Agilent platform. First, the intensity of each miRNA signal was set as the maximum of either “TotalGeneSignal” or the “TotalGeneError.” Then, the signal intensities were log2-transformed and scaled by quantile normalization. Only miRNAs that were detected according to the value in the GeneView.txt file column “IsGeneDetected” were analyzed downstream. For each of the platforms, the normalized data were explored by Principal Component Analysis (PCA) and hierarchical clustering to detect batch effects, which were corrected for using the software defaults. To identify differentially expressed genes, One-Way ANOVA was applied. Contrasts were calculated between the different mixes. The false discovery rate (FDR) was used to correct for multiple comparisons (Benjamini and Hochberg 1995).
Bioinformatics analysis of small-RNA NGS data
For each library, sequences were collapsed into tags and quantified using a UNIX command (egrep ‘(A|T|G|C|N){50}’ fastq_file|sort|uniq -c|sort -nr). Tags were converted to a FASTA file along with the frequency number. Perl scripts and the crossmatch tool (cross_ match -minmatch 10 -minscore 10 -screen; http://www.phrap.org/) were used to screen and clip the adaptor sequence (TGGAATTCTCGGGTGCCAAGGAACTCCAGTCACnnnnnnATCTCGTATGCCGTCTTCTGCTTG) and then to update tag frequencies. Tags that appeared at a frequency of five or more reads per library (about 90,000 tags) were normalized to reads per million (rpm). The tags were annotated using the best hit of BLAST 2.2.23 (-S -e 0.01 options) (Altschul et al. 1990) and run against human mature or stem–loop miRNA databases (downloaded from mirbase.org, release 18). The frequency of reads matching each miRNA was calculated by summing the frequency of all the isoforms matching the miRNA. Differential expression was calculated using the DESeq R package (Anders and Huber 2010) from Bioconductor (http://bioconductor.org/packages/release/bioc/html/DESeq.html).
Comparison of endogenous mature miRNAs across the three platforms
The normalized log intensity values of mature miRNA probes that were above background level in the microarray platforms were combined with the log rpm of the mature miRNA from the NGS analysis. This resulted in 326 miRNAs detected in all three platforms, including the six spiked-in miRNAs. A Venn diagram was made using the applet http://www.cs.kent.ac.uk/people/staff/pjr/EulerVennCircles/EulerVennApplet.html. A Spearman correlation matrix for all pairwise comparisons was calculated with Partek. In addition, for each platform, the log of the geometric mean for all 14 replicates was calculated, and Spearman correlations of the means were calculated using the R language. The 320 unspiked miRNAs were partitioned by K-means into six clusters using ranked Spearman dissimilarity (Partek).
We ranked 320 miRNA expression intensities of each replicate within the platforms (14 replicates × 3 platforms), and then the Kruskal-Wallis (KW) test was applied for each gene to compare the gene ranking between the platforms. FDR adjustments were applied on the P-values (Benjamini and Hochberg 1995).
Sequence logos were calculated using WebLogo (http://weblogo.threeplusone.com/create.cgi), with no compositional adjustment. All miRNAs were extended at the 3′ end with N’s in order to have an even number of bases. The sequence logo was calculated in bits, and we followed the method as previously described (D’haeseleer 2006). The background frequencies used for the normalization were extracted from the 320 relevant miRNAs.
For each miRNA, the 32 attributes were calculated, including the percent of single bases and all possible dimers (calculated using an in-house Perl script), the canonical miRNA (the one that appears in mirbase) length, the number of isoforms per miRNA, the median (of the 14 replicates) of the canonical miRNA fraction out of the total sample number of miRNA counts, and the weighted means of the number of mismatches, indels, and 5′ and 3′ deletions or insertions in comparison to the canonical miRNA. The number of isoforms and the weighted means were calculated according to the NGS results. The mature miRNAs’ fold energy was calculated using the Quikfold tool (http://mfold.rna.albany.edu) (Zuker 2003). The attribute values for each miRNA are shown in Supplemental Table 6. Attribute values were compared between clusters, by using the Kruskal-Wallis rank-sum test. P-values were adjusted by FDR. The significant attributes were further analyzed using the pairwise Wilcoxon rank-sum test.
Building the multinomial logistic regression model
A multinomial logistic regression model was designed to explain why each miRNA belongs to a certain cluster using the attributes found to be significant in the previous analysis. Because the outcome to be explained is a multinomial variable, a multinomial logistic regression model was fitted. The final model was achieved by using the backward elimination procedure. The model was built using the nnet R package (Venables and Ripley 2002).
The multinomial logistic regression is a generalization of the logistic regression for the case of J clusters (J > 2). The multinomial logistic model, as described by Agresti (2010), has the form:
 |
where πj(x) = P(Y = j|x) is the probability that the response belongs to the j-th cluster given the value of the explanatory values. These J − 1 equations determine parameters for logits with other pairs of response clusters, since
 |
The equations that express the multinomial model directly in terms of response probabilities πj(x) is:
 |
with αJ = βJ = 0.
The model validation was carried out using the leave-ten-out cross-validation.
DATA DEPOSITION
The Affymetrix, Agilent, and NGS data are available at NCBI’s Gene Expression Omnibus (GEO) (http://www.ncbi.nlm.nih.gov/geo/) under accession number GSE40820.
SUPPLEMENTAL MATERIAL
Supplemental material is available for this article.
Supplementary Material
ACKNOWLEDGMENTS
We thank Dr. Hershel Safer and Dr. Yael Maoz for critical reading of the manuscript, Professor Avraham Levy for fruitful discussions, and Irit Orr for running CASAVA. This project was supported by a grant from Weizmann–Staff Scientists Internal Grant Program.
REFERENCES
- Agresti A 2010. Analysis of ordinal categorical data. Wiley, New York [Google Scholar]
- Aird D, Ross MG, Chen WS, Danielsson M, Fennell T, Russ C, Jaffe DB, Nusbaum C, Gnirke A 2011. Analyzing and minimizing PCR amplification bias in Illumina sequencing libraries. Genome Biol 12: R18. [DOI] [PMC free article] [PubMed] [Google Scholar]
- Altschul SF, Gish W, Miller W, Myers EW, Lipman DJ 1990. Basic local alignment search tool. J Mol Biol 215: 403–410 [DOI] [PubMed] [Google Scholar]
- Anders S, Huber W 2010. Differential expression analysis for sequence count data. Genome Biol 11: R106. [DOI] [PMC free article] [PubMed] [Google Scholar]
- Baker M 2010. MicroRNA profiling: Separating signal from noise. Nat Methods 7: 687–692 [DOI] [PubMed] [Google Scholar]
- Benjamini Y, Hochberg Y 1995. Controlling the false discovery rate: A practical and powerful approach to multiple testing. J R Stat Soc Series B Methodol 57: 289–300 [Google Scholar]
- Bissels U, Wild S, Tomiuk S, Holste A, Hafner M, Tuschl T, Bosio A 2009. Absolute quantification of microRNAs by using a universal reference. RNA 15: 2375–2384 [DOI] [PMC free article] [PubMed] [Google Scholar]
- Bourc’his D, Voinnet O 2010. A small-RNA perspective on gametogenesis, fertilization, and early zygotic development. Science 330: 617–622 [DOI] [PubMed] [Google Scholar]
- Chang TC, Mendell JT 2007. microRNAs in vertebrate physiology and human disease. Annu Rev Genomics Hum Genet 8: 215–239 [DOI] [PubMed] [Google Scholar]
- Chugh P, Dittmer DP 2012. Potential pitfalls in microRNA profiling. Wiley Interdiscip Rev RNA 3: 601–616 [DOI] [PMC free article] [PubMed] [Google Scholar]
- D’haeseleer P 2006. What are DNA sequence motifs? Nat Biotechnol 24: 423–425 [DOI] [PubMed] [Google Scholar]
- Ebhardt HA, Thi EP, Wang MB, Unrau PJ 2005. Extensive 3′ modification of plant small RNAs is modulated by helper component-proteinase expression. Proc Natl Acad Sci 102: 13398–13403 [DOI] [PMC free article] [PubMed] [Google Scholar]
- Ebhardt HA, Fedynak A, Fahlman RP 2010. Naturally occurring variations in sequence length creates microRNA isoforms that differ in Argonaute effector complex specificity. Silence 1: 12. [DOI] [PMC free article] [PubMed] [Google Scholar]
- Esteller M 2011. Non-coding RNAs in human disease. Nat Rev Genet 12: 861–874 [DOI] [PubMed] [Google Scholar]
- Fahlgren N, Sullivan CM, Kasschau KD, Chapman EJ, Cumbie JS, Montgomery TA, Gilbert SD, Dasenko M, Backman TW, Givan SA, et al. 2009. Computational and analytical framework for small RNA profiling by high-throughput sequencing. RNA 15: 992–1002 [DOI] [PMC free article] [PubMed] [Google Scholar]
- Fox S, Filichkin S, Mockler TC 2009. Applications of ultra-high-throughput sequencing. Methods Mol Biol 553: 79–108 [DOI] [PubMed] [Google Scholar]
- Ghildiyal M, Zamore PD 2009. Small silencing RNAs: An expanding universe. Nat Rev Genet 10: 94–108 [DOI] [PMC free article] [PubMed] [Google Scholar]
- Git A, Dvinge H, Salmon-Divon M, Osborne M, Kutter C, Hadfield J, Bertone P, Caldas C 2010. Systematic comparison of microarray profiling, real-time PCR, and next-generation sequencing technologies for measuring differential microRNA expression. RNA 16: 991–1006 [DOI] [PMC free article] [PubMed] [Google Scholar]
- Hafner M, Renwick N, Brown M, Mihailović A, Holoch D, Lin C, Pena JT, Nusbaum JD, Morozov P, Ludwig J, et al. 2011. RNA-ligase-dependent biases in miRNA representation in deep-sequenced small RNA cDNA libraries. RNA 17: 1697–1712 [DOI] [PMC free article] [PubMed] [Google Scholar]
- Hansen KD, Brenner SE, Dudoit S 2010. Biases in Illumina transcriptome sequencing caused by random hexamer priming. Nucleic Acids Res 38: e131. [DOI] [PMC free article] [PubMed] [Google Scholar]
- Hansen KD, Irizarry RA, Wu Z 2012. Removing technical variability in RNA-seq data using conditional quantile normalization. Biostatistics 13: 204–216 [DOI] [PMC free article] [PubMed] [Google Scholar]
- Hui A, How C, Ito E, Liu FF 2011. Micro-RNAs as diagnostic or prognostic markers in human epithelial malignancies. BMC Cancer 11: 500. [DOI] [PMC free article] [PubMed] [Google Scholar]
- Karginov FV, Hannon GJ 2010. The CRISPR system: Small RNA-guided defense in bacteria and archaea. Mol Cell 37: 7–19 [DOI] [PMC free article] [PubMed] [Google Scholar]
- Lee LW, Zhang S, Etheridge A, Ma L, Martin D, Galas D, Wang K 2010. Complexity of the microRNA repertoire revealed by next-generation sequencing. RNA 16: 2170–2180 [DOI] [PMC free article] [PubMed] [Google Scholar]
- Lejeune E, Allshire RC 2011. Common ground: Small RNA programming and chromatin modifications. Curr Opin Cell Biol 23: 258–265 [DOI] [PubMed] [Google Scholar]
- Li S, Liang Z, Xu L, Zou F 2012. MicroRNA-21: A ubiquitously expressed pro-survival factor in cancer and other diseases. Mol Cell Biochem 360: 147–158 [DOI] [PubMed] [Google Scholar]
- Linsen SE, de Wit E, Janssens G, Heater S, Chapman L, Parkin RK, Fritz B, Wyman SK, de Bruijn E, Voest EE, et al. 2009. Limitations and possibilities of small RNA digital gene expression profiling. Nat Methods 6: 474–476 [DOI] [PubMed] [Google Scholar]
- Liu T, Cheng W, Gao Y, Wang H, Liu Z 2012. Microarray analysis of microRNA expression patterns in the semen of infertile men with semen abnormalities. Mol Med Report 6: 535–542 [DOI] [PubMed] [Google Scholar]
- Morin RD, O’Connor MD, Griffith M, Kuchenbauer F, Delaney A, Prabhu AL, Zhao Y, McDonald H, Zeng T, Hirst M, et al. 2008. Application of massively parallel sequencing to microRNA profiling and discovery in human embryonic stem cells. Genome Res 18: 610–621 [DOI] [PMC free article] [PubMed] [Google Scholar]
- Munafó DB, Robb GB 2010. Optimization of enzymatic reaction conditions for generating representative pools of cDNA from small RNA. RNA 16: 2537–2552 [DOI] [PMC free article] [PubMed] [Google Scholar]
- O’Hara AJ, Chugh P, Wang L, Netto EM, Luz E, Harrington WJ, Dezube BJ, Damania B, Dittmer DP 2009. Pre-micro RNA signatures delineate stages of endothelial cell transformation in Kaposi sarcoma. PLoS Pathog 5: e1000389. [DOI] [PMC free article] [PubMed] [Google Scholar]
- Pradervand S, Weber J, Lemoine F, Consales F, Paillusson A, Dupasquier M, Thomas J, Richter H, Kaessmann H, Beaudoing E, et al. 2010. Concordance among digital gene expression, microarrays, and qPCR when measuring differential expression of microRNAs. BioTechniques 48: 219–222 [DOI] [PubMed] [Google Scholar]
- Pritchard CC, Cheng HH, Tewari M 2012. MicroRNA profiling: Approaches and considerations. Nat Rev Genet 13: 358–369 [DOI] [PMC free article] [PubMed] [Google Scholar]
- Roberts A, Trapnell C, Donaghey J, Rinn JL, Pachter L 2011. Improving RNA-Seq expression estimates by correcting for fragment bias. Genome Biol 12: R22. [DOI] [PMC free article] [PubMed] [Google Scholar]
- Sah S, McCall MN, Eveleigh D, Wilson M, Irizarry RA 2010. Performance evaluation of commercial miRNA expression array platforms. BMC Res Notes 3: 80. [DOI] [PMC free article] [PubMed] [Google Scholar]
- Schmittgen TD, Lee EJ, Jiang J 2008. High-throughput real-time PCR. Methods Mol Biol 429: 89–98 [DOI] [PubMed] [Google Scholar]
- Schöler N, Langer C, Döhner H, Buske C, Kuchenbauer F 2010. Serum microRNAs as a novel class of biomarkers: A comprehensive review of the literature. Exp Hematol 38: 1126–1130 [DOI] [PubMed] [Google Scholar]
- Seitz H, Ghildiyal M, Zamore PD 2008. Argonaute loading improves the 5′ precision of both microRNAs and their miRNA* strands in flies. Curr Biol 18: 147–151 [DOI] [PMC free article] [PubMed] [Google Scholar]
- Shi R, Chiang VL 2005. Facile means for quantifying microRNA expression by real-time PCR. BioTechniques 39: 519–525 [DOI] [PubMed] [Google Scholar]
- Simon SA, Meyers BC 2011. Small RNA-mediated epigenetic modifications in plants. Curr Opin Plant Biol 14: 148–155 [DOI] [PubMed] [Google Scholar]
- Sokolov MV, Panyutin IV, Neumann RD 2012. Unraveling the global microRNAome responses to ionizing radiation in human embryonic stem cells. PLoS ONE 7: e31028. [DOI] [PMC free article] [PubMed] [Google Scholar]
- Tian G, Yin X, Luo H, Xu X, Bolund L, Zhang X, Gan SQ, Li N 2010. Sequencing bias: Comparison of different protocols of microRNA library construction. BMC Biotechnol 10: 64. [DOI] [PMC free article] [PubMed] [Google Scholar]
- Van Nieuwerburgh F, Soetaert S, Podshivalova K, Ay-Lin Wang E, Schaffer L, Deforce D, Salomon DR, Head SR, Ordoukhanian P 2011. Quantitative bias in Illumina TruSeq and a novel post amplification barcoding strategy for multiplexed DNA and small RNA deep sequencing. PLoS ONE 6: e26969. [DOI] [PMC free article] [PubMed] [Google Scholar]
- Venables WN, Ripley BD 2002. Modern applied statistics with S, 4th ed Springer, New York [Google Scholar]
- Wang H, Ach RA, Curry B 2007. Direct and sensitive miRNA profiling from low-input total RNA. RNA 13: 151–159 [DOI] [PMC free article] [PubMed] [Google Scholar]
- Willenbrock H, Salomon J, Søkilde R, Barken KB, Hansen TN, Nielsen FC, Møller S, Litman T 2009. Quantitative miRNA expression analysis: Comparing microarrays with next-generation sequencing. RNA 15: 2028–2034 [DOI] [PMC free article] [PubMed] [Google Scholar]
- Yang W, Chendrimada TP, Wang Q, Higuchi M, Seeburg PH, Shiekhattar R, Nishikura K 2006. Modulation of microRNA processing and expression through RNA editing by ADAR deaminases. Nat Struct Mol Biol 13: 13–21 [DOI] [PMC free article] [PubMed] [Google Scholar]
- Yin JQ, Zhao RC, Morris KV 2008. Profiling microRNA expression with microarrays. Trends Biotechnol 26: 70–76 [DOI] [PubMed] [Google Scholar]
- Zhang C 2009. Novel functions for small RNA molecules. Curr Opin Mol Ther 11: 641–651 [PMC free article] [PubMed] [Google Scholar]
- Zuker M 2003. Mfold web server for nucleic acid folding and hybridization prediction. Nucleic Acids Res 31: 3406–3415 [DOI] [PMC free article] [PubMed] [Google Scholar]
Associated Data
This section collects any data citations, data availability statements, or supplementary materials included in this article.


