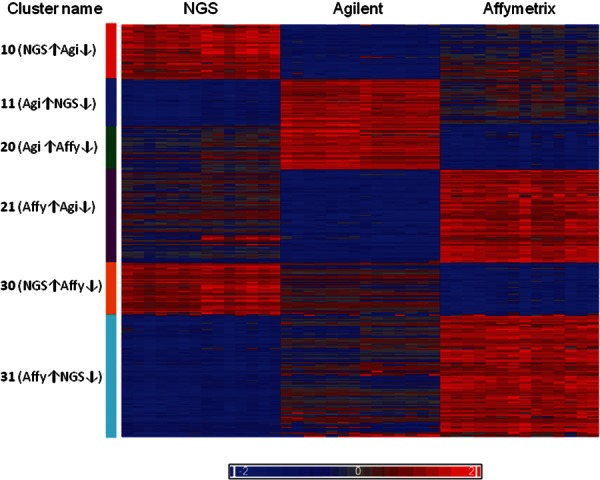
FIGURE 5.

Heat map of six miRNAs clusters according to their expression level. For each miRNA, the expression values were standardized by its median. The left-most columns are NGS log rpm, the middle are Agilent log-normalized expression intensities, and the right-most columns are the normalized log expression intensity Affymetrix values. The arrows (↑↓) indicate high or low expression. (Affy) Affymetrix; (Agi) Agilent.
