

Using bioinformatics approaches and high-throughput transcriptomic data of ADAR knockdown cells, we globally examined how ADAR and its A-to-I RNA editing activity influence alternative mRNA splicing. Our global analysis reveals that ADAR plays a major role in splicing regulation. Editing sites are enriched in alternatively spliced exons and splicing regulatory elements, but the primary mechanism for ADAR-mediated regulation of alternative splicing is modulation of trans-acting factors involved in the splicing machinery.
Keywords: RNA editing, alternative splicing, all exon microarray, ADAR, RNA-seq, massively parallel sequencing (MPS)
Abstract
Alternative mRNA splicing is a major mechanism for gene regulation and transcriptome diversity. Despite the extent of the phenomenon, the regulation and specificity of the splicing machinery are only partially understood. Adenosine-to-inosine (A-to-I) RNA editing of pre-mRNA by ADAR enzymes has been linked to splicing regulation in several cases. Here we used bioinformatics approaches, RNA-seq and exon-specific microarray of ADAR knockdown cells to globally examine how ADAR and its A-to-I RNA editing activity influence alternative mRNA splicing. Although A-to-I RNA editing only rarely targets canonical splicing acceptor, donor, and branch sites, it was found to affect splicing regulatory elements (SREs) within exons. Cassette exons were found to be significantly enriched with A-to-I RNA editing sites compared with constitutive exons. RNA-seq and exon-specific microarray revealed that ADAR knockdown in hepatocarcinoma and myelogenous leukemia cell lines leads to global changes in gene expression, with hundreds of genes changing their splicing patterns in both cell lines. This global change in splicing pattern cannot be explained by putative editing sites alone. Genes showing significant changes in their splicing pattern are frequently involved in RNA processing and splicing activity. Analysis of recently published RNA-seq data from glioblastoma cell lines showed similar results. Our global analysis reveals that ADAR plays a major role in splicing regulation. Although direct editing of the splicing motifs does occur, we suggest it is not likely to be the primary mechanism for ADAR-mediated regulation of alternative splicing. Rather, this regulation is achieved by modulating trans-acting factors involved in the splicing machinery.
INTRODUCTION
Pre-mRNA splicing, carried out by the spliceosome, is a complex process that occurs in eukaryotic cells (Wahl et al. 2009; Valadkhan and Jaladat 2010). Fundamental sequence motifs required for canonical splicing are the 5′ splice site (5′ ss), branch site (BS), poly-pyrimidine-tract (PPT), and the 3′ splice site (3′ ss). Without these motifs, the spliceosome subunits cannot bind together into a single functional catalytic unit, and alterations in these sequences have been linked to alternative splicing (Wahl et al. 2009; Valadkhan and Jaladat 2010). Alternative splicing (AS) has a major contribution to transcriptome diversity in higher organisms. It was recently suggested that in humans, more than 90% of multi-exon genes undergo AS (Licatalosi and Darnell 2010). Several types of AS have been described (Ast 2004) including exons found in certain transcripts and skipped in others (cassette exons), introns retained in the mature-mRNA (intron retention), and alternative 5′ or 3′ ss. AS is often a tissue-specific and developmental stage-dependent process, where some splicing factors are expressed only in specific tissues and at particular stages (Wang and Burge 2008).
In recent years, it has become increasingly clear that the basal canonical splicing motifs contribute only part of the information required for proper splicing and for AS regulation (Fairbrother et al. 2004; Goren et al. 2006; Schwartz et al. 2008, 2009b; Akerman et al. 2009; Keren et al. 2010). Additional information is supplied by cis-acting splicing regulatory elements (SREs) that are recognized by splicing factors, mostly SR-proteins or heterogeneous nuclear ribonucleoproteins (hnRNPs) (Wang and Burge 2008). These factors enhance or repress the splicing of nearby introns and accordingly affect the sequence and structure of the mature mRNA.
RNA editing, which alters RNA sequences, has the potential to contribute additional regulatory levels to AS. A-to-I RNA editing (deamination of adenosine to inosine) is catalyzed by the ADAR (adenosine deaminase acting on RNA) family of enzymes. In mammals, this family includes ADAR (with two distinct prevalent isoforms, p110 and p150), ADARB1, ADARB2 (also known as ADAR1, ADAR2, and ADAR3, respectively). For further reading about these enzymes and A-to-I RNA editing (hereinafter referred to as RNA editing or simply editing), the reader is referred to several excellent reviews (Bass 2002; Valente and Nishikura 2005; Maydanovych and Beal 2006; Nishikura 2009). Inosine is recognized as guanosine by cellular machineries such as splicing and translation. In addition, cytosine is base-paired by reverse transcriptase with inosine during the cDNA synthesis, and, therefore, sequencing machines also identify inosine as guanosine. Inosine, however, is specifically recognized by several cellular factors such as tudor-SN or p54nrb (also known as SND1 and NONO, respectively) (Zhang and Carmichael 2001; Prasanth et al. 2005; Scadden 2005). Double-strand RNA, an obligatory substrate of ADAR enzymes, is often formed between adjacent inverted repetitive elements like Alu sequences. Alu is the most common repetitive retro-transposon sequence in the human genome. More than 10% of human genome is composed of Alu repeats, with more than 1 million copies in the genome (Kim et al. 2004). This was suggested as a major cause for the high level of RNA editing in human and primates compared with other organisms (Athanasiadis et al. 2004; Kim et al. 2004; Levanon et al. 2004, 2005; Eisenberg et al. 2005; Valente and Nishikura 2005; Li et al. 2009c; Paz-Yaacov et al. 2010).
Previous studies suggested that A-to-I RNA editing and mRNA splicing are indeed coordinated in specific genes. This coordination may be governed by the RNA Pol2 C-terminal-domain (CTD) (Laurencikiene et al. 2006; Ryman et al. 2007). Efficient exonic RNA editing activity often depends on intronic editing complementary sequences (ECS) for duplex formation, suggesting that this type of editing occurs in the pre-mRNA sequence before exclusion of introns by the spliceosome (Schoft et al. 2007).
It was also shown that ADAR, ADARB1, and splicing factors are colocalized in the lnRNP particles and were immunoprecipitated with spliceosome units and SR proteins (Raitskin et al. 2001). ADARB1 itself is auto-regulated by negative feedback using AS of its own transcripts (Rueter et al. 1999), because ADARB1 edits its own pre-mRNA and creates an alternative 3′ splice-site. The newly formed exon contains an otherwise intronic sequence with a premature stop codon, resulting in a dysfunctional short protein. In another example, RNA editing alters the mRNA coding sequence of Gria2 (Glutamate receptor B) in the mouse and changes its protein sequence from Q to R (Q/R editing site), resulting in changes in calcium permeability of neurons. Additional editing site results in an R-to-G amino acid substitution. Interestingly, it has been shown that editing of the R-to-G site leads to changes in splicing rate (Schoft et al. 2007).
Examples for interrelations between editing and splicing are evident early in evolution. In insects, RNA editing was found to be linked with AS of the nAcRalpha-30D gene (nicotinic acetylcholine receptor α 30D) (Jin et al. 2007). In Drosophila, a distinct RNA editing site in the nAcRalpha-34E gene (nicotinic acetylcholine receptor α 34E) was shown to correlate with a splicing event, demonstrating probable involvement of secondary structure elements in the process. It was proposed that this editing site strengthens an enhancer signal within the exon (Agrawal and Stormo 2005). In human, A-to-I RNA editing in splice sites (SS) was found to change the mature mRNA sequence in few cases (Rueter et al. 1999; Lev-Maor et al. 2007). Hyper RNA editing in the NARF gene (nuclear prelamin A recognition factor) in human can create a 3′-ss consensus sequence, leading to exonization of an intronic sequence and the birth of the eighth exon of this gene (Lev-Maor et al. 2007). RNA editing at the branch site of PTPN6 (protein tyrosine phosphatase, nonreceptor type 6) gene in acute myeloid leukemia (AML) patients was found to impair splicing of that intron, with a probable role in leukemogenesis (Beghini et al. 2000).
While previous studies were able to detect individual cases in which RNA editing affects AS, we undertook a systematic approach and applied high-throughput expression analysis, sequencing of transcript data sets, and massively parallel sequencing (MPS) to analyze how ADAR globally affects alternative mRNA splicing. Editing sites were identified within AS regions and specific splicing regulatory elements. We suggest, however, that the regulation of splicing directly by alteration of splicing related motifs may not be the sole mechanism by which such regulation occurs, because only a limited number of editing sites were detected close to AS regions. This is unlikely to explain the large number of AS genes found using various high-throughput experiments (exon-specific microarray and RNA-seq) in different cell types. Rather, RNA editing events within transcripts of genes related to the splicing machinery or editing independent ADAR regulation of these genes may globally affect splicing of many other genes.
RESULTS
Collection of editing sites
To examine the extent and the mechanisms by which A-to-I RNA editing modulates splicing, we performed a systematic analysis of editing sites. The direct mechanism to achieve splicing regulation by ADAR is editing of splicing-related motifs and the resulting modification of the mature mRNA organization. To explore this direction systematically, we built data sets of putative RNA editing sites using a similar approach to those previously applied (Athanasiadis et al. 2004; Kim et al. 2004; Levanon et al. 2004).
A set of filters was applied to handle sequencing errors and genomic polymorphism. Forty-two percent of replacements that passed all filters were of A-to-G (33687/80127) (see Supplement 1, Supplemental Fig. S1). Thus, subsequent analyses of editing sites used this filtered set.
Overall, we detected 20,283 editing sites in 3630 genes (the rest of them are in poorly annotated regions). ZNF83 (zinc finger 83) was the most highly edited gene, with 69 putative editing sites. It was recently shown that Alu exonization events are strongly enriched in zinc finger transcripts (Shen et al. 2011). Accordingly, our list of edited genes is enriched with zinc fingers and zinc binding proteins (396/3630 genes, FDR < 10−6) (Supplement 2). Of the editing sites identified, 156 were found in coding sequence (CDS), 14,958 in intronic regions, 513 in noncoding exonic regions, 1115 in noncoding intronic regions, 3452 in the 3′ UTR, and 89 in the 5′ UTR (Supplement 1, Supplemental Fig. S2). In addition, we used known editing sites from the DARNED RNA editing database (Kiran and Baranov 2010) as well as other published data sets of RNA editing (Li et al. 2009b; Shah et al. 2009; Bahn et al. 2012; Peng et al. 2012; Ramaswami et al. 2012), mainly based on massively parallel sequencing (MPS). These studies contributed tens of thousands of new editing sites in the transcriptome, although the vast majority of those are edited in only a tiny fraction of the transcripts. Comparison of our RNA editing prediction to these published sets can be found in Supplement 1, Supplemental Table S3.
RNA-seq of HepG2 and K562 ADAR knockdown (KD) cell lines confirmed reduction of ADAR1 (gene symbol: ADAR) expression and its editing activity (Fig. 1A,B). Editing efficiency differs significantly between editing sites in ADAR KD and control cells in both HepG2 and K562 (Wilcoxon’s P-value < 10−10 for both HepG2 and K562). The median per-site editing level in HepG2 control was 25% and only 4% in ADAR KD. A similar pattern was seen in K562 as the median editing efficiency in the control was 15% compared with only 6% in ADAR KD (calculated based on 1304 and 1675 known editing sites). This global reduction of editing is further illustrated by three known editing sites (Supplement 1, Supplemental Fig. S3a). Two of these sites are known substrates of ADAR1 (Riedmann et al. 2008). No editing reduction was seen in other adenosines within the same genes, and we consider the residual “editing” in these sites as sequencing errors or genomic polymorphism (Supplement 1, Supplemental Fig. S3b) because the fraction of guanosines in these sites is similar to the sequencing error rate (Meacham et al. 2011). This demonstrates that the editing level correlates with ADAR expression change (Supplement 1, Supplemental Figs. S3, S6). No significant change was seen in ADARB1 (ADAR2) expression (Supplement 1, Supplemental Fig. S3c). AS analysis of these RNA-seq experiments is described below.
FIGURE 1.

Reduction in editing level following ADAR KD based on RNA-seq data. (A) Editing level, G/(A + G), at adenosine sites predicted to be edited based on mRNA/EST (expressed sequence tag) (see Materials and Methods). A significant decrease in editing level is shown for both HepG2 and K562 (P-value < 10−15 for both). (B) Editing level, G/(A + G), at DARNED editing sites (Kiran and Baranov 2010). A significant decrease in editing level is shown for both HepG2 and K562 (P-value < 10−15 for both).
We divided the editing sites in exons into three groups according to their exon type: constitutive, cassette, and “other” (retained introns, alternative 5′ ss and 3′ ss) and found that editing sites are enriched in cassette exons over constitutive exons. In fact, there are 2.9 times more editing sites in cassette exons than in constitutive exons (normalized to their length and abundance; Table 1, χ2 P-value < 10−10). This trend was significant in various sets of editing sites (χ2 P-value < 10−4 for all editing sets) (Supplement 1, Supplemental Fig. S4A, Supplemental Table S4) including sites recently identified by MPS (Li et al. 2009b; Shah et al. 2009; Bahn et al. 2012; Peng et al. 2012; Ramaswami et al. 2012). Similar results were found within the 150-base intronic regions flanking the exons (P-value < 10−4) (Supplement 1, Supplemental Fig. S4b). These 150-base intronic regions were shown to contain regulatory sequences for splicing (Wang and Burge 2008; Zhang et al. 2008a; Woolfe et al. 2010).
TABLE 1.
A-to-I editing in constitutive and cassette exons
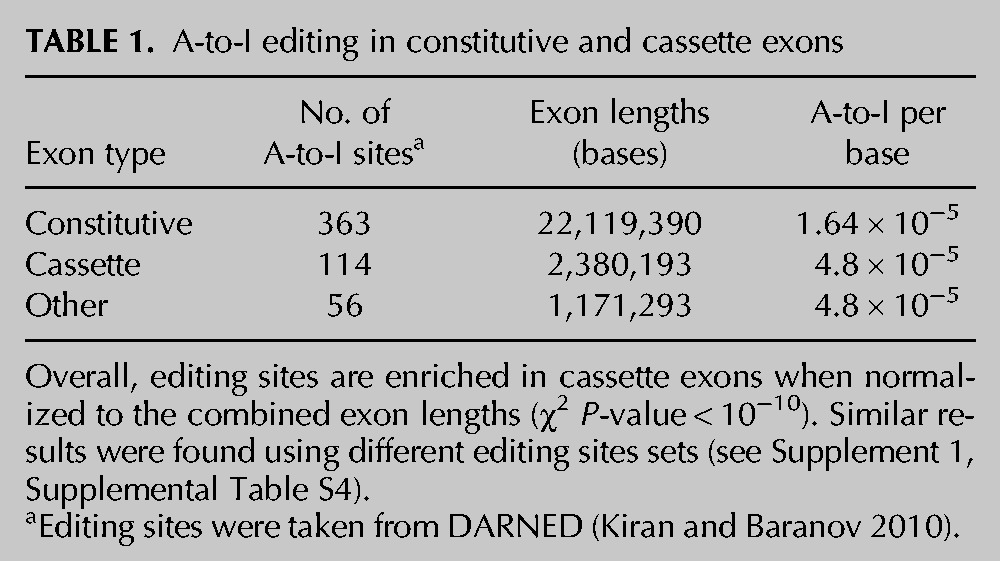
One explanation for the enrichment of editing sites in cassette exons is that cassette exons and their flanking introns contain more Alu repeats than constitutive exons (Lev-Maor et al. 2008), and Alu repeats may be the trigger for the birth of new exons (Lev-Maor et al. 2007). We indeed found that our cassette exon set is enriched with Alu repeats with 1.1 × 10⁻⁴ Alu/base, compared with 10−5 Alu/base and 3 × 10⁻⁵ Alu/base for constitutive and other AS exons, respectively. Furthermore, 78/114 (68%) and 76/363 (21%) editing sites are located within Alu for cassette and constitutive exons, respectively. Nevertheless, counting only non-Alu editing sites in cassette and constitutive exons still showed slightly more editing in cassette exons (although not significant, 1.52 × 10⁻⁵ sites/base vs. 1.29 × 10⁻⁵ sites/bases) (Supplement 1, Supplemental Table S5), suggesting that not the entire regulation is mediated by Alu repeats. It cannot be excluded, however, that some non-Alu sites might be dependent on neighboring Alu repeats (Ramaswami et al. 2012). It should also be noted that the mechanism by which Alu elements mediate AS regulation is not fully understood, and our results suggest that this process is mediated by ADAR. RNA editing in Alu repeats or simply ADAR binding may take part in AS regulation by modification of cis-regulatory elements within repeats, changing secondary structures, or altering accessibility to other factors.
A-to-I editing sites rarely fall within the primary consensus sites of canonical splicing
RNA editing has been reported to alter basal splicing signals including 5′ ss, 3′ ss, and branch site, and consequently to modify mRNA splicing (Rueter et al. 1999; Beghini et al. 2000; Lev-Maor et al. 2007). However, in our data sets, we detected very few cases of editing sites falling within known canonical 5′ ss and 3′ ss. Based on RefSeq annotations (Pruitt et al. 2007), we found only three putative editing sites within the extended 5′-ss consensus motif and only two within the extended 3′-ss consensus motif. This is also true for recently identified editing sites (Li et al. 2009b; Shah et al. 2009; Bahn et al. 2012; Peng et al. 2012; Ramaswami et al. 2012) because very few editing sites are located in 5′- or 3′-ss consensus motifs (only 24 were found while combing all these editing data sets together) (Supplement 1, Supplemental Table S6). To examine the frequency of A-to-I branch-site editing, we scanned for editing sites overlapping the branch-site consensus motif -yUnAy followed by a poly-pyrimidine-tract (Kol et al. 2005; Gao et al. 2008) and found no branch sites that overlap confident editing sites. Even though our filtering for both editing and branch-site detection is stringent and intronic RNA data are sparse, it is still safe to conclude that branch-site editing is not a common phenomenon. ADAR enzymes tend to prefer G at the +1 position downstream from the editing site (Levanon et al. 2004), while the human branch site consensus contains a pyrimidine at this position and is therefore rarely edited. We should acknowledge that editing located within introns, in particular near the exon–intron boundaries, is difficult to detect, due to the scarcity of intronic sequencing reads and alignment issues, and therefore the results should be taken with caution.
In silico assay suggesting A-to-I RNA editing modifies splicing regulatory elements (SRE)
The global effect of RNA editing on AS may be mediated through modification of SREs. Splicing factor proteins such as hnRNPs and SR-proteins (trans-elements) bind to SREs in the mRNA sequence (cis-elements) and regulate the type and level of intron inclusion/exclusion. To explore the extent by which RNA editing may alter SREs, we searched for potential SREs in exons that have at least one putative editing site according to the transcript data sets (mRNA/EST; human brain reference RNA, HBRR; universal human reference RNA, UHRR). (All editing sites in exons were used for this analysis. See Materials and Methods for details about these transcript data sets.) SREs that appear within pre-edited and post-edited sequences (by changing the human reference sequence in these sites from A to G) were counted. The editing sites create 317 new SREs within exons and abolish 267 SREs. As a control, randomly selected adenosines in the exon sequence were changed to guanosines (shuffling the A-to-G editing sites), and the cases in which these changes create or abolish SREs were counted. This procedure was repeated 1000 times, and the editing count results were compared with the distribution of the random trial counts (Fig. 2). The true editing set counts deviated significantly from the distribution of the random sets (P-value = 0.005, P-value = 0.016, for both creation and abolishment of SREs, respectively) (Fig. 2A,B). This test suggests that A-to-I RNA editing tends to abolish/create SREs and change binding of splicing factor proteins within exons, as previously suggested for individual cases (Agrawal and Stormo 2005; Lev-Maor et al. 2007). Similar results were found using a subset of editing sites in coding sequences (both synonymous and nonsynonymous editing sites [Supplement 1, Supplemental Fig. S5] or as separate sets). Computational validation with additional software supports our results because 84% of the editing sites in the assay have one or more features that make them possible splicing-affecting variants (Woolfe et al. 2010). We repeated the same procedure for SREs located within the 150-base intronic regions flanking the exons, where RNA editing creates 180 new SREs and abolishes 138 SREs. These numbers are not significantly different from the random distribution (Fig. 2C,D).
FIGURE 2.

Editing sites within SREs. SREs formed or abolished upon editing are compared with distribution of SREs formed or abolished upon random in silico editing of adenosines. (*) The number of formed/abolished sites. (A) SREs formed within exon sequences. The set of true editing sites creates 317 SREs, more than in almost all of the random sets (P-value = 0.005). (B) SREs abolished within exon sequences. The true editing sites abolish 267 SREs, significantly more than random sets (P-value = 0.016). (C) Creation of SREs within intronic regions close to exons (150 bases). The editing sites create 180 new SREs, not significantly different from the random sets. (D) Abolishment of SREs within intronic regions close to exons (150 bases) following random A-to-G replacements. The editing sites abolish 138 SREs, not significantly different from the random A-to-G sets.
Analysis of SREs affected by the exonic editing revealed that the most common abolished splicing regulatory element (SRE) is 5′-AAGAA-3′ (47 times out of 267), which is recognized by TRA2A and TRA2B (transformer 2α and transformer 2β homolog, respectively), known activators of AS, which account for sex determination in Drosophila (Lalli et al. 2003). The most common newly formed SRE is 5′-GGGA-3′ (43 new appearances out of 317), a motif recognized by HNRNPF (regulators of splicing that play a role in splice site selection) (Martinez-Contreras et al. 2006). It is important to note that some RNA binding proteins specifically identify inosine (like SND and NONO), and therefore treating inosine as guanosine, as in our in silico assay, might not be a valid assumption in these cases. However, editing has the potential to destruct/construct binding of factors that interact with the RNA through base hydrogen bonds. Indeed, some important RNA binding proteins interact with RNA primarily through hydrogen bonds (Lunde et al. 2007). Careful analysis of HNRNPF qRRM three-dimensional (3D) structure suggests that inosine may well take the role of guanosine because deamination of A to I makes inosine a possible hydrogen acceptor for a crucial hydrogen bond between the guanosine O6 and ARG 81 of the first qRRM domain (PDB ID: 2KFY) (see Supplement 1, Supplemental Fig. S16, Supplemental Table S7; Dominguez et al. 2010). Therefore, A-to-I RNA editing has the potential to change binding motifs of at least certain classes of RNA binding proteins. As is described below, HNRNPF binding sites (SREs) were found to be enriched in AS RNA processing genes detected in the ADAR KD RNA-seq analysis (Supplement 1, Supplemental Table S18).
Although RNA editing has a significant effect on certain SREs, the number of editing sites detected is probably too small to unravel the global ADAR-dependent AS revealed using exon-specific microarray and RNA-seq. (Here, we found only 244 editing sites within 193 exons of 188 genes, while AS analysis of RNA-seq and microarray data revealed thousands of AS regions.)
ADAR has prominent influence on global splicing pattern
To examine the global changes in expression and splicing patterns in ADAR-deficient cells (ADAR KD), we carried out an exon-specific microarray experiment for two different human cell lines, HepG2 and K562. Analyses of both exon level and gene level were performed (see Materials and Methods) in order to determine how ADAR affects both AS and total gene expression level.
Quite similar numbers of AS genes were obtained from both cell lines; 963 and 1249 genes change their splicing pattern for HepG2 and K562, respectively (AS Q-value ≤ 0.01 and fold-change < 1.5) (Supplement 3), with 353 of them overlapping (illustrated as a Venn-diagram in Fig. 3A). Analysis of the total gene expression level revealed a different picture, with only a small number of genes in the K562 changing their expression in the ADAR KD cells, whereas in HepG2, many more genes did (150 genes and 964 genes for K562 and HepG2, respectively, at fold-change ≥ 2), with only 27 of them overlapping.
FIGURE 3.

Genes that change expression/splicing pattern in both K562 and HepG2 cell lines upon ADAR KD. The x-axis indicates the size of the union (total) set of genes that change expression/splicing in both cell lines under a particular threshold. The y-axis indicates the intersection size (number of overlapping or expected number of overlapping genes) under the same significance level. (A) AS analysis. (Inset) Data of the marked point as a Venn diagram (AS P-value = 0.01). (Overlap splicing) Number of genes that change their splicing pattern in both cell lines according to various thresholds; (expected overlap splicing) number of genes expected to change their splicing pattern in both cell lines according to various significance levels, assuming independent sets. (B) Differential gene expression analysis. (Overlap expression) Number of genes that change expression in both cell lines according to various fold ratio thresholds; (expected overlap expression) number of genes expected to change expression in both cell lines according to various fold ratio thresholds. The numbers of genes for each analysis threshold used are detailed in Supplement 1, Supplemental Tables S8 and S9.
The overlapping sets of differentially expressed genes and AS genes in both cell lines under different thresholds were examined in order to elucidate the universality of the two modes of regulation by ADAR. Interestingly, we found that the effect of ADAR KD on AS was more prominent than the effect on gene expression level (Fig. 3), an observation that held for several expression/splicing thresholds (we used different thresholds to ensure robustness of this signal; see Materials and Methods for exact thresholds). The overlapping set of AS genes between the two cell lines was also significantly larger than expected considering the size of each AS gene set (χ2 P-value < 10−10; see detailed calculation in Materials and Methods). The full list of the overlapping genes is available in Supplement 3, and exact thresholds used are shown in Supplement 1, Supplemental Tables S8 and S9.
To verify our microarray findings, we used RNA-seq (Illumina GA2X, paired-end, 76 bases) to sequence mRNA from control and ADAR KD HepG2 and K562 cells. Sequencing details are available in Materials and Methods and in Supplement 1, Supplemental Table S2. Similar to the microarray experiment, we analyzed both total gene expression and alternative splicing (AS). The results were consistent with the microarray experiment. HepG2 and K562 have more shared AS genes in ADAR KD cells, than shared differentially expressed (DE) genes (Supplement 1, Supplemental Fig. S7). The intersection sets were also significantly larger than expected based on the size of each individual AS/DE gene list (P-value < 0.004). In total, we found 4748 and 5148 AS genes in HepG2 and K562, respectively (with 12,910 and 14,360 AS regions in HepG2 and K562, respectively) (see Supplement 5; Supplement 1, Supplemental Tables S10 and S11). Furthermore, a similar analysis based on recently published data from Bahn et al. (2012) using RNA-seq of ADAR KD in U87MG cell lines also showed a global change in splicing pattern, with 2422 genes changing their splicing pattern following ADAR silencing (for detailed AS regions, see Supplement 6).
Are genes that significantly change their splicing pattern in ADAR-deficient cells enriched with A-to-I RNA editing sites?
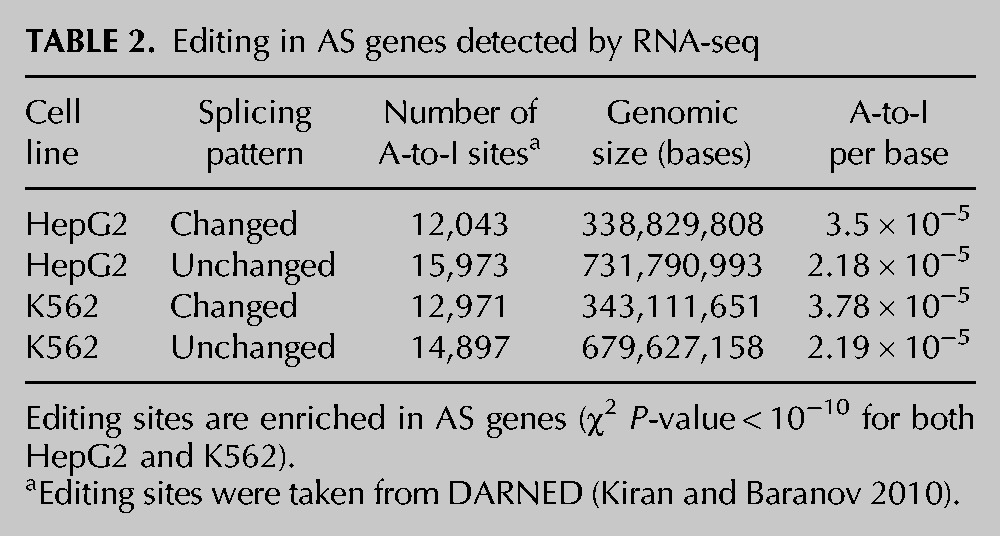
What is the mechanism by which ADAR affects the splicing pattern of many targets? Several mechanisms can be suggested. The direct mechanism would involve editing of cis-elements, recognized by the splicing machinery. This pathway was demonstrated here mainly by SRE editing. We examined A-to-I RNA editing sites in genes with significant change in splicing pattern between ADAR silenced and control samples (low AS P-values), compared with genes with no change in splicing pattern between the two samples. Indeed, AS genes were enriched with putative editing sites compared with genes with no splicing changes. This was evident for both K562 and HepG2 in both RNA-seq and microarrays (P-value < 10−10). This trend was valid over several different sets of RNA editing (Table 2; Supplement 1, Supplemental Table S12). Similar results were found using RNA-seq data from Bahn et al. (2012), using their published set of editing sites intersected with AS genes we detected based on their published sequencing data (see details in Supplement 1, Supplemental Table S13). The detected AS genes also have more Alu repeats than non-AS genes (see Supplement 1, Supplemental Tables S12, S13).
TABLE 2.
Editing in AS genes detected by RNA-seq
When we searched for editing sites among the 1000 bases flanking the detected AS cassette exons, we found only a small number of editing sites (Supplement 1, Supplemental Table S14). The closest editing sites to AS regions were often found in a nearby Alu or in the nearest reverse-orientated Alu. One example of such a case is shown in Supplement 1, Supplemental Figure S8, where the third exon of SEPN1 was found to be down-regulated in U87MG KD cells (4.85-fold, FDR = 0.003). This was also evident based on reads mapped to this exon–intron splice junction (P-value = 0.016). Interestingly, the very same exon was previously shown by Lin et al. (2008) to be AS, where exon-specific microarrays were used in order to detect Alu exonization events, but in a different cell type (their detected AS probe set is shown in Supplement 1, Supplemental Fig. S8B). Here, we show that this exon is regulated by ADAR. Two reverse-oriented Alus (AluJb) are located close to this exon and may form an ideal double-stranded (DS) RNA substrate for editing. One of the editing sites (chr1:26128083; hg19, Human genome version 19 [GRCh37]) is predicted to create an SRE for SFRS9 and to abolish the SREs of SFRS5 and HNRNPH1/2 within the upstream Alu (Supplement 1, Supplemental Fig. S9). Another editing site is located within the coding sequence (CDS) of CCDC136 and is predicted to create an SRE for FOX1 (chr7:128451355, hg19) (see Supplement 1, Supplemental Fig. S10).
AS genes are in general more extensively edited and contain more Alus than other genes. At this stage, it is difficult to determine if the editing mediates the AS regulation, or whether other ADAR-dependent events are responsible for this effect on AS. Editing sites experimentally verified to regulate AS regions are, in fact, rare. Based on the RNA-seq experiments, we detected only 17 verified editing sites in the vicinity of the detected AS regions (Supplement 1, Supplemental Table S14), suggesting that direct editing is not the sole explanation for AS. The number of confident A-to-I editing sites in the vicinity of splice junctions seems too small to reveal the full extent of the ADAR-dependent splicing regulation as detected based on RNA-seq and microarray. Editing in SREs is found to be more frequent than editing of the canonical splicing motifs based on in silico assay, but also cannot fully explain the global changes in splicing pattern. We therefore sought additional mechanisms of indirect regulation by third-party splicing machinery molecules, e.g., changes in expression levels of RNA processing and splicing genes.
ADAR KD cells exhibit significant changes in splicing and RNA processing genes
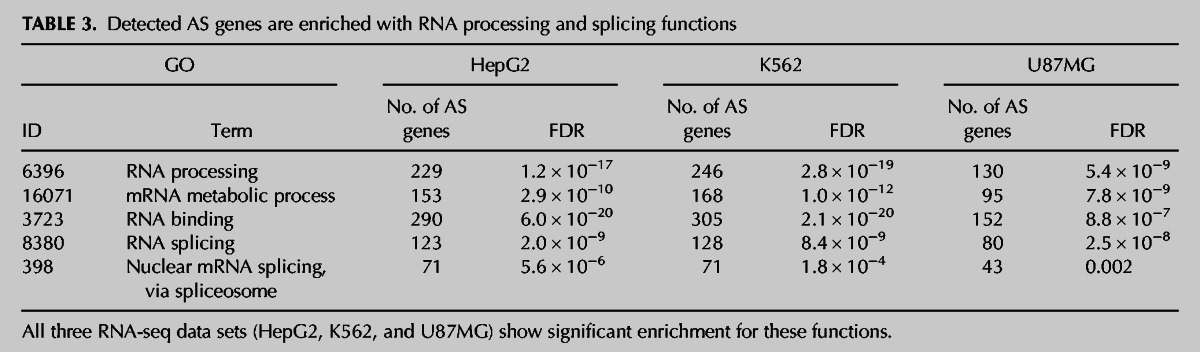
Functional enrichment analysis was performed on the genes detected by exon-specific microarray and RNA-seq analysis to significantly change their splicing pattern. Among the K562 and HepG2 AS genes from exon-specific microarray results, we detected an enriched set of RNA processing and splicing machinery genes (Supplement 3). HepG2 and K562 RNA-seq confirm these results, because AS genes were found to be significantly enriched with RNA processing and splicing activity (123 and 128 genes for HepG2 and K562, respectively) (Table 3, FDR < 10−8). A significant number of AS RNA processing genes and splicing related genes were detected based on the RNA-seq of Bahn et al. (2012) as well (80 genes; FDR < 10−7) (Table 3). This enrichment for AS RNA processing genes was robust for the criteria chosen to determine changes in splicing (i.e., increasing levels of splicing-index) (see data in Supplements 5, 6). Moreover, AS analysis of publicly available expression data from ADAR KD human embryonic stem cells (Osenberg et al. 2010) reveals similar trends (Supplement 1, Supplemental Table S20).
TABLE 3.
Detected AS genes are enriched with RNA processing and splicing functions
An example is shown in Figure 4 demonstrating the up-regulation of the second exon of HNRNPR (heterogeneous nuclear ribonucleoprotein R) upon ADAR KD in U87MG (1.93-fold increase; FDR < 10−5). Using reads mapped to the second exon splice junctions, which accurately detect the splice sites, the KD sample contains more reads supporting inclusion of this exon than reads supporting its exclusion (P-value = 0.0075). This is predicted to result in an alternative N-terminal variant of its protein (ENST00000478691–ENSP00000363745, 535–636 amino acids long). Computational verification using another software, DEXSeq (Anders et al. 2012), detects the same global signals (enrichment for AS RNA processing genes) (Supplement 1, Supplemental Table S21) and specifically AS of HNRNPR. In addition, we were able to see the same splicing pattern by RT-PCR of HepG2 ADAR KD cells where the second exon of HNRNPR have 1.3-fold higher expression than the control, following normalization to the expression level of constitutively expressed exon (Supplement 1, Supplemental Fig. S17). Additional examples are summarized in Supplement 1, Supplemental Table S19 and Supplemental Figures S11–S15, where we show that RNA processing genes including MBNL1, PSPC1, FMR1, SFRS4, POLL, CELF1, SF1, ZNF638, RBM3, and HNRNPD, all change their splicing pattern in the analyzed RNA-seq experiments of ADAR-deficient cells. It is interesting to note that dFMR1, the Drosophila homolog of FMR1, was shown to modulate dADAR activity (Bhogal et al. 2011).
FIGURE 4.

ADAR-dependent AS in HNRNPR based on U87MG RNA-seq (Bahn et al. 2012). (A) Different isoforms of HNRNPR. (Shaded box) The second exon (chr1:23667344–23667510, hg19) found to be AS. (B) Coverage plot of the second exon in U87MG cells (shaded region in A). The KD sample has deeper coverage (1.92-fold increase: 81 and 156 normalized reads for control and KD, respectively; FDR < 10−5). (C) Scheme of the junction reads supporting AS of the second exon. The KD sample contains more reads supporting inclusion of this exon than reads supporting its exclusion (P-value = 0.0075). Only split reads that precisely indicate the junctions were counted. (Green) Control sample coverage; (red) ADAR KD sample coverage (two biological replicates for ADAR KD or control are shown in the figure). (Purple) The AS region, as it appears in the University of California at Santa Cruz (UCSC) KnownAlt track.
DISCUSSION
A-to-I RNA editing was shown in recent years to be a common event with tens of thousands of edited sites distributed in the human transcriptome (Athanasiadis et al. 2004; Kim et al. 2004; Levanon et al. 2004, 2005; Li et al. 2009b). A newer study that applied extremely deep MPS even found hundreds of thousands of sites (Ramaswami et al. 2012). An open question is how many of these sites have a functional role, and how many represent neutral/random events. Due to the low editing level of most of the sites (Ramaswami et al. 2012), they probably have only a minor effect on splicing regulation of frequent transcripts. However, several clues, such as cellular localization, connect the ADAR enzymes to the splicing machinery (Raitskin et al. 2001). The suggested negative feedback, splicing-mediated auto-regulation of ADARB1 itself (Rueter et al. 1999) is a fascinating example of the connection between these processes.
Attempts to identify candidate genes edited at adenosines of the characterized canonical splice elements (3′ and 5′ ss and branch site) revealed only a small number of examples. ADAR-dependent regulation of AS may involve editing of other elements, and we show here that editing alters SREs. Modulation of SREs opens the door to fine-tuned regulation, mediated by additional factors. However, only 244 editing sites with a putative effect on SREs were discovered, while the number of gene regions predicted to change their splicing pattern is on the order of thousands. We therefore suggest that direct editing cannot explain the extent of ADAR-dependent AS regulation, as demonstrated here by RNA-seq and microarray analysis of ADAR KD cells. On one hand, editing sites located close to the AS region and within the splicing sequence motif are sparse. On the other hand, we show a global change in splicing pattern following ADAR KD based on both microarray and RNA-seq from different cell lines. The AS genes in the different cells are enriched with similar functions, supporting the validity of the analysis. We therefore suggest that a significant part of the ADAR-dependent AS regulation is not a result of direct editing activity, but is mediated by additional factors and may also include editing-independent mechanisms.
A parsimonious explanation of the extent of this regulation is editing of trans-acting elements (or some other ADAR-mediated regulation of trans-elements), rather than direct cis-element editing. This may lead to a broad influence on splicing of many genes. Indeed, our results demonstrate extensive regulation of RNA processing and splicing genes in response to ADAR KD. It seems that the AS genes, and specifically, the AS RNA processing genes, contain more Alu repeats and more organized secondary structures and therefore more editing sites than any other genes. Higher numbers of reverse-oriented Alu repeats and secondary structures increase the probability of both editing and AS. We noticed that AS RNA processing and splicing-related genes detected in HepG2 and K562 have a higher density of Alu repeats than other detected AS genes. Significant enrichment for Alu was also shown by U87MG RNA-seq. We show here that AS RNA processing and splicing genes have a higher probability of being edited than any other AS genes. This result is consistent while using different sets of editing sites (Supplement 1, Supplemental Tables S15–S17), including those recently found by MPS (Li et al. 2009b; Shah et al. 2009; Bahn et al. 2012; Peng et al. 2012; Ramaswami et al. 2012). Moreover, while analyzing publicly available HNRNPF CLIP-seq data (Huelga et al. 2012), we found that the detected AS RNA processing genes have relatively more HNRNPF binding sites than other AS genes (Supplement 1, Supplemental Table S18), further supporting this link. It still remains to be shown how this regulation is achieved at the molecular level, but such a model may explain how a limited number of editing sites can globally affect splicing patterns of many genes. Irimia et al. (2012) showed that conserved A-to-I RNA editing in the CDS of the splicing factor NOVA1 can cause stabilization of its protein and suppress proteasome degradation.
The editing activity of ADAR can also potentially alter the secondary structure of the mRNA. Inosine can interact with cytosine through Watson-Crick base-pairing and with adenosine and uridine through wobble base-pairing. It can create or disrupt base-pairing (Levanon et al. 2004) and can change the accessibility of RNA to splicing factors. A distant cluster of editing sites can potentially alter the splicing pattern of a remote region by changing the structure and stability of RNA. Indeed, a growing body of evidence suggests that AS is also controlled by the secondary structure of RNA (Shepard and Hertel 2008; Schwartz et al. 2009a; Pervouchine et al. 2011). A probable example for this regulation in our analysis is the third exon of SEPN1, where two reverse-oriented Alus form the substrate for both editing and splicing (Supplement 1, Supplemental Fig. S8). Based on these observations, we also suggest that binding of ADAR enzymes to DS RNA can affect splicing independently of editing events. Recently, it was shown that ADAR can affect microRNA and RNAi processing through a mechanism independent of its editing activity (Heale et al. 2009).
Other mechanisms that cannot be ruled out for splicing regulation are editing of the RNA components of the spliceosome. Editing of various types of regulatory RNA molecules has been recently reported (Nishikura 2009; Hundley and Bass 2010). Modification of spliceosomal RNA has a potential to facilitate global changes in splicing, similar to those induced by splicing factors. Further work is needed to assess the importance of such mechanisms in splicing regulation.
Splicing and editing are the two main processes contributing to transcriptome diversity. At the same time, they contribute various potential levels of post-transcriptional regulation. Both processes occur more widely in primates compared with other organisms (Eisenberg et al. 2005; Paz-Yaacov et al. 2010). Our study highlights the connection between these two processes, emphasizing how ADAR contributes to AS regulation. ADAR enzymes appear to be crucial for development, because Adar knockout mice die in the embryonic stage and Adarb1 knockout mice suffer from seizures and die at an early age (Higuchi et al. 2000; Schoft et al. 2007). In human, RNA editing was also shown to be frequent in the central nervous system (Levanon et al. 2004). Improper RNA editing was found in neurological disorders including depression, epilepsy, amyotrophic lateral sclerosis, and schizophrenia (Maas et al. 2006; Grohmann et al. 2010). Lower levels of editing were found in glioblastoma multiforme (GBM) and have been associated with epileptic seizures (Maas et al. 2001; Paz et al. 2007). The wide extent of RNA editing in the CNS and the relation between ADAR activity and AS, as globally examined and demonstrated in the present study, highlight the importance of ADAR in the acquisition of higher functions in primate evolution.
MATERIALS AND METHODS
Genomic data
The hg19 version (GRCh37) of the human genome was downloaded from the UCSC ftp site (ftp://hgdownload.cse.ucsc.edu/goldenPath/hg19/) and served as the DNA reference for detection of editing sites. We used RefSeq (Pruitt et al. 2007) annotation to define genes and exon–intron boundaries. Genomic variation data are based on dbSNP132 (Sherry et al. 2001) and were downloaded from the UCSC table browser (Karolchik et al. 2004). Repeat data were taken from RepeatMasker (http://www.repeatmasker.org/).
Transcript data
EST and mRNA data (June 2009 version; at the time of the analysis, this database included 249,717 and 7,510,566 sequences for mRNAs and ESTs, respectively) and their alignments to the human genome (GRCh37/hg19) were taken from the UCSC table browser. 454 Life Sciences RNA-seq data (Mane et al. 2009) were downloaded from the Sequence Read Archive (SRA; SRA003647/SRP000614). This experiment allows comparison of RNA samples from brain tissue (HBRR; human brain reference RNA) and RNA from a pool of several human tissues (UHRR; universal human reference RNA). All reads from this experiment were aligned to the human genome (hg19) using BLAT (Kent 2002). Detailed information regarding the numbers of reads aligned and annotation of each run can be seen in Supplement 1, Supplemental Table S1.
ADAR KD and control samples (with two biological replicates per sample) from the U87MG cell line were downloaded from the publicly available data of Bahn et al. (2012). U87MG reads were aligned to the human reference genome (hg19) and were analyzed by the same approach we used for our RNA-seq of HepG2 and K562 (see details below).
A-to-I RNA editing detection and collection
RNA editing sites were originally detected based on comparison of the transcript data (mRNA/EST/RNA-seq reads) and the reference genome. Single nucleotide variation (SNV) between the transcripts and the reference genome was reported. To enrich the data with putative RNA editing events over sequencing errors and genomic polymorphism, several filters were used, some of which can be regarded as general “quality assurance” criteria, while others were more directly related to the biology of A-to-I RNA editing enzymes. The general criteria included:
The SNV site must be distal from sequence ends because error probability increases significantly toward the sequence terminus. Only sites located more than 20 bases from the edge of the transcripts were considered.
Known single nucleotide polymorphism (SNP) sites were excluded (a stringent approach was used, and SNPs were excluded irrespective of their source and frequency in the population).
Variation from the reference must be supported by at least 5% of all aligned reads that cover the site and at least two ESTs or one mRNA.
Specific A-to-I targeted criteria included:
A-to-I RNA editing sites tend to cluster; thus putative A-to-I RNA editing must be joined by at least two additional A-to-G changes within a window of 32 bases where no more than one different alteration (non-A-to-G) is found in this span (each editing site is found in a cluster of A-to-G sites, but not all of the sites in a given cluster are reported in the final stage due to other criteria mentioned here).
ADAR enzymes can only edit double-strand RNA (DS RNA). Putative DS RNA was defined as regions with >80% of the 24-base-long sequences flanking the SNV site complementary to a sequence up to 2000 nucleotides (nt) from the SNV sites.
Putative editing sites detected based on the MPS data of breast cancer (Shah et al. 2009) were also applied using the published list (Table S10 of Shah et al. 2009) with no additional processing. DARNED editing sites (Kiran and Baranov 2010) were examined to verify the trends detected using our own predicted editing sites. DARNED sites were collected from previous studies (Athanasiadis et al. 2004; Kim et al. 2004; Levanon et al. 2004) based on EST/mRNA data available at the time of their publication.
The procedure to validate editing sites based on our own RNA-seq experiment is detailed below. Editing sites detected in recent publications (Li et al. 2009b; Bahn et al. 2012; Peng et al. 2012; Ramaswami et al. 2012) were taken from their supplemental data. Comparison between editing sets is shown in Supplement 1, Supplemental Table S3.
Annotations of RNA editing to genomic regions
For annotation of particular genomic sites scripts developed in house, IntersectBed of the BEDTools package (Quinlan and Hall 2010), PeakAnalyzer (Salmon-Divon et al. 2010), and ANNOVAR (Wang et al. 2010) were used.
Splicing data sets
The known Alt (Sugnet et al. 2004) track of UCSC was used to define constitutive and cassette exons. Experimentally proven SREs were taken from two recent papers (Akerman et al. 2009; Piva et al. 2009). Skippy (Woolfe et al. 2010) was used in order to computationally verify our SREs in silico assay. 5′-ss and 3′-ss consensus motifs were derived based on splice junctions in RefSeq genes in order to detect their alterations. Publicly available HNRNPF CLIP-seq data (Huelga et al. 2012) were aligned to the human genome using TopHat (Trapnell et al. 2009) with similar parameters as described below for the RNA-seq reads and analyzed with MACS (Zhang et al. 2008b) using default parameters.
Cells and transfections
The K562 cell line was originally derived from a chronic myelogenous leukemia (CML) in a blast crisis (Lozzio and Lozzio 1975), and the HepG2 cell line was originally derived from liver tissue of a hepatocellular carcinoma patient (Barretina et al. 2012). Both cell lines were stably transfected with plasmids containing siRNA designed to specifically knock down ADAR expression (ADAR KD). Different types of siRNA were tested, and the one yielding the best ADAR reduction was chosen. The same cells transected with a plasmid containing the scrambled siRNA (SCR) were used as a control. Quantitative real-time (RT) PCR using specific primers designed for ADAR mRNA was used for validation. Reduction of ∼75% in the p110 isoform expression was observed, confirming successful knockdown of the ADAR gene (Supplement 1, Supplemental Fig. S6). Significant reduction of ADAR editing activity was validated using RNA-seq of these cell lines (Fig. 2; Supplement 1, Supplemental Fig. S3). In K562, most cells die soon after ADAR silencing, and surviving cells show only ∼30%–55% reduction of ADAR (Supplement 1, Supplemental Fig. S6). Recent studies have shown that ADAR plays a major role in chronic myeloid leukemia (CML) tumor progression. In these studies, most cells underwent apoptosis following ADAR reduction (Steinman et al. 2012; Jiang et al. 2013). We used RT-PCR in order to verify AS of HNRNPR in HepG2 ADAR KD cells (Supplement 1, Supplemental Fig. S17). The AS exon primers were (chr1:23667345–23667510, hg19) forward: CAGGTGAATGGTAATGCGGTA and reverse: GAGGCCTGCCTCTATCAGTG. The constitutive exon primers were (3′ UTR of HNRNPR, chr1:23,636,378–23,637,558, hg19) forward: GCTGGCTATTCACAGAGGGG and reverse: CCTACATTGCCCCCACGATT.
Microarray experimental setting
The microarray experiment was performed using an exon-specific microarray (Affymetrix exon 1.0 st, http://www.affymetrix.com). This array includes a probe set for each annotated exon, making it feasible to compare expression levels of individual exons and thus to evaluate AS. RNA was purified using TRIzol. For each cell line, control (SCR) samples and ADAR KD samples were tested. ADAR was repressed 4.43-fold and 2.8-fold for HepG2 and K562, respectively.
Microarray analysis
The Partek genomic suite (http://www.partek.com/) was used for analysis of the microarray data. AS ANOVA (analysis of variance) was used for splicing analysis and expression ANOVA for total gene expression level analysis. Only genes without a large change in expression were considered in the AS analysis (fold-change ≤ 1.5). Filtering for gene expression is important in analyzing exon-specific microarrays (Gaidatzis et al. 2009). Lists of AS genes were extracted using four different significance thresholds (AS ANOVA P-values of 0.001, 0.01, 0.015, and 0.025). For comparison of total gene expression between samples, four fold-change ratios of 1.4, 1.5, 2, and 3 were used. Different thresholds were applied to ensure that the results were robust for each specific threshold used and to examine the universality of AS regulation in different cell types compared with total gene expression level.
Expected numbers of overlapping genes (Nexp) between the two cell lines were calculated under the independence assumption:
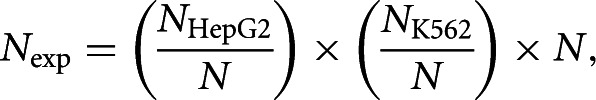 |
(1) |
where N is the total number of genes represented on the array. NHepG2 and NK562 are the numbers of detected genes in HepG2 and K562, respectively, under a certain threshold. See Supplement 1, Supplemental Tables S12 and S13, for exact numbers of intersecting genes. Detection of AS regulation of specific genes was cross-validated using AltAnalyze (Emig et al. 2010; Salomonis et al. 2010). Because the exon microarray included only one replicate per sample, it suffers from low statistical power; thus, only trends common for both cell types were reported after correcting P-values for multiple hypothesis testing (Storey and Tibshirani 2003) and verifying these trends using RNA-seq.
The ADAR KD microarray data of hESC (Osenberg et al. 2010) were downloaded from the Gene Expression Omnibus (GEO; GEO -ID: GSE19719, http://www.ncbi.nlm.nih.gov/geo/).
RNA-seq experimental setting
RNA-sequencing (RNA-seq) of the same cell lines (HepG2 and K562) was performed. RNA-seq provides data on gene expression, exon-level expression, and the actual transcript sequences for measurement of editing level. 76 base paired-end reads were sequenced in Illumina GAIIX with two technical replicates for each sample (2 × control and 2 × ADAR KD for HepG2 and K562). Sample annotation and details can be found in Supplement 1, Supplemental Table S2.
Short-read alignment
Alignment of RNA-seq reads was done using TopHat (Trapnell et al. 2009), a splicing-aware aligner. The reads were mapped to the human reference genome (hg19). Mismatches were not allowed adjacent to the splice junction, and a splice-junction anchor of at least 12 bases was used. The alignment was done with respect to known Ensembl transcripts (using Ensembl62 transcripts GTF file), and unknown splice-junction detection was set to “off.” Therefore, unknown splice variants could not be detected, and all results shown in this study are based on known variants. Using SAMtools (Li et al. 2009a), only paired-end reads were retained, where both ends aligned in a proper orientation and with less than 100,000 bases between them. A similar approach was used to analyze RNA-seq of U87MG cell lines from Bahn et al. (2012).
Differential expression analysis of RNA-seq data
Differential expression (DE) analysis was done using AltAnalyze (Emig et al. 2010; Salomonis et al. 2010) by counting the reads for each constitutive exon in Ensembl genes (Ensembl62) and using AltAnalyze quintile normalization. For detection of differentially expressed (DE) genes, we used three fold-change ratios of 1.4, 2, and 2.5 (detailed in Supplement 1, Supplemental Table S10). The numbers of the DE genes in both cell lines were compared with the expected number of DE genes, assuming independent sets (calculated as described above for the microarray analysis). For selected alternative regions, detection of differential expression was validated using a Perl code kindly provided by Shahar Alon (Alon et al. 2011).
Alternative splicing analysis of RNA-seq
RNA-seq AS analysis was done using AltAnalyze (Emig et al. 2010; Salomonis et al. 2010) based on alignment and junctions obtained by TopHat (Trapnell et al. 2009). AltAnalyze uses two methods: (1) Splice-index (SI), adapted from Affymetrix exon microarray analysis, measures the expression of a given exon relative to the total gene expression. (2) Analysis of splicing by isoform reciprocity (ASPIRE), adapted from Ule et al. (2005), uses reads mapped to junctions. Only exons detected as AS by both methods and whose genes were not found to be differentially expressed (|fold-change| < 2) were considered as AS exons. Genes with at least one AS exon were considered AS genes. For comparison of AS genes common to both cell lines, we used five SI thresholds of 1.25, 1.5, 1.75, 2, and 2.5 (detailed in Supplement 1, Supplemental Table S11), and the number of AS genes was compared with the expected number of AS genes (calculated as described above for the microarray analysis).
To demonstrate ADAR AS regulation on splicing factors and RNA processing genes, a list of carefully validated AS exons was compiled. This list contains genes that were:
Found to be AS in more than one cell line.
Detected by AltAnalyze using the two AS detection methods (ASPIRE and SI in HepG2 and K562) or by all SI comparisons of the U87MG samples.
Checked for AltAnalyze protein isoform prediction.
Checked manually for differences in junction coverage.
Visualized using the UCSC Genome Browser.
The coverage of their detected exon was significantly changed between KD and control. See Supplemental Table S19 and Supplement 5 for the detailed list.
AS results were verified by DEXSeq (Anders et al. 2012), which revealed the same global signals.
Verification of editing sites from RNA-seq analysis
To verify editing sites predicted based on mRNA/EST, SAMtools pileup (Li et al. 2009a) and varScan (Koboldt et al. 2009) were sequentially applied on the RNA-seq alignments and scanned for SNV sites of type A-to-G or T-to-C (because the RNA-seq protocol was not strand specific). In this study, only sites predicted previously by EST/mRNA analysis and edited in both replicates were considered. The editing level of these sites was compared between control and KD. A similar approach was used to examine the editing levels in adenosines at the same genes not previously reported to be edited. Editing sites in U87MG cell lines were taken from the supplemental files of Bahn et al. (2012).
Functional analysis
DAVID (Huang da et al. 2009) was used for functional enrichment analysis of genes obtained from the RNA-seq and microarray analysis or the editing sites analysis. Background lists of all known human genes or only expressed genes were used. Functional analysis of gene lists from microarrays was also done with Partek Gene Ontology (Gene Ontology, GO) (Ashburner et al. 2000) enrichment and cross-validated with DAVID.
Structural analysis
Structural analysis was done using the HNRNPF 1st qRRM pdb file (pdb id: 2kfy). Contact lists were obtained using the WHATIF server (Hekkelman et al. 2010). Structural visualization was done using Jmol (http://www.jmol.org/).
Programs and scripts
Perl scripts, which perform the computational tasks (editing detection and filtering, SRE detection, random motif shuffling, determination of splice site strength, automation of microarray and RNA-seq analysis, and estimation of editing level from RNA-seq), can be obtained from the authors upon request.
Statistics
Statistical tests (Fisher-exact test, χ2 test, correlation test, and Q-value calculations) were performed using the R statistical programming language (The R Core Team 2012).
DATA DEPOSITION
For ADAR, see Gene ID: 103; for ADARB1, Gene ID: 104; for ADARB2, Gene ID: 105; for ADAR (protein), UniProt ID: P55265.
SUPPLEMENTAL MATERIAL
Supplemental material is available for this article.
ACKNOWLEDGMENTS
We thank Dan Dominissini, Erez Levanon, Limor Ziv-Strasser, Mali Salmon-Divon, Nathan Salomonis, Schraga Schwartz, and Shahar Alon for their comments and useful advice. We thank Chen Gefen-Dor for assistance with the microarrays. The work of O.S. was done in partial fulfillment of the thesis requirements of the Faculty of Life-Sciences, Bar-Ilan University, Israel. This work was supported in part by grants from the Flight Attendant Medical Research Institute (FAMRI), The Molecular Basis of Human Disease I-CORE (Israeli Centers of Research Excellence). G.R. holds the Djerassi Chair in Oncology at the Sackler Faculty of Medicine, Tel Aviv University.
Authors’ contributions: O.S. and E.E. designed the experiments, performed the bioinformatics and statistical assays, analyzed the data, and wrote the manuscript. P.A. and R.K. performed bioinformatics experiments and helped analyze the data. M.S., S.O., and N.D.U. performed the tissue culture and the KD experiments. J.J.-H. and K.C. performed the RNA-seq and microarray experiments and helped analyze the data. R.U., N.A., and G.R. conceived ideas and helped write the manuscript. All authors have read and approved the final version of the manuscript.
REFERENCES
- Agrawal R, Stormo GD 2005. Editing efficiency of a Drosophila gene correlates with a distant splice site selection. RNA 11: 563–566 [DOI] [PMC free article] [PubMed] [Google Scholar]
- Akerman M, David-Eden H, Pinter RY, Mandel-Gutfreund Y 2009. A computational approach for genome-wide mapping of splicing factor binding sites. Genome Biol 10: R30. [DOI] [PMC free article] [PubMed] [Google Scholar]
- Alon S, Vigneault F, Eminaga S, Christodoulou DC, Seidman JG, Church GM, Eisenberg E 2011. Barcoding bias in high-throughput multiplex sequencing of miRNA. Genome Res 21: 1506–1511 [DOI] [PMC free article] [PubMed] [Google Scholar]
- Anders S, Reyes A, Huber W 2012. Detecting differential usage of exons from RNA-seq data. Genome Res 22: 2008–2017 [DOI] [PMC free article] [PubMed] [Google Scholar]
- Ashburner M, Ball CA, Blake JA, Botstein D, Butler H, Cherry JM, Davis AP, Dolinski K, Dwight SS, Eppig JT, et al. 2000. Gene Ontology: Tool for the unification of biology. The Gene Ontology Consortium. Nat Genet 25: 25–29 [DOI] [PMC free article] [PubMed] [Google Scholar]
- Ast G 2004. How did alternative splicing evolve? Nat Rev Genet 5: 773–782 [DOI] [PubMed] [Google Scholar]
- Athanasiadis A, Rich A, Maas S 2004. Widespread A-to-I RNA editing of Alu-containing mRNAs in the human transcriptome. PLoS Biol 2: e391. [DOI] [PMC free article] [PubMed] [Google Scholar]
- Bahn JH, Lee JH, Li G, Greer C, Peng G, Xiao X 2012. Accurate identification of A-to-I RNA editing in human by transcriptome sequencing. Genome Res 22: 142–150 [DOI] [PMC free article] [PubMed] [Google Scholar]
- Barretina J, Caponigro G, Stransky N, Venkatesan K, Margolin AA, Kim S, Wilson CJ, Lehar J, Kryukov GV, Sonkin D, et al. 2012. The Cancer Cell Line Encyclopedia enables predictive modelling of anticancer drug sensitivity. Nature 483: 603–607 [DOI] [PMC free article] [PubMed] [Google Scholar]
- Bass BL 2002. RNA editing by adenosine deaminases that act on RNA. Annu Rev Biochem 71: 817–846 [DOI] [PMC free article] [PubMed] [Google Scholar]
- Beghini A, Ripamonti CB, Peterlongo P, Roversi G, Cairoli R, Morra E, Larizza L 2000. RNA hyperediting and alternative splicing of hematopoietic cell phosphatase (PTPN6) gene in acute myeloid leukemia. Hum Mol Genet 9: 2297–2304 [DOI] [PubMed] [Google Scholar]
- Bhogal B, Jepson JE, Savva YA, Pepper AS, Reenan RA, Jongens TA 2011. Modulation of dADAR-dependent RNA editing by the Drosophila fragile X mental retardation protein. Nat Neurosci 14: 1517–1524 [DOI] [PMC free article] [PubMed] [Google Scholar]
- Dominguez C, Fisette JF, Chabot B, Allain FH 2010. Structural basis of G-tract recognition and encaging by hnRNP F quasi-RRMs. Nat Struct Mol Biol 17: 853–861 [DOI] [PubMed] [Google Scholar]
- Eisenberg E, Nemzer S, Kinar Y, Sorek R, Rechavi G, Levanon EY 2005. Is abundant A-to-I RNA editing primate-specific? Trends Genet 21: 77–81 [DOI] [PubMed] [Google Scholar]
- Emig D, Salomonis N, Baumbach J, Lengauer T, Conklin BR, Albrecht M 2010. AltAnalyze and DomainGraph: Analyzing and visualizing exon expression data. Nucleic Acids Res 38: W755–W762 [DOI] [PMC free article] [PubMed] [Google Scholar]
- Fairbrother WG, Yeo GW, Yeh R, Goldstein P, Mawson M, Sharp PA, Burge CB 2004. RESCUE-ESE identifies candidate exonic splicing enhancers in vertebrate exons. Nucleic Acids Res 32: W187–W190 [DOI] [PMC free article] [PubMed] [Google Scholar]
- Gaidatzis D, Jacobeit K, Oakeley EJ, Stadler MB 2009. Overestimation of alternative splicing caused by variable probe characteristics in exon arrays. Nucleic Acids Res 37: e107. [DOI] [PMC free article] [PubMed] [Google Scholar]
- Gao K, Masuda A, Matsuura T, Ohno K 2008. Human branch point consensus sequence is yUnAy. Nucleic Acids Res 36: 2257–2267 [DOI] [PMC free article] [PubMed] [Google Scholar]
- Goren A, Ram O, Amit M, Keren H, Lev-Maor G, Vig I, Pupko T, Ast G 2006. Comparative analysis identifies exonic splicing regulatory sequences—The complex definition of enhancers and silencers. Mol Cell 22: 769–781 [DOI] [PubMed] [Google Scholar]
- Grohmann M, Hammer P, Walther M, Paulmann N, Buttner A, Eisenmenger W, Baghai TC, Schule C, Rupprecht R, Bader M, et al. 2010. Alternative splicing and extensive RNA editing of human TPH2 transcripts. PloS ONE 5: e8956. [DOI] [PMC free article] [PubMed] [Google Scholar]
- Heale BSE, Keegan LP, McGurk L, Michlewski G, Brindle J, Stanton CM, Caceres JF, O’Connell MA 2009. Editing independent effects of ADARs on the miRNA/siRNA pathways. EMBO J 28: 3145–3156 [DOI] [PMC free article] [PubMed] [Google Scholar]
- Hekkelman ML, Te Beek TA, Pettifer SR, Thorne D, Attwood TK, Vriend G 2010. WIWS: A protein structure bioinformatics Web service collection. Nucleic Acids Res 38: W719–W723 [DOI] [PMC free article] [PubMed] [Google Scholar]
- Higuchi M, Maas S, Single FN, Hartner J, Rozov A, Burnashev N, Feldmeyer D, Sprengel R, Seeburg PH 2000. Point mutation in an AMPA receptor gene rescues lethality in mice deficient in the RNA-editing enzyme ADAR2. Nature 406: 78–81 [DOI] [PubMed] [Google Scholar]
- Huang da W, Sherman BT, Lempicki RA 2009. Systematic and integrative analysis of large gene lists using DAVID bioinformatics resources. Nat Protoc 4: 44–57 [DOI] [PubMed] [Google Scholar]
- Huelga SC, Vu AQ, Arnold JD, Liang TY, Liu PP, Yan BY, Donohue JP, Shiue L, Hoon S, Brenner S, et al. 2012. Integrative genome-wide analysis reveals cooperative regulation of alternative splicing by hnRNP proteins. Cell Rep 1: 167–178 [DOI] [PMC free article] [PubMed] [Google Scholar]
- Hundley HA, Bass BL 2010. ADAR editing in double-stranded UTRs and other noncoding RNA sequences. Trends Biochem Sci 35: 377–383 [DOI] [PMC free article] [PubMed] [Google Scholar]
- Irimia M, Denuc A, Ferran JL, Pernaute B, Puelles L, Roy SW, Garcia-Fernàndez J, Marfany G 2012. Evolutionarily conserved A-to-I editing increases protein stability of the alternative splicing factor Nova1. RNA Biol 9: 12–21 [DOI] [PubMed] [Google Scholar]
- Jiang Q, Crews LA, Barrett CL, Chun HJ, Court AC, Isquith JM, Zipeto MA, Goff DJ, Minden M, Sadarangani A, et al. 2013. ADAR1 promotes malignant progenitor reprogramming in chronic myeloid leukemia. Proc Natl Acad Sci 110: 1041–1046 [DOI] [PMC free article] [PubMed] [Google Scholar]
- Jin Y, Tian N, Cao J, Liang J, Yang Z, Lv J 2007. RNA editing and alternative splicing of the insect nAChR subunit α6 transcript: Evolutionary conservation, divergence and regulation. BMC Evol Biol 7: 98. [DOI] [PMC free article] [PubMed] [Google Scholar]
- Karolchik D, Hinrichs AS, Furey TS, Roskin KM, Sugnet CW, Haussler D, Kent WJ 2004. The UCSC Table Browser data retrieval tool. Nucleic Acids Res 32: D493–D496 [DOI] [PMC free article] [PubMed] [Google Scholar]
- Kent WJ 2002. BLAT—the BLAST-like alignment tool. Genome Res 12: 656–664 [DOI] [PMC free article] [PubMed] [Google Scholar]
- Keren H, Lev-Maor G, Ast G 2010. Alternative splicing and evolution: Diversification, exon definition and function. Nat Rev Genet 11: 345–355 [DOI] [PubMed] [Google Scholar]
- Kim DDY, Kim TTY, Walsh T, Kobayashi Y, Matise TC, Buyske S, Gabriel A 2004. Widespread RNA editing of embedded alu elements in the human transcriptome. Genome Res 14: 1719–1725 [DOI] [PMC free article] [PubMed] [Google Scholar]
- Kiran A, Baranov PV 2010. DARNED: A DAtabase of RNa EDiting in humans. Bioinformatics 26: 1772–1776 [DOI] [PubMed] [Google Scholar]
- Koboldt DC, Chen K, Wylie T, Larson DE, McLellan MD, Mardis ER, Weinstock GM, Wilson RK, Ding L 2009. VarScan: Variant detection in massively parallel sequencing of individual and pooled samples. Bioinformatics 25: 2283–2285 [DOI] [PMC free article] [PubMed] [Google Scholar]
- Kol G, Lev-Maor G, Ast G 2005. Human–mouse comparative analysis reveals that branch-site plasticity contributes to splicing regulation. Hum Mol Genet 14: 1559–1568 [DOI] [PubMed] [Google Scholar]
- Lalli E, Ohe K, Latorre E, Bianchi ME, Sassone-Corsi P 2003. Sexy splicing: Regulatory interplays governing sex determination from Drosophila to mammals. J Cell Sci 116: 441–445 [DOI] [PubMed] [Google Scholar]
- Laurencikiene J, Kallman AM, Fong N, Bentley DL, Ohman M 2006. RNA editing and alternative splicing: The importance of co-transcriptional coordination. EMBO Rep 7: 303–307 [DOI] [PMC free article] [PubMed] [Google Scholar]
- Levanon EY, Eisenberg E, Yelin R, Nemzer S, Hallegger M, Shemesh R, Fligelman ZY, Shoshan A, Pollock SR, Sztybel D, et al. 2004. Systematic identification of abundant A-to-I editing sites in the human transcriptome. Nat Biotechnol 22: 1001–1005 [DOI] [PubMed] [Google Scholar]
- Levanon K, Eisenberg E, Rechavi G, Levanon EY 2005. Adenosine-to-inosine RNA editing in Alu repeats in the human genome. EMBO Rep 6: 831–835 [DOI] [PMC free article] [PubMed] [Google Scholar]
- Lev-Maor G, Sorek R, Levanon EY, Paz N, Eisenberg E, Ast G 2007. RNA-editing-mediated exon evolution. Genome Biol 8: R29. [DOI] [PMC free article] [PubMed] [Google Scholar]
- Lev-Maor G, Ram O, Kim E, Sela N, Goren A, Levanon EY, Ast G 2008. Intronic Alus influence alternative splicing. PLoS Genet 4: e1000204. [DOI] [PMC free article] [PubMed] [Google Scholar]
- Li H, Handsaker B, Wysoker A, Fennell T, Ruan J, Homer N, Marth G, Abecasis G, Durbin R 2009a. The Sequence Alignment/Map format and SAMtools. Bioinformatics 25: 2078–2079 [DOI] [PMC free article] [PubMed] [Google Scholar]
- Li JB, Levanon EY, Yoon JK, Aach J, Xie B, Leproust E, Zhang K, Gao Y, Church GM 2009b. Genome-wide identification of human RNA editing sites by parallel DNA capturing and sequencing. Science 324: 1210–1213 [DOI] [PubMed] [Google Scholar]
- Li JB, Levanon EY, Yoon JK, Aach J, Xie B, Leproust E, Zhang K, Gao Y, Church GM 2009c. Genome-wide identification of human RNA editing sites by parallel DNA capturing and sequencing. Science 324: 1210–1213 [DOI] [PubMed] [Google Scholar]
- Licatalosi DD, Darnell RB 2010. RNA processing and its regulation: Global insights into biological networks. Nat Rev Genet 11: 75–87 [DOI] [PMC free article] [PubMed] [Google Scholar]
- Lin L, Shen S, Tye A, Cai JJ, Jiang P, Davidson BL, Xing Y 2008. Diverse splicing patterns of exonized Alu elements in human tissues. PLoS Genet 4: e1000225. [DOI] [PMC free article] [PubMed] [Google Scholar]
- Lozzio CB, Lozzio BB 1975. Human chronic myelogenous leukemia cell-line with positive Philadelphia chromosome. Blood 45: 321–334 [PubMed] [Google Scholar]
- Lunde BM, Moore C, Varani G 2007. RNA-binding proteins: Modular design for efficient function. Nat Rev Mol Cell Biol 8: 479–490 [DOI] [PMC free article] [PubMed] [Google Scholar]
- Maas S, Patt S, Schrey M, Rich A 2001. Underediting of glutamate receptor GluR-B mRNA in malignant gliomas. Proc Natl Acad Sci 98: 14687–14692 [DOI] [PMC free article] [PubMed] [Google Scholar]
- Maas S, Kawahara Y, Tamburro KM, Nishikura K 2006. A-to-I RNA editing and human disease. RNA Biol 3: 1–9 [DOI] [PMC free article] [PubMed] [Google Scholar]
- Mane SP, Evans C, Cooper KL, Crasta OR, Folkerts O, Hutchison SK, Harkins TT, Thierry-Mieg D, Thierry-Mieg J, Jensen RV 2009. Transcriptome sequencing of the Microarray Quality Control (MAQC) RNA reference samples using next generation sequencing. BMC Genomics 10: 264. [DOI] [PMC free article] [PubMed] [Google Scholar]
- Martinez-Contreras R, Fisette JF, Nasim FU, Madden R, Cordeau M, Chabot B 2006. Intronic binding sites for hnRNP A/B and hnRNP F/H proteins stimulate pre-mRNA splicing. PLoS Biol 4: e21. [DOI] [PMC free article] [PubMed] [Google Scholar]
- Maydanovych O, Beal PA 2006. Breaking the central dogma by RNA editing. Chem Rev 106: 3397–3411 [DOI] [PubMed] [Google Scholar]
- Meacham F, Boffelli D, Dhahbi J, Martin DI, Singer M, Pachter L 2011. Identification and correction of systematic error in high-throughput sequence data. BMC Bioinformatics 12: 451. [DOI] [PMC free article] [PubMed] [Google Scholar]
- Nishikura K 2009. Functions and regulation of RNA editing by ADAR deaminases. Annu Rev Biochem 79: 321–349 [DOI] [PMC free article] [PubMed] [Google Scholar]
- Osenberg S, Paz Yaacov N, Safran M, Moshkovitz S, Shtrichman R, Sherf O, Jacob-Hirsch J, Keshet G, Amariglio N, Itskovitz-Eldor J, et al. 2010. Alu sequences in undifferentiated human embryonic stem cells display high levels of A-to-I RNA editing. PLoS ONE 5: e11173. [DOI] [PMC free article] [PubMed] [Google Scholar]
- Paz N, Levanon EY, Amariglio N, Heimberger AB, Ram Z, Constantini S, Barbash ZS, Adamsky K, Safran M, Hirschberg A, et al. 2007. Altered adenosine-to-inosine RNA editing in human cancer. Genome Res 17: 1586–1595 [DOI] [PMC free article] [PubMed] [Google Scholar]
- Paz-Yaacov N, Levanon EY, Nevo E, Kinar Y, Harmelin A, Jacob-Hirsch J, Amariglio N, Eisenberg E, Rechavi G 2010. Adenosine-to-inosine RNA editing shapes transcriptome diversity in primates. Proc Natl Acad Sci 107: 12174–12179 [DOI] [PMC free article] [PubMed] [Google Scholar]
- Peng Z, Cheng Y, Tan BC, Kang L, Tian Z, Zhu Y, Zhang W, Liang Y, Hu X, Tan X, et al. 2012. Comprehensive analysis of RNA-seq data reveals extensive RNA editing in a human transcriptome. Nat Biotechnol 30: 253–260 [DOI] [PubMed] [Google Scholar]
- Pervouchine DD, Khrameeva EE, Pichugina MY, Nikolaienko OV, Gelfand MS, Rubtsov PM, Mironov AA 2011. Evidence for widespread association of mammalian splicing and conserved long-range RNA structures. RNA 18: 1–15 [DOI] [PMC free article] [PubMed] [Google Scholar]
- Piva F, Giulietti M, Nocchi L, Principato G 2009. SpliceAid: A database of experimental RNA target motifs bound by splicing proteins in humans. Bioinformatics 25: 1211–1213 [DOI] [PubMed] [Google Scholar]
- Prasanth KV, Prasanth SG, Xuan Z, Hearn S, Freier SM, Bennett CF, Zhang MQ, Spector DL 2005. Regulating gene expression through RNA nuclear retention. Cell 123: 249–263 [DOI] [PubMed] [Google Scholar]
- Pruitt KD, Tatusova T, Maglott DR 2007. NCBI reference sequences (RefSeq): A curated non-redundant sequence database of genomes, transcripts and proteins. Nucleic Acids Res 35: D61–D65 [DOI] [PMC free article] [PubMed] [Google Scholar]
- Quinlan AR, Hall IM 2010. BEDTools: A flexible suite of utilities for comparing genomic features. Bioinformatics 26: 841–842 [DOI] [PMC free article] [PubMed] [Google Scholar]
- Raitskin O, Cho DS, Sperling J, Nishikura K, Sperling R 2001. RNA editing activity is associated with splicing factors in lnRNP particles: The nuclear pre-mRNA processing machinery. Proc Natl Acad Sci 98: 6571–6576 [DOI] [PMC free article] [PubMed] [Google Scholar]
- Ramaswami G, Lin W, Piskol R, Tan MH, Davis C, Li JB 2012. Accurate identification of human Alu and non-Alu RNA editing sites. Nat Methods 9: 579–581 [DOI] [PMC free article] [PubMed] [Google Scholar]
- The R Core Team 2012. R: A language and environment for statistical computing. http://cran.r-project.org/doc/manuals/refman.pdf R Foundation for Statistical Computing, Vienna, Austria [Google Scholar]
- Riedmann EM, Schopoff S, Hartner JC, Jantsch MF 2008. Specificity of ADAR-mediated RNA editing in newly identified targets. RNA 14: 1110–1118 [DOI] [PMC free article] [PubMed] [Google Scholar]
- Rueter SM, Dawson TR, Emeson RB 1999. Regulation of alternative splicing by RNA editing. Nature 399: 75–80 [DOI] [PubMed] [Google Scholar]
- Ryman K, Fong N, Bratt E, Bentley DL, Ohman M 2007. The C-terminal domain of RNA Pol II helps ensure that editing precedes splicing of the GluR-B transcript. RNA 13: 1071–1078 [DOI] [PMC free article] [PubMed] [Google Scholar]
- Salmon-Divon M, Dvinge H, Tammoja K, Bertone P 2010. PeakAnalyzer: Genome-wide annotation of chromatin binding and modification loci. BMC Bioinformatics 11: 415. [DOI] [PMC free article] [PubMed] [Google Scholar]
- Salomonis N, Schlieve CR, Pereira L, Wahlquist C, Colas A, Zambon AC, Vranizan K, Spindler MJ, Pico AR, Cline MS, et al. 2010. Alternative splicing regulates mouse embryonic stem cell pluripotency and differentiation. Proc Natl Acad Sci 107: 10514–10519 [DOI] [PMC free article] [PubMed] [Google Scholar]
- Scadden ADJ 2005. The RISC subunit Tudor-SN binds to hyper-edited double-stranded RNA and promotes its cleavage. Nat Struct Mol Biol 12: 489–496 [DOI] [PubMed] [Google Scholar]
- Schoft VK, Schopoff S, Jantsch MF 2007. Regulation of glutamate receptor B pre-mRNA splicing by RNA editing. Nucleic Acids Res 35: 3723–3732 [DOI] [PMC free article] [PubMed] [Google Scholar]
- Schwartz SH, Silva J, Burstein D, Pupko T, Eyras E, Ast G 2008. Large-scale comparative analysis of splicing signals and their corresponding splicing factors in eukaryotes. Genome Res 18: 88–103 [DOI] [PMC free article] [PubMed] [Google Scholar]
- Schwartz S, Gal-Mark N, Kfir N, Oren R, Kim E, Ast G 2009a. Alu exonization events reveal features required for precise recognition of exons by the splicing machinery. PLoS Comput Biol 5: e1000300. [DOI] [PMC free article] [PubMed] [Google Scholar]
- Schwartz S, Hall E, Ast G 2009b. SROOGLE: Webserver for integrative, user-friendly visualization of splicing signals. Nucleic Acids Res 37: W189–W192 [DOI] [PMC free article] [PubMed] [Google Scholar]
- Shah SP, Morin RD, Khattra J, Prentice L, Pugh T, Burleigh A, Delaney A, Gelmon K, Guliany R, Senz J, et al. 2009. Mutational evolution in a lobular breast tumour profiled at single nucleotide resolution. Nature 461: 809–813 [DOI] [PubMed] [Google Scholar]
- Shen S, Lin L, Cai JJ, Jiang P, Kenkel EJ, Stroik MR, Sato S, Davidson BL, Xing Y 2011. Widespread establishment and regulatory impact of Alu exons in human genes. Proc Natl Acad Sci 108: 2837–2842 [DOI] [PMC free article] [PubMed] [Google Scholar]
- Shepard PJ, Hertel KJ 2008. Conserved RNA secondary structures promote alternative splicing. RNA 14: 1463–1469 [DOI] [PMC free article] [PubMed] [Google Scholar]
- Sherry ST, Ward MH, Kholodov M, Baker J, Phan L, Smigielski EM, Sirotkin K 2001. dbSNP: The NCBI database of genetic variation. Nucleic Acids Res 29: 308–311 [DOI] [PMC free article] [PubMed] [Google Scholar]
- Steinman RA, Yang Q, Gasparetto M, Robinson LJ, Liu X, Lenzner DE, Hou J, Smith C, Wang Q 2012. Deletion of the RNA-editing enzyme ADAR1 causes regression of established chronic myelogenous leukemia in mice. Int J Cancer 132: 1741–1750 [DOI] [PMC free article] [PubMed] [Google Scholar]
- Storey JD, Tibshirani R 2003. Statistical significance for genomewide studies. Proc Natl Acad Sci 100: 9440–9445 [DOI] [PMC free article] [PubMed] [Google Scholar]
- Sugnet CW, Kent WJ, Ares M, Haussler D 2004. Transcriptome and genome conservation of alternative splicing events in humans and mice. Pac Symp Biocomput 77: 66–77 [DOI] [PubMed] [Google Scholar]
- Trapnell C, Pachter L, Salzberg SL 2009. TopHat: Discovering splice junctions with RNA-seq. Bioinformatics 25: 1105–1111 [DOI] [PMC free article] [PubMed] [Google Scholar]
- Ule J, Ule A, Spencer J, Williams A, Hu JS, Cline M, Wang H, Clark T, Fraser C, Ruggiu M, et al. 2005. Nova regulates brain-specific splicing to shape the synapse. Nat Genet 37: 844–852 [DOI] [PubMed] [Google Scholar]
- Valadkhan S, Jaladat Y 2010. The spliceosomal proteome: At the heart of the largest cellular ribonucleoprotein machine. Proteomics 10: 4128–4141 [DOI] [PMC free article] [PubMed] [Google Scholar]
- Valente L, Nishikura K 2005. Progress in nucleic acid research and molecular biology, Vol. 79 Elsevier, New York: [DOI] [PubMed] [Google Scholar]
- Wahl MC, Will CL, Luhrmann R 2009. The spliceosome: Design principles of a dynamic RNP machine. Cell 136: 701–718 [DOI] [PubMed] [Google Scholar]
- Wang Z, Burge CB 2008. Splicing regulation: From a parts list of regulatory elements to an integrated splicing code. RNA 14: 802–813 [DOI] [PMC free article] [PubMed] [Google Scholar]
- Wang K, Li M, Hakonarson H 2010. ANNOVAR: Functional annotation of genetic variants from high-throughput sequencing data. Nucleic Acids Res 38: e164. [DOI] [PMC free article] [PubMed] [Google Scholar]
- Woolfe A, Mullikin JC, Elnitski L 2010. Genomic features defining exonic variants that modulate splicing. Genome Biol 11: R20. [DOI] [PMC free article] [PubMed] [Google Scholar]
- Zhang Z, Carmichael GG 2001. The fate of dsRNA in the nucleus: A p54nrb-containing complex mediates the nuclear retention of promiscuously A-to-I edited RNAs. Cell 106: 465–475 [DOI] [PubMed] [Google Scholar]
- Zhang C, Li WH, Krainer AR, Zhang MQ 2008a. RNA landscape of evolution for optimal exon and intron discrimination. Proc Natl Acad Sci 105: 5797–5802 [DOI] [PMC free article] [PubMed] [Google Scholar]
- Zhang Y, Liu T, Meyer CA, Eeckhoute J, Johnson DS, Bernstein BE, Nusbaum C, Myers RM, Brown M, Li W, et al. 2008b. Model-based analysis of ChIP-seq (MACS). Genome Biol 9: R137. [DOI] [PMC free article] [PubMed] [Google Scholar]