The 69-nt RNA-OUT, which represses transposase expression from the RNA-IN mRNA of insertion sequence IS10, was one of the first regulatory antisense RNAs to be described. In a previous study, Haniford and colleagues reported the surprising observation that the RNA chaperone protein Hfq, thought to be required for the functions of trans-encoded base-pairing RNAs but not antisense RNAs, impacts transposition and transposase repression. In this study, the Hfq surfaces involved in RNA-OUT and RNA-IN binding and the structural changes brought about by Hfq were examined in more detail. The observations lead to models for how Hfq facilitates base-pairing of the two RNAs.
Keywords: Tn10/IS10, cis-sRNA, Hfq, antisense RNA, RNA-IN, RNA-OUT
Abstract
Hfq functions in post-transcriptional gene regulation in a wide range of bacteria, usually by promoting base-pairing of mRNAs and trans-encoded sRNAs that share partial sequence complementarity. It is less clear if Hfq is required for pairing of cis-encoded RNAs (i.e., antisense RNAs) with their target mRNAs. In the current work, we have characterized the interactions between Escherichia coli Hfq and the components of the Tn10/IS10 antisense system, RNA-IN and RNA-OUT. We show that Hfq interacts with RNA-OUT through its proximal RNA-binding surface, as is typical for Hfq and trans-encoded sRNAs. In contrast, RNA-IN binds both proximal and distal RNA-binding surfaces in Hfq with a higher affinity for the latter, as is typical for mRNA interactions in canonical sRNA-mRNA pairs. Importantly, an amino acid substitution in Hfq that interferes with RNA binding to the proximal site negatively impacts RNA-IN:OUT pairing in vitro and suppresses the ability of Hfq to negatively regulate IS10 transposition in vivo. We also show that Hfq binding to RNA-IN and RNA-OUT alters secondary structure elements in both of these RNAs and speculate that this could be important in how Hfq facilitates RNA-IN:OUT pairing. Based on the results presented here, we suggest that Hfq could be involved in regulating RNA pairing in other antisense systems, including systems encoded by other transposable elements.
INTRODUCTION
Small RNAs (sRNAs) have emerged as important components of gene expression regulatory networks in bacteria. sRNAs generally function by base-pairing to mRNAs with which they share at least partial sequence complementarity. Base-pairing between sRNAs and mRNAs typically influences translation and/or stability of the mRNA (for reviews, see Gottesman and Storz 2011; Vogel and Luisi 2011). sRNAs are categorized as either trans- or cis-encoded. Trans-encoded sRNAs are expressed from distinct loci relative to the transcripts they regulate, whereas cis-encoded sRNAs are expressed from the strand opposite their target mRNA and, consequently, are perfectly complementary to at least a portion of their target RNA (Fig. 1A). Cis-encoded sRNAs are also referred to as antisense RNAs (or asRNA). The regulation imposed by many trans-encoded sRNAs is dependent on the protein Hfq, an Sm-family protein that is present in many bacterial species. With regard to sRNA-based regulation, Hfq functions by promoting the pairing of sRNAs to their target mRNAs (Moller et al. 2002; Zhang et al. 2002; Vogel and Luisi 2011). The expression of many trans-encoded sRNAs is up-regulated by environmental stress, and typically this imposes a biological response to stress through Hfq-mediated pairing of sRNAs and their target mRNAs (Altuvia et al. 1997; Vogel and Papenfort 2006).
FIGURE 1.
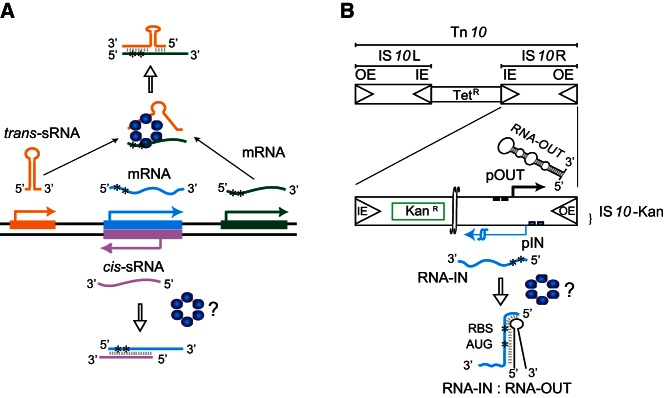
Small regulatory RNAs (sRNAs) and the Tn10/IS10 antisense system. (A) Cis- vs. trans-encoded sRNAs. Transcribed strands of three different genes and their corresponding RNAs (color coded) are shown. Pairing of a trans-sRNA (gold) and an mRNA (green) and of a cis-sRNA (pink) and an mRNA (cyan) is shown. Hfq (blue hexamer) catalyzes pairing in the former case where there is partial sequence complementarity between partners, but it is unclear if it also catalyzes pairing in the latter case where there is perfect sequence complementarity between partners. Asterisks (*) define the translation initiation region (TIR) of the mRNAs. (B) Structure of Tn10 and IS10-Kan. Tn10 is a 9147-bp composite transposon that confers tetracycline resistance (TetR). Tn10 is comprised of IS10-Left and IS10-Right, the latter of which encodes a functional transposase protein that catalyzes DNA cleavage and joining events involving the “outside” (OE) and “inside” (IE) ends. The transposase mRNA (RNA-IN) is encoded from the promoter pIN (blue squares). A second promoter (pOUT–black squares) within IS10-Right encodes a cis-sRNA (also referred to as an antisense RNA), RNA-OUT. To follow transposition of IS10-Right in E. coli, a KanR gene cassette was cloned into IS10-Right, creating IS10-Kan. RNA-OUT is depicted as a stable stem–loop structure (black) and RNA-IN is depicted as a blue line with asterisks defining the TIR. RNA-OUT is known to pair with RNA-IN, and this inhibits translation of RNA-IN, thereby down-regulating transposition. Hfq can enhance the rate of RNA-IN:OUT pairing in vitro, but it is not known if Hfq plays a role in this antisense system in vivo.
asRNAs were originally found on extrachromosomal DNAs, such as plasmids and transposons. Chromosomally encoded asRNAs have since been identified, although a subset of these is imbedded within mobile DNA elements that have recently been acquired (e.g., pathogenicity islands). The general perception is that, due to the perfect complementarity between asRNAs and their targets, the regulatory function of asRNAs will not be dependent on Hfq (Waters and Storz 2009).
Tn10/IS10 (Fig. 1B) encodes a 69-nt asRNA (RNA-OUT) that regulates transposase expression by pairing with the transposase mRNA (RNA-IN). This pairing down-regulates transposase translation by sequestering the 5′ translational initiation region (TIR) from the ribosome, thereby limiting transposase translation (Simons and Kleckner 1983; Ma and Simons 1990). We recently demonstrated that the frequency of Tn10/IS10 transposition from a multicopy plasmid is greatly increased in an hfq− strain of Escherichia coli, thereby implicating Hfq as a potent negative regulator of Tn10/IS10 transposition (Ross et al. 2010). The Hfq-effect was much less robust in a system with reduced RNA-OUT levels, suggesting that Hfq functions, in part, through antisense regulation. Transposase expression from a translational fusion was also found to increase in the hfq− background, consistent with a post-transcriptional role for Hfq in transposase regulation. Furthermore, studies in vitro demonstrated that Hfq bound both RNA-IN and RNA-OUT and increased the rate at which these molecules pair. Taken together, these results are consistent with Hfq playing an important role in translational regulation mediated by an asRNA (Ross et al. 2010).
The finding that Hfq participates in a regulatory system involving an asRNA raises questions regarding the mechanism through which Hfq acts in this system and invites comparisons to its mechanism of action in trans-sRNA regulated systems. Hfq readily forms a hexamer, and the hexameric unit possesses at least two RNA binding sites. These sites, referred to as the proximal and distal binding sites, are located on opposing surfaces of the toroidal structure of the hexamer. Structure-based design of mutations in the proximal and distal binding sites has been important in defining the RNA binding specificities of these sites. The proximal site mutation K56A blocks Hfq binding to U-rich trans-sRNAs, thereby implicating the proximal site as the trans-sRNA binding site. In contrast, the Y25A mutation impairs Hfq binding to A-rich RNAs as well as mRNAs, thereby implicating the distal site in mRNA binding (Mikulecky et al. 2004; Brennan and Link 2007; Olejniczak 2011).
In the current work, we have further evaluated the interactions between E. coli Hfq and Tn10/IS10-encoded RNA-IN and RNA-OUT and have begun to evaluate the importance of these interactions with respect to the function of the asRNA system of this transposon.
RESULTS
Hfq binds RNA-IN approximately 80-fold more tightly than RNA-OUT
In previous work, we demonstrated using EMSA that E. coli Hfq binds RNA-IN and RNA-OUT (Ross et al. 2010). Our initial objective in the current work was to quantify the binding strength of these interactions to facilitate comparison with previously defined trans-sRNA/mRNA partners whose pairing is catalyzed by Hfq. Toward this end, we prepared 32P-labeled RNA-OUT (69 nt + 2 extra nucleotides encoded by the expression construct) and a truncated form of RNA-IN (the first 160 nt) by in vitro transcription and individually mixed each of these RNAs (∼0.1 nM) with purified Hfq over a broad range of Hfq concentrations. Binding reactions were then analyzed on a 6% polyacrylamide gel.
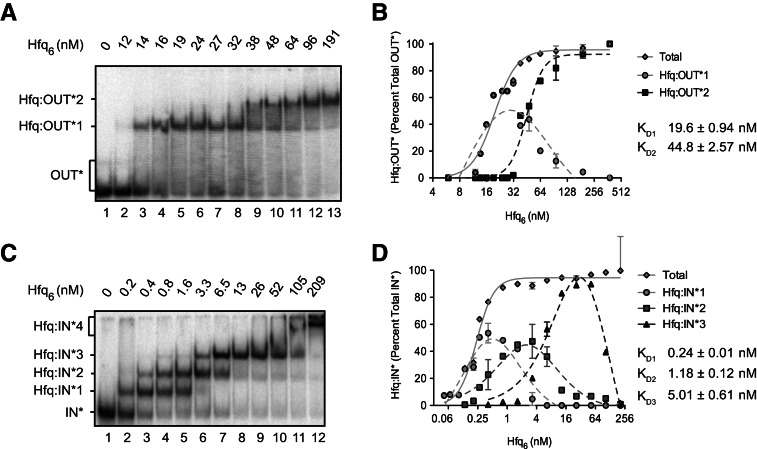
We show in Figure 2A that two distinct Hfq-bound RNA-OUT complexes were generated in our “Hfq titration.” Just under 50% of the input RNA was shifted to a reduced mobility (Hfq:OUT-1) at an Hfq concentration of 14 nM (lane 3). At 38 nM Hfq (lane 9), a second complex (Hfq:OUT-2) was detected, and at 48 nM, Hfq:OUT-2 and Hfq:OUT-1 were present at close to a 1:1 ratio. Apparent dissociation constants KD1 and KD2, for Hfq:OUT-1 and Hfq:OUT-2, respectively, are 19.6 and 44.8 nM, calculated per Hfq hexamer (Fig. 2B; Table 1).
FIGURE 2.
Hfq binds with high and moderate affinities to RNA-IN and RNA-OUT in vitro. 32P-labeled RNA-OUT (A) or RNA-IN (C) was mixed with varying concentrations (reported per hexamer) of purified Hfq protein, and reactions were subject to EMSA as described in Materials and Methods. Band intensities were quantified (ImageQuant), and the percent of each shifted species (relative to total labeled RNA) was plotted vs. Hfq6 concentration (B,D). RNA-OUT formed two complexes with Hfq, Hfq:OUT*1, and Hfq:OUT*2. RNA-IN formed four complexes with Hfq, Hfq:IN*1, Hfq:IN*2, Hfq:IN*3, and Hfq:IN*4. Apparent dissociation constants (KD) are indicated; see Table 1 for a summary of KD values and Hill coefficients determined in this study. RNA-OUT and RNA-IN were present at a final concentration of ∼0.1 nM. Error bars represent standard error from two experiments. KD is reported ± standard error.
TABLE 1.
In vitro binding of RNA-OUT or RNA-IN to WT, distal- or proximal-impaired Hfq mutants

We show in Figure 2C that Hfq also formed multiple complexes (four distinct species) with RNA-IN-160. Hfq:IN-1 formed at the lowest Hfq concentration in the titration. The apparent KD for this complex is ∼0.24 nM per hexamer (Fig. 2D; Table 1). This represents an 81-fold higher affinity relative to Hfq binding to RNA-OUT. At higher Hfq concentrations, additional Hfq:IN complexes were formed (Hfq:IN-2; Hfq:IN-3 and Hfq:IN-4). It appears as though Hfq:IN-2 was generated from Hfq:IN-1, Hfq:IN-3 was generated from Hfq:IN-2, and Hfq:IN-4 was generated from Hfq:IN-3, as the appearance of each of these species coincided with the reduction in the amount of the species with the next highest gel mobility. The apparent KD and Hill coefficient for each Hfq:RNA complex is summarized in Table 1.
Supershifting in the above experiments can most easily be explained by each of the RNAs having multiple Hfq binding sites with different affinities. Detection of supershifting over a narrower Hfq concentration range for RNA-OUT vs. RNA-IN (reflected in the higher Hill coefficient) is consistent with a higher degree of cooperativity in the former.
RNase and hydroxyl radical footprinting of RNA-IN, RNA-OUT, and Hfq:RNA complexes
To further characterize Hfq:RNA-IN and Hfq:RNA-OUT interactions in vitro, we used a combination of hydroxyl radical and ribonuclease (RNase) footprinting. Hydroxyl radical and RNase footprinting have both been used to identify Hfq binding sites within target mRNA and sRNAs (Brescia et al. 2003; Lease and Woodson 2004; Vecerek et al. 2005; Rolle et al. 2006). RNase footprinting also provides insight into the structure of the RNA as well as structural changes in the RNA upon protein binding. Structure-probing techniques have not previously been applied to RNA-IN and RNA-OUT, although a model for RNA-OUT (Model I) was proposed based on predictions from in silico RNA folding programs and genetic data (see Fig. 3B; Case et al. 1989; Kittle et al. 1989).
FIGURE 3.
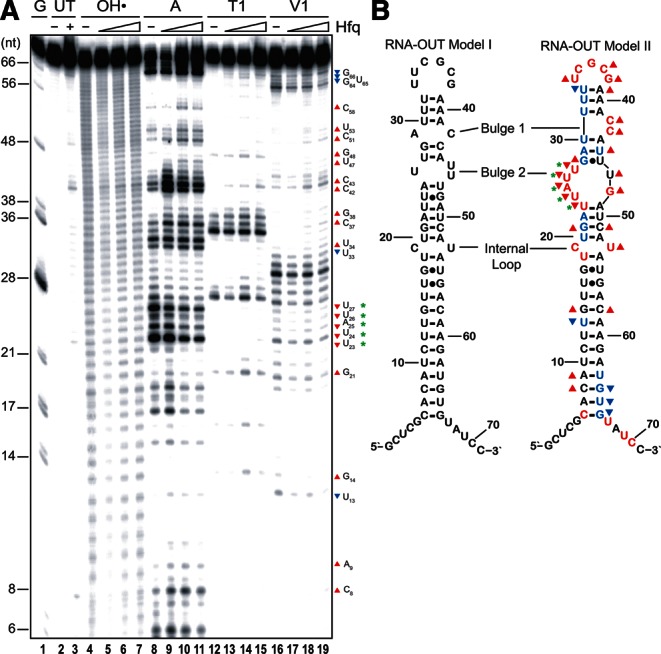
Structure-probe analysis of RNA-OUT and Hfq:RNA-OUT complex. (A) 32P-labeled RNA-OUT (65 nM) was incubated with or without Hfq as indicated before hydroxyl radical (lanes 4–7) or ribonuclease (A, T1, or V1; lanes 8–19) treatments. Reactions, including untreated RNA (lanes 2,3) and a G-ladder (lane 1), were analyzed on a 10% denaturing polyacrylamide gel. Nucleotide labeling is relative to the RNA-OUT in vitro transcriptional start site, which includes two extra nucleotides introduced by T7 RNA polymerase at the 5′ end of the RNA. Where Hfq was included, it was present at 1460, 2190, and 4380 nM. (B) A previous model of RNA-OUT (Model I) is compared to the model derived from the current work (Model II). Colored letters represent RNase-sensitive positions in RNA-OUT observed in the absence of Hfq. Red indicates cleavage by either RNase A or T1, while blue indicates cleavage by RNase V1. Symbols (triangles and asterisks) are defined in the text.
For RNase structure probing/footprinting, 5′ end-labeled RNA-OUT was treated with either RNase A, T1, or V1 in the presence or absence of purified Hfq protein. RNase A and T1 cleave RNA following single-stranded C/U and G, respectively, while RNase V1 cleaves 3′ of paired nucleotides.
RNase probing of RNA-OUT yielded a predicted structure similar to what has been previously proposed (Fig. 3B). However, our data support some modifications to this model (see Fig. 3A,B; note that ribonuclease-sensitive residues in Model II are colored red for A or T1 and blue for V1). U33, which was previously predicted to be in the unpaired loop, exhibited moderate sensitivity to V1 and relatively low sensitivity to A, suggesting that this residue is base-paired, presumably to A39. C42 and C43 were both strongly sensitive to A, and this is consistent with a 2-nt bulge (bulge 1) in the 3′ side of the stem, immediately adjacent to the loop. Also, in Model II, bulge 2 is larger than in Model I, consisting of six as opposed to three unpaired residues. This is supported by sensitivity of U24, A25, U26, and U27 to A and low sensitivity of G48 to T1. Additionally, for 14 of the 23 bp in the predicted stem, at least 1 nt in the pair showed sensitivity to V1, and only 2 bp had 1 nt that was sensitive to A. The V1-sensitive residues appeared in all four segments of the stem that are separated by bulges. In contrast, no residues in the loop or bulges exhibited V1 sensitivity.
Addition of Hfq to RNA-OUT caused some significant changes in the RNase cleavage profile (indicated by upward and downward pointing triangles in Fig. 3A, B). In this experiment, Hfq was added to RNA-OUT at concentrations sufficient (based on EMSA data) (Supplemental Fig. S1A) to give >90% Hfq:OUT-1 (1460 nM) and >90% Hfq:OUT-2 (2190 and 4380 nM). Based on similarities of sample loading and total reactivity relative to the “no Hfq” control, results for the “intermediate” Hfq concentration (2190 nM—lanes 10, 14, and 18) were the easiest to analyze and are discussed in detail below.
Hfq binding appears to destabilize the base-paired stem of RNA-OUT. All four of the stem regions contained residues that increased in sensitivity to single-strand-specific ribonuclease (upward facing red triangles), and the lower stem also contained residues that exhibited reduced sensitivity to double-strand-specific ribonuclease (downward facing blue triangles). Destabilization of the stem by Hfq could be functionally significant because the 5′ portion of the stem, including residues 6–33, is expected to pair with RNA-IN in the antisense response.
Interestingly, of the predicted 15 unpaired residues in RNA-OUT, eight exhibited increased reactivity to single-strand-specific ribonucleases. While it is not obvious how to interpret this result, perhaps the simplest explanation is that Hfq binding to RNA-OUT prevents conversion of loops and/or bulges to structures that include base-paired regions.
Finally, a stretch of five consecutive residues in bulge 2 (nucleotides 23–27) exhibited a decrease in sensitivity to all three RNases (green asterisks). This suppression could result from Hfq binding to this segment. Notably, this is a very U-rich sequence (5′ UUAUUG 3′) that is predicted to be in single-stranded form. E. coli Hfq has been shown to preferentially bind U-rich single-stranded sequences in sRNAs through its proximal binding site (Ishikawa et al. 2012), and we provide evidence below that Hfq engages RNA-OUT exclusively through its proximal binding site (Fig. 6). Using data from our RNase probing of RNA-OUT in the presence of Hfq, we determined a single structure of an RNA-OUT:Hfq complex (Supplemental Fig. S3A). This predicted structure is largely single stranded, with the exception of 5 bp forming between nucleotides 29–33 and 59–63. Of the 35 nt that are predicted to base-pair with RNA-IN, 30 are in single-stranded regions after Hfq addition.
FIGURE 6.
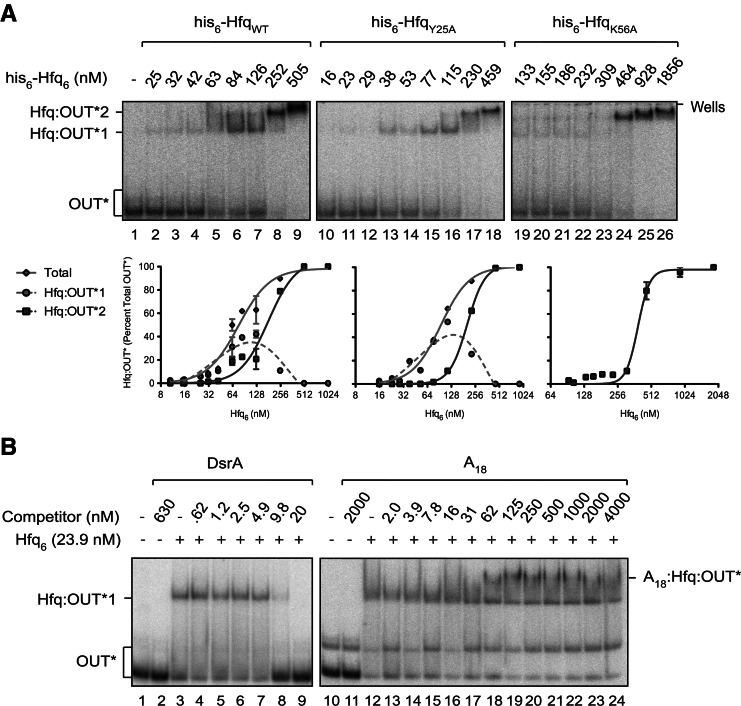
RNA-OUT interacts specifically with the proximal RNA-binding surface of Hfq. (A) EMSAs with 32P-labeled RNA-OUT (∼0.4 nM) and either WT or mutant forms of Hfq. HfqY25A is defective in RNA-binding at the distal site, and HfqK56A is defective in RNA-binding at the proximal site. The corresponding binding curves are presented below each gel image. Error bars represent standard error from two experiments. Note that all forms of Hfq used in this experiment possess a his6 epitope tag at their C termini. Species are labeled as in Figure 2. (B) EMSAs performed in the presence of competitor RNAs. HfqWT (untagged) was first mixed with various concentrations of DsrA or A18 RNA for 5 min, and 32P-labeled RNA-OUT (0.4 nM) was added. After an additional 15 min, reactions were subjected to polyacrylamide gel electrophoresis. A species expected to represent a ternary complex is labeled A18:Hfq:OUT*. IC50 values were calculated from curves shown in Supplemental Figure S4 and are reported in Table 2.
We also performed hydroxyl radical footprinting on Hfq:RNA-OUT complexes to further investigate the position(s) of Hfq binding (Fig. 3A, lanes 4–7) but were unable to see clear and reproducible patterns of protection. The hydroxyl radical cleavage pattern was, however, useful in assigning cleavage products produced in the RNase structure-probe experiments.
We next probed the structure of the first 160 nt of RNA-IN with RNases as described for RNA-OUT. In the absence of Hfq, there was a significant amount of reactivity to V1 nuclease (cf. lanes 2 and 11 in Fig. 4A), which is indicative of this RNA forming base-paired segments. Two regions in which V1-reactive residues clustered (residues 17–35 and 45–60) (indicated by a solid blue line in Fig. 4A) also showed minimal reactivity to single-strand-specific ribonucleases. Hard constraints from the nuclease data (circled letters in Fig. 4B) were input into the Mfold program to generate a model of RNA-IN-160 structure. Notably, addition of these hard constraints resulted in the output of a single structure. The model predicts one substantial stem that includes 11 bp and two bulges. The stem includes residues 25–36 on one strand and residues 45–60 on the other strand. At least 1 nt in each of the 11 predicted base pairs showed reactivity to V1. We note that our model for RNA-IN-160 includes some secondary structure involving the first 20 nt. However, the single base pair between position 6 and 149 is unlikely to maintain the most 5′ and 3′ portions of the RNA in a stable secondary structure. The absence of stable secondary structure within the first 8 nt of RNA-IN suggests that there is no structural impediment to initiating pairing with RNA-OUT. Of the first 35 nt of RNA-IN-160 that are complementary to RNA-OUT, residues 25–35 are sequestered in a stem that may interfere with the antisense response.
FIGURE 4.
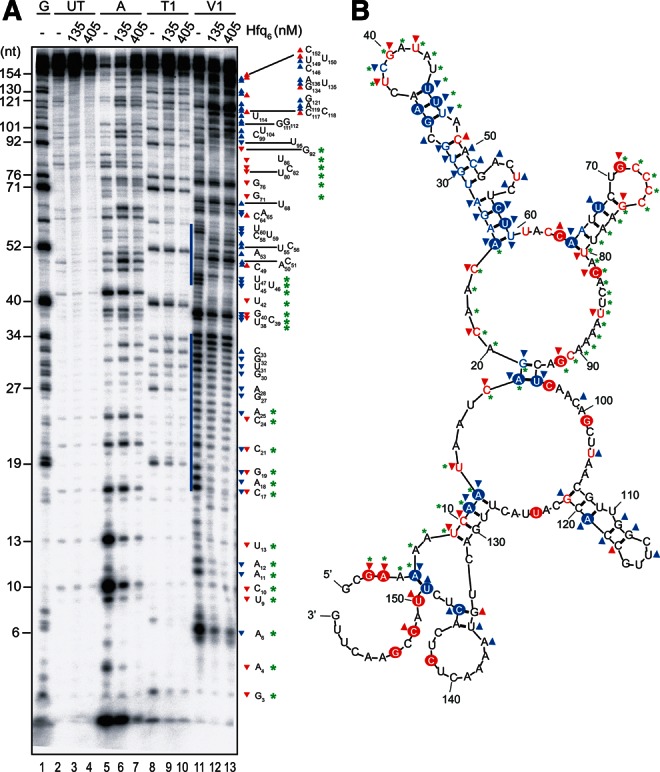
RNase footprinting of RNA-IN. (A) 32P-labeled RNA-IN-160 (45 nM) was incubated with or without Hfq as indicated before treatment with ribonuclease A, T1, or V1 (lanes 5–13). Reactions, including RNA not treated with RNase (lanes 2–4) and a G-ladder (lane 1), were analyzed on a 10% denaturing polyacrylamide gel. Nucleotide labeling is relative to the RNA-IN in vitro transcriptional start site, which is nucleotide 1. Blue bars highlight clusters of V1 sensitivity observed in the absence of Hfq. (B) A model is shown for the secondary structure of RNA-IN-160. The model was produced using Mfold with hard constraints (circled positions) obtained from two independent RNase structure-probe experiments (part A and Supplemental Fig. S2). RNase A/T1 cleavage is indicated with red letters, while V1 cleavage is indicated with blue letters. Symbols (triangles and asterisks) are defined in the text.
Addition of Hfq to RNA-IN-160 had substantial effects on RNA structure. Much of the V1 sensitivity in the predicted stem was lost (indicated by downward pointing blue triangles in Fig. 4A,B). Strikingly, starting at position 104 and continuing to position 149, there was a large increase in V1 sensitivity with the addition of Hfq. As there were few residues within the 104–149 segment that showed substantial increases in either A or T1 sensitivity upon Hfq addition, it appears likely that some intra-molecular base-pairing is occurring in this region. There were also a few regions that showed a decrease in reactivity to both single- and double-strand-specific ribonucleases. This includes segments 3–13, 17–25, 38–40, and 71–92 (denoted by green asterisks). These regions could define Hfq binding sites. Notably, at the highest concentration of Hfq used in this experiment, we anticipate, based on EMSA data (Supplemental Fig. S1B), that there could be as many as three distinct Hfq binding sites in RNA-IN-160. A predicted structure of RNA-IN-160 in the presence of Hfq is presented in Supplemental Figure S3B. Consistent with the RNase footprinting data, the first 98 nt of RNA-IN are mostly single-stranded, with two small hairpins formed at nucleotides 34–56 and 66–79. An extensive stem–loop structure is predicted to form from nucleotides 99–160. We note that 33 out of 35 nt of RNA-IN that are expected to base-pair with RNA-OUT are single-stranded in the presence of Hfq.
Note that RNase data for RNA-IN-160 footprinting comes from two independent experiments (Fig. 4A; Supplemental Fig. S2). All reactivities were reproducible except at positions C72–C75, where we saw Hfq-dependent protection of these residues only in the experiment shown in Supplemental Figure S2.
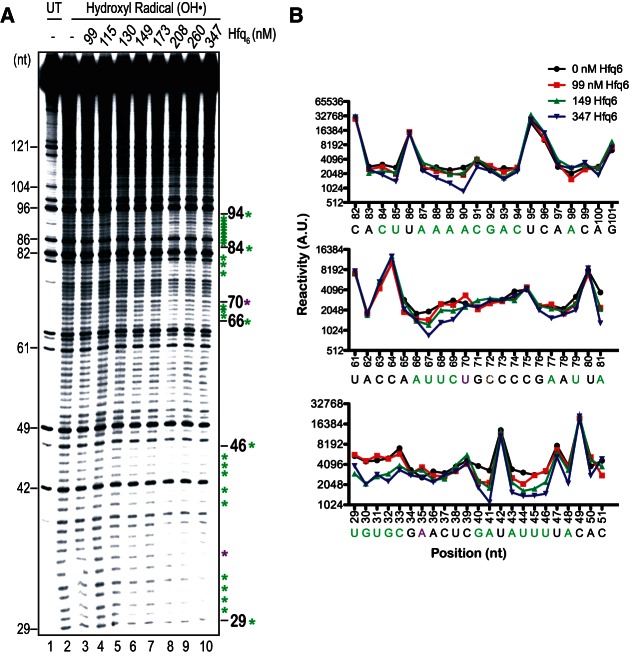
To further probe the location of Hfq binding sites in RNA-IN-160, we performed hydroxyl radical footprinting on 5′ end-labeled RNA-IN-160 using multiple Hfq concentrations (Fig. 5). Quantitation of portions of the gel image showing the greatest differences in band intensity for “no Hfq” (lane 2) and selected “plus Hfq” samples (lanes 3, 6, and 10) is also presented. A region spanning residues 29 to 46 showed protection against hydroxyl radical cleavage at both 149 nM and 347 nM Hfq. At the higher Hfq concentration, additional zones of protection were observed as indicated beside the gel image (green asterisks). Due to discontinuities in the patterns of protection it is difficult to infer the boundaries of individual binding sites and, therefore, the total number of sites. However, based on the density of protected residues in the 29–46 segment and the fact that there was uniform protection in this cluster at an intermediate Hfq concentration, we suggest that this cluster defines a single Hfq binding site. The region spanning residues 84 to 94 includes the second highest density of protected residues and could represent a second Hfq binding site. This second site would be a lower affinity site relative to the site within the nucleotide 29–46 segment, as protections in this site were only observed at the highest Hfq concentrations. Unfortunately, we were not able to obtain high-quality hydroxyl radical footprinting data for the most 5′ portion of RNA-IN-160 to further test the possibility raised by RNase footprinting that this segment also contains an Hfq binding site. We do note that five residues (38, 39, 40, 45, and 46) within segment 29–46 showed a general suppression of cleavage by RNases (Fig. 4A), as did residues 80, 82, and 86, which are close to or within segment 84–94, supporting the possibility that these segments include Hfq binding sites.
FIGURE 5.
Hydroxyl radical footprinting of RNA-IN. (A) 32P-labeled RNA-IN-160 (45 nM) was incubated with increasing concentrations of Hfq (lanes 3–10) and then subject to hydroxyl radical treatment (lanes 2–10). Lane 1 contains RNA not treated with hydroxyl radicals. Samples were analyzed as in Figure 4. Nucleotides are numbered as in Figure 4. Green asterisks identify positions protected from hydroxyl radical cleavage in the presence of Hfq, while purple asterisks identify positions where Hfq induced hypersensitivity to hydroxyl radical cleavage. (B) Quantification of band intensities from selected lanes of the gel image in part A is shown. Reactivity is presented in arbitrary units (AU).
RNA-binding sites in Hfq that interact with RNA-IN and RNA-OUT
Hfq has at least two distinct RNA-binding surfaces, enabling it to simultaneously bind multiple RNAs and catalyze trans-sRNA/mRNA pairing reactions. To gain insight into how Hfq interacts with RNA-IN and RNA-OUT, we performed experiments designed to define the surfaces in Hfq that interact with these RNAs. It should be recognized that Hfq binding determinants for an asRNA have not previously been reported. Two complementary approaches were used. In one approach, we performed binding assays with RNA-IN-160 or RNA-OUT and Hfq mutants that are defective in either proximal site (HfqK56A) or distal site (HfqY25A) RNA binding. In the second approach, we performed binding assays with HfqWT and RNA-IN-160 or RNA-OUT in the presence of competitor RNAs that exhibit high affinities for either the proximal (DsrA) or distal (A18) RNA-binding surfaces of Hfq.
For binding experiments with Y25A and K56A mutant forms of Hfq, it was necessary to use Hfq bearing a C-terminal his6 epitope tag (hereafter referred to as “his6-Hfq”). This is because, unlike HfqWT, the two mutant forms of Hfq are not heat-stable and therefore cannot be purified in the same way as untagged HfqWT (Mikulecky et al. 2004). However, all three forms of the his6-tagged Hfq can be purified using nickel affinity chromatography. We show in Figure 6A and Table 1 that WT and Y25A forms of his6-Hfq bound RNA-OUT with similar affinities (KD1 ∼76 nM and 94 nM, respectively). In contrast, his6-HfqK56A bound very poorly to RNA-OUT at Hfq concentrations up to 309 nM. At the high end of the HfqK56A titration (upwards of 464 nM Hfq6), essentially all of RNA-OUT was bound by HfqK56A, forming Hfq:OUT-2 with an apparent KD ∼389 nM. This represents a fivefold reduction in the affinity of his6-HfqK56A vs. his6-HfqWT for RNA-OUT.
The above results are consistent with Hfq binding RNA-OUT through its proximal site, which is typical of how Hfq binds trans-sRNAs. If this is correct, then it is expected that a sRNA, but not a distal-specific RNA, would act as a competitor for RNA-OUT binding to untagged HfqWT. We show in Figure 6B that this is the case. When we pre-incubated Hfq with DsrA (an sRNA) or A18 (a distal-specific RNA) and then added 32P-labeled RNA-OUT, only DsrA inhibited Hfq:OUT-1 complex formation; IC50 values (Table 2; Supplemental Fig. S4) are ∼7 nM and >4000 nM for DsrA and A18, respectively. In fact, there was evidence of ternary complex formation at A18 concentrations above 31 nM (see lanes 18–24 in Fig. 6B). Overall, we conclude that RNA-OUT behaves like a trans-sRNA in its interaction with Hfq.
TABLE 2.
In vitro competition by DsrA or A18 for binding of HfqWT to RNA-IN or RNA-OUT
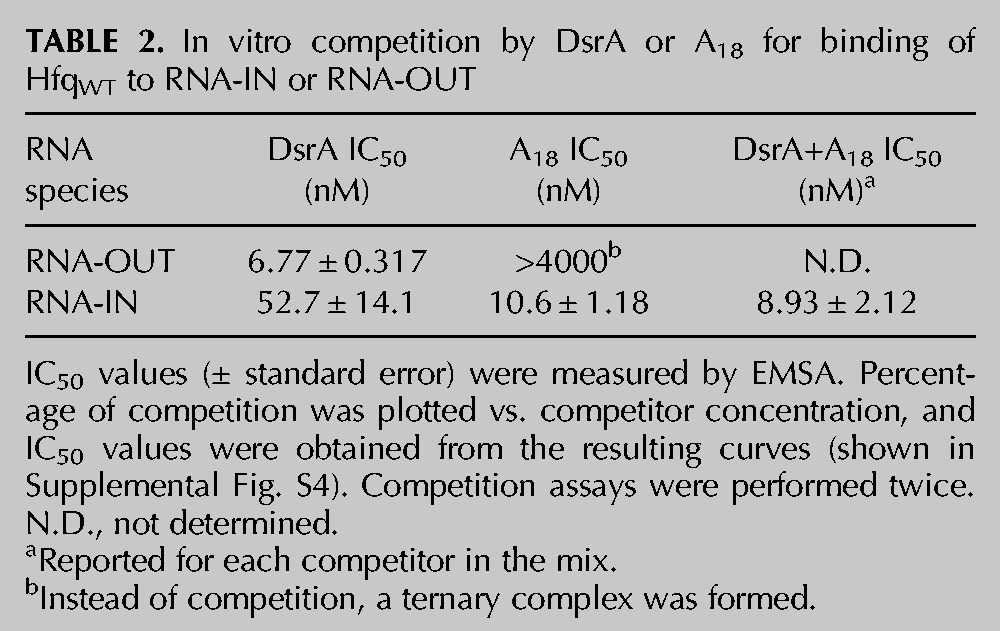
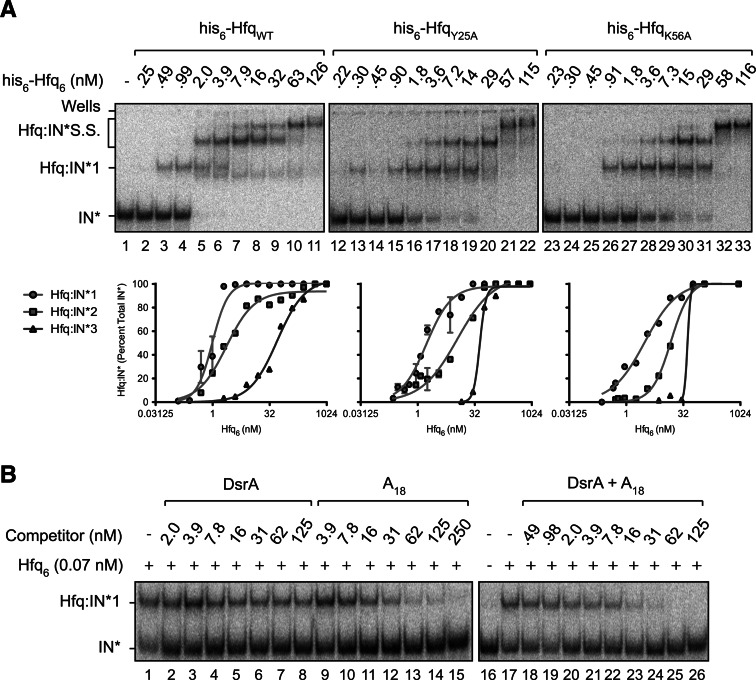
In titrations with RNA-IN-160 and his6-tagged Hfq proteins (WT, K56A, and Y25A), there was a moderate reduction in binding affinity. This is reflected by changes in KD1 of 1.7- and threefold, respectively, for HfqY25A and HfqK56A vs. HfqWT (see Fig. 7A; Table 1). These results are consistent with RNA-IN-160 binding to both the proximal and distal sites. Competition experiments support this inference, as both DsrA and A18 gave some inhibition of Hfq:IN-1 formation when each of these RNAs was pre-incubated with Hfq prior to addition of RNA-IN-160. More specifically, we observed strong inhibition of Hfq:IN-1 formation at concentrations above the KD for A18:Hfq complex formation, which is ∼10 nM (Fig. 7B, lanes 11–15; IC50 ∼11 nM, Table 2; Supplemental Fig. S4; Sun and Wartell 2006). In contrast, we observed weak inhibition of Hfq:IN-1 formation at DsrA concentrations above the KD for DsrA:Hfq complex formation, which is ∼21 nM (Fig. 7B, lanes 6–8; IC50 ∼53 nM, Table 2; Supplemental Fig. S4; Mikulecky et al. 2004). At A18 concentrations above its KD for Hfq (lanes 11–15), primarily the proximal site is expected to be available for RNA-IN-160 binding, and at DsrA concentrations above its KD for Hfq (lanes 5–7), primarily the distal site is expected to be available for RNA-IN-160 binding. Accordingly, the stronger inhibition observed for A18 is consistent with the distal site of Hfq being the higher affinity site for RNA-IN-160 binding. This is typical of Hfq binding to mRNAs (Mikulecky et al. 2004; Soper et al. 2011).
FIGURE 7.
RNA-IN interacts with the distal and proximal RNA-binding surfaces of Hfq. (A) EMSAs with 32P-labeled RNA-IN (0.17 nM) and either WT or mutant forms of his6-tagged Hfq. Species are labeled as in Figure 2. Binding curves are shown below the corresponding EMSA, and apparent KD values are reported in Table 1. Error bars represent standard error from two experiments. (B) EMSAs performed in the presence of competitor RNAs. Competitor experiments were performed as described in Figure 6B except that RNA-IN was present at a concentration of 0.17 nM. For lanes 18–26, a 1:1 mix of DsrA and A18 was serially diluted to the indicated concentrations before competition. IC50 values were calculated from curves shown in Supplemental Figure S4 and are reported in Table 2.
We also performed a competition experiment where both competitors were mixed with Hfq simultaneously and then RNA-IN-160 was added (Fig. 7B, lanes 16–26). Very strong inhibition of Hfq:IN-1 formation was only observed when the concentrations of both A18 and DsrA were close to or above their respective KD values for Hfq complex formation (lanes 23–26). These results suggest that an additional RNA-binding site in Hfq does not contribute significantly to the formation of a stable Hfq:RNA-IN-160 complex.
HfqK56A exhibits a reduced rate of RNA-IN:OUT pairing in vitro
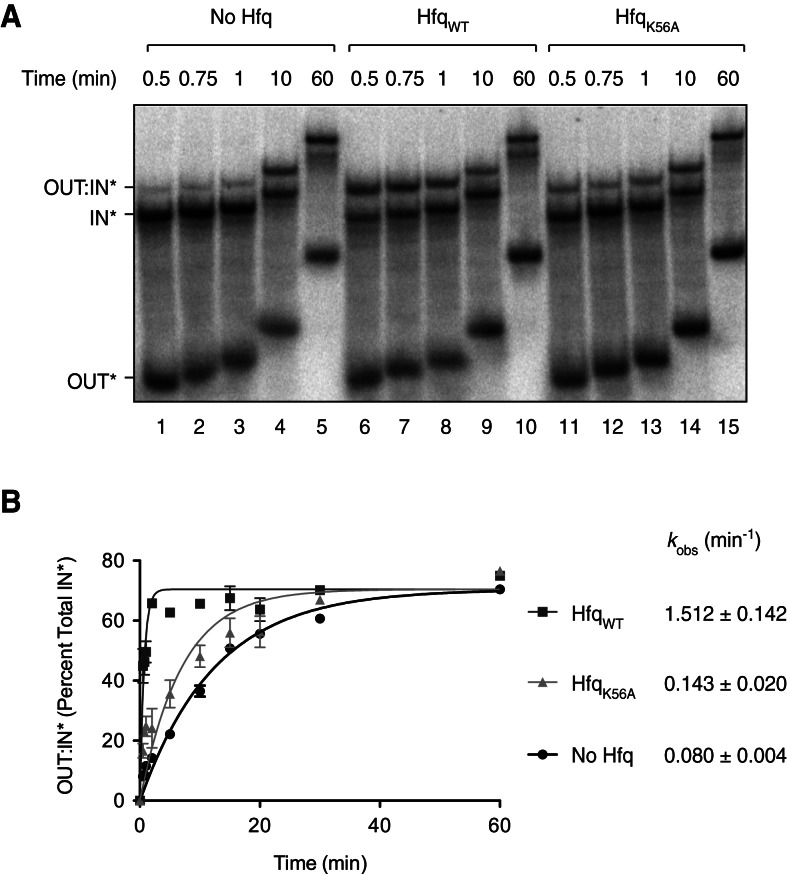
The results in the previous section show that RNA-IN can contact both the distal and proximal sites in Hfq and that RNA-OUT binds only to the proximal site. One or more of these interactions is likely important for the acceleration in the rate of RNA-IN:OUT pairing directed by Hfq that we previously documented (Ross et al. 2010). The proximal site is likely of particular importance, as both RNA species could conceivably bind here and begin to pair. Accordingly, we asked if an intact proximal RNA-binding site is necessary for Hfq to accelerate the rate of RNA-IN:OUT pairing. Note that we developed an alternative means to purify untagged HfqWT and HfqK56A (see Materials and Methods), as the his6-tagged forms gave inconsistent pairing results. We mixed Hfq (WT or K56A), 32P-labeled RNA-OUT, and 32P-labeled RNA-IN-160 and incubated them for the indicated times before processing and analysis on a native polyacrylamide gel. Processing involved phenol extraction (mixing, centrifugation, and recovery took ∼15 sec) and then immediately loading the samples on a native polyacrylamide gel. This step was included to remove Hfq from the paired product so that identification of this species was unambiguous. The ratio of RNA-OUT to RNA-IN was fixed (10:1) to roughly reflect the ratio of these RNAs in vivo. The Hfq concentration used (45 nM) was set from a preliminary experiment where we determined the minimum concentration of Hfq that yielded an enhancement in RNA-IN:OUT pairing (relative to the absence of Hfq) at the above ratio of RNA-OUT to RNA-IN (see Supplemental Fig. S5).
We show in Figure 8 that addition of 45 nM HfqWT increased the rate (kobs) of RNA-IN:OUT pairing approximately 19-fold relative to no Hfq addition (kobs = 1.51 min−1 for HfqWT vs. 0.080 min−1 in the absence of Hfq). By comparison, the rate enhancement was less than twofold when HfqK56A was used (kobs = 0.14 min−1). These results indicate that the K56A mutation negatively impacts RNA-IN:OUT pairing under these specific conditions, consistent with the proximal surface playing an important role in the enhancement of antisense pairing in vitro.
FIGURE 8.
RNA-IN:RNA-OUT pairing reactions. (A) 32P-labeled RNA-IN-160 (0.85 nM) was mixed with excess 32P-labeled RNA-OUT (8.5 nM) and, where indicated, untagged WT or K56A Hfq (45 nM). Note that RNA-OUT had a lower specific activity than RNA-IN. At the indicated time points, pairing reactions were stopped by treatment with a phenol/water mix and immediately loaded onto a 6% native polyacrylamide gel. (B) The amount of RNA-OUT:RNA-IN* complex (OUT:IN*) was determined as a percentage of total RNA-IN* for each time point and plotted as a function of time. Error bars represent the standard error from three experiments. The observed rate constant (kobs) is indicated for each reaction. These values were derived from curves corresponding to the equation describing the rate of exponential association, presented in Materials and Methods.
IS10-Kan transposition is derepressed in strains expressing Y25A and K56A forms of Hfq
While Hfq increases the rate of RNA-IN:OUT pairing substantially in vitro, it is difficult to know if effective antisense inhibition of transposase expression requires this enhancement in the RNA pairing rate in vivo. To address this issue, we asked if untagged HfqK56A (which is impaired in its ability to promote IN:OUT pairing in vitro) is also less effective than wild-type Hfq at repressing IS10 transposition. We also assessed the ability of the distal-impaired HfqY25A to repress transposition of IS10. We used a “mating out” assay to measure the frequency of IS10-Kan transposition from a multicopy plasmid in different genetic backgrounds. In this assay, the frequency of transposition of IS10-Kan from a multicopy plasmid to the F plasmid in the donor strain is measured (see Materials and Methods). For the mating out experiments, the Hfq status was manipulated by transforming the donor strain (DBH16; hfq−) with a plasmid expressing untagged WT, Y25A, or K56A forms of Hfq from a native hfq promoter. As controls, we also measured the frequency of IS10-Kan transposition in hfq+ (DBH33; full repression) and hfq− (no repression) strains.
The results of the mating out analysis are presented in Figure 9, where we report the fold-change in transposition frequency relative to the average transposition frequency calculated for hfq+. In both the hfqK56A and hfqY25A strains, IS10-Kan transposition was derepressed to about the same level as in hfq−. Importantly, these deficiencies cannot be attributed to differential levels of Hfq expression in the different strains, as Western blotting confirmed that plasmid-encoded WT, Y25A, and K56A forms of Hfq were present at comparable levels in the respective donor strains (Supplemental Fig. S6). These results show that Hfq mutants that are partially defective in binding RNA at specific surfaces, one of which (K56A) is impaired in its ability to catalyze RNA-IN:OUT pairing in vitro, are unable to repress IS10 transposition in vivo.
FIGURE 9.
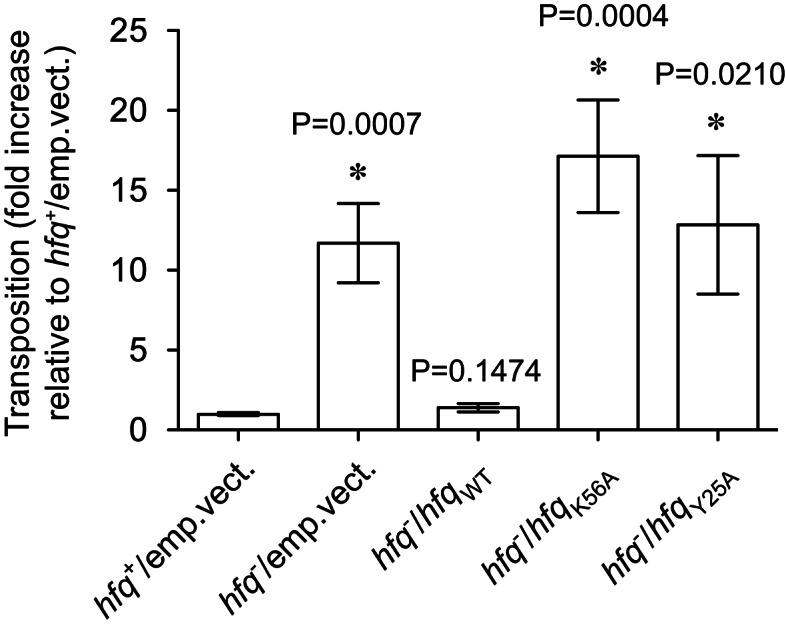
IS10-Kan transposition is derepressed in E. coli encoding Y25A and K56A forms of Hfq. E. coli cells (hfq+ or hfq−) were cotransformed with pDH602 (encodes IS10-Kan) and a compatible plasmid encoding untagged Hfq (WT, K56A, or Y25A) or the corresponding “empty vector” control. Relative transposition frequencies were measured using the conjugal mating out assay (see Materials and Methods for details). An average transposition frequency (4.03 × 10⁻³ events per mL of mating mixture) was calculated for the hfq+ strain (hfq+/emp.vect.) from 15 independent “donor” colonies across four independent experiments, and this value was set at 1. All other transposition values are expressed relative to this value where Hfq-directed repression of transposition is at its maximal level. Bars indicate the mean; the error bars indicate standard error on the mean. From left to right, the n value for each treatment group is 15, 15, 14, 16, and 11—these were compiled from at least two (and up to four) independent experiments. An asterisk (*) indicates that means were significantly different from the hfq+ control group; P values are indicated above the corresponding bars.
Hfq is also known to stabilize trans-encoded sRNAs (for review, see Vogel and Luisi 2011), and such an activity could influence the effectiveness of RNA-OUT in the Tn10/IS10 antisense system. We performed a rifampicin time-course experiment to look at this possibility. We show in Supplemental Figure S7 that the half-life of RNA-OUT actually decreased by about 2.5-fold in an hfq+ relative to an hfq− strain. Accordingly, we can rule out the possibility that Hfq contributes to the antisense system by stabilizing RNA-OUT.
DISCUSSION
Tn10/IS10 transposition is negatively regulated by an asRNA (RNA-OUT) that pairs with the 5′ TIR of the transposase mRNA (RNA-IN) to inhibit transposase expression. Hfq is also a negative regulator of Tn10/IS10 transposition that down-regulates transposase expression in vivo. The effect of disrupting hfq on Tn10/IS10 transposition is diminished in a system with reduced RNA-OUT expression. In vitro, Hfq binds RNA-IN and RNA-OUT, forms a ternary complex with these RNAs, and increases the rate of RNA-IN:OUT pairing. Taken together, these observations are consistent with Hfq regulating Tn10/IS10 by operating on the antisense mechanism. In the current work, we have further characterized the interactions between Hfq, RNA-IN, and RNA-OUT with regard to binding affinity, binding sites within Hfq that govern these RNA contacts, and the impact mutating one of these binding sites has on RNA-IN:OUT pairing. We have also begun to define Hfq binding sites within each RNA, as well as the impact Hfq binding has on the structure of these RNAs.
RNA-IN and RNA-OUT bind Hfq like a prototypical sRNA-mRNA pair
The Hfq binding affinities we have measured for RNA-IN and RNA-OUT are consistent with what is typically seen for canonical trans-encoded sRNA-mRNA pairs. For example, KD1 for RNA-OUT is 19.6 nM and KD1 for Hfq binding to DsrA is 21 nM (Mikulecky et al. 2004). Hfq binds RNA-IN with sub-nanomolar affinity (apparent KD1 0.24 nM), which is comparable to the tightest Hfq-mRNA interactions described to date (OmpC 0.9 nM, Fender et al. 2010; SodB 0.3 nM, Geissmann and Touati 2004; RpsO 90 pM, Folichon et al. 2003).
We also investigated determinants in Hfq responsible for RNA-IN and RNA-OUT binding. Hfq possesses at least two distinct RNA-binding surfaces; the distal site generally binds A-rich RNA/mRNA while the proximal site binds U-rich sRNAs (Mikulecky et al. 2004; Soper et al. 2011; Ishikawa et al. 2012). Both competition and binding experiments (with Hfq variants) revealed that Hfq binds RNA-OUT exclusively through its proximal RNA-binding surface. For RNA-IN, both the distal and proximal binding sites in Hfq contribute to RNA-IN binding, although the distal site is the higher affinity site. In canonical sRNA-mRNA systems, there is competition between sRNA and mRNA binding at the proximal site, and this appears to be required for the formation of the paired species (Hwang et al. 2011). Competition is ensured by the individual RNAs having similar binding affinities for the proximal site, and in general, these affinities are much weaker than those for the distal site. The high affinity interaction for the mRNA with the distal site effectively tethers the mRNA to Hfq, allowing other parts of the mRNA to interact relatively weakly with the proximal site, and this increases the probability that the mRNA and sRNA can occupy the proximal site at the same time (Hopkins et al. 2011). As discussed above, the Hfq:RNA interactions in the IS10 system are consistent with this general model. A recent study defined a third RNA-binding site in Hfq (the lateral surface) that may be important in allowing the mRNA to simultaneously bind distal and proximal sites (Sauer et al. 2012). Our competition studies indicate that the lateral surface alone is not sufficient for binding RNA-IN or RNA-OUT.
We have not defined the number of Hfq hexamers present in any of the Hfq:RNA-IN or Hfq:RNA-OUT complexes. The KD values discussed above relate only to the complexes formed at the lowest Hfq concentrations in each titration. For RNA-IN, at least four distinct Hfq complexes were detected, raising the possibility that at least four Hfq hexamers may be accommodated within the first 160 nt of RNA-IN. Results from hydroxyl radical footprinting support the existence of multiple Hfq binding sites in RNA-IN. One such site may extend from position 29 to 46 and appears to be the highest affinity site identified by hydroxyl radical footprinting, as it was occupied at a lower Hfq concentration relative to the other sites. For RNA-OUT, two distinct Hfq-bound species were detected. Results from RNase footprinting revealed only one strong candidate for an Hfq binding site within RNA-OUT. This site is located within the U-rich segment of bulge 2. We don’t yet know which Hfq binding site(s) in RNA-IN or OUT are biologically relevant. Work in other systems is consistent with the idea that maximal pairing of an mRNA:sRNA pair can require the mRNA to bind multiple Hfq hexamers (Soper and Woodson 2008; Salim and Feig 2010). Mutagenesis of potential Hfq binding sites in RNA-IN and RNA-OUT is currently under way to test the importance of individual sites in IS10 transposition.
A proximal site mutation impacts on RNA-IN:OUT pairing and IS10 transposition
The rate of RNA-IN:OUT pairing was substantially enhanced by HfqWT but not HfqK56A. A limitation of this analysis was that we measured kobs under one specific set of parameters as opposed to measuring a second-order rate constant. We used excess RNA-OUT relative to RNA-IN (10:1) and a small excess of Hfq relative to both (less than fivefold). As “available” Hfq is thought to be limiting in the cell (Hussein and Lim 2011; Moon and Gottesman 2011), we feel this is a reasonable approximation of in vivo conditions. Under these conditions, the kobs value was 10.6-fold lower for HfqK56A vs. HfqWT.
We also measured the impact of the Hfq proximal and distal site mutations on IS10 transposition. IS10 transposition was derepressed in both hfqK56A and hfqY25A strains relative to hfqWT. RNA-IN:OUT pairing in vitro was enhanced ∼19-fold by HfqWT relative to no Hfq, and the magnitude of derepression of IS10 transposition in hfq− relative to hfq+ was ∼10–15-fold. Furthermore, in vitro pairing was ∼10-fold faster in the presence of HfqWT relative to HfqK56A, and in vivo transposition was derepressed ∼12-fold for hfqK56A relative to plasmid-borne hfq+. Taken together, these results are consistent with Hfq playing a significant role in the pairing component of the IS10 antisense system. Another way in which Hfq might facilitate the IS10 antisense system is through the stabilization of RNA-OUT. However, this possibility is not supported by our observation that RNA-OUT stability is actually reduced in an hfq+ compared to an hfq− strain. Finally, Hfq might directly interfere with IS10 transposase translation. We think this is unlikely because, as previously noted, the large increase in Tn10/IS10 transposition from a multicopy plasmid in hfq− is tightly linked to the expression of RNA-OUT.
How might Hfq promote pairing in the IS10 antisense system?
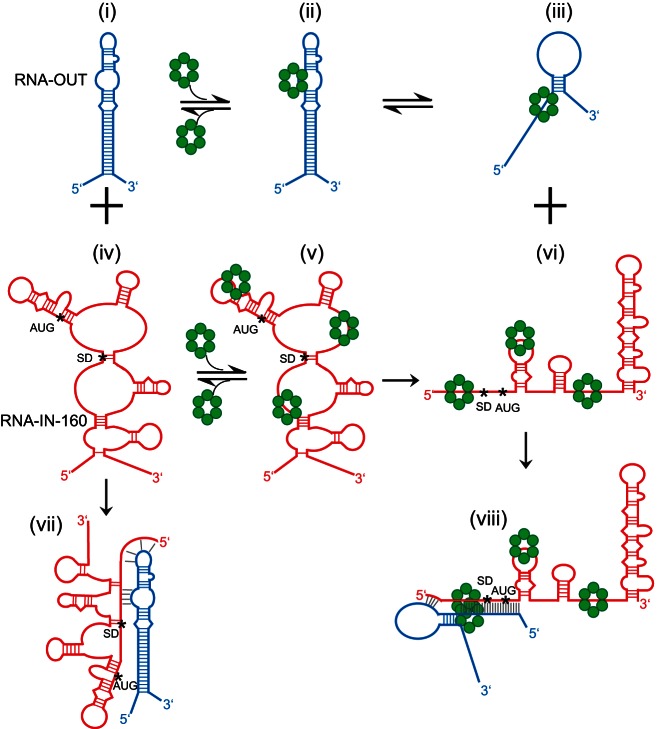
The simplest scenario for how Hfq promotes RNA pairing in the IS10 antisense system is that, through simultaneous binding of RNA-IN and RNA-OUT, Hfq acts as a pairing catalyst by increasing the local concentration of these two RNAs. In addition to providing a single surface to which both RNAs bind, Hfq might actively alter the structure of RNA-IN and RNA-OUT to promote pairing. In fact, our structure-probing data support an Hfq-dependent restructuring model (Fig. 10). On the left-hand side of Figure 10, we show how RNA-IN and RNA-OUT might interact in the absence of Hfq. Structure-probing experiments with RNA-IN and RNA-OUT revealed that the pairing region of both RNAs is at least partly sequestered in secondary structure. In this pathway, a total of 8 bp between RNA-IN and RNA-OUT could readily form without any RNA restructuring (structure vii). In the right-hand panel, we show how pairing could occur with RNAs (structures iii and vi) that have been restructured by Hfq. In the presence of Hfq, the pairing region of both RNAs is largely single-stranded, leading to the formation of a paired species (structure viii) that contains 30 bp between RNA-IN and OUT. Notably, only in structure viii is the TIR sequestered through base-pairing with RNA-OUT. We anticipate that upon Hfq dissociation, RNA-OUT will adopt its native structure (transition from structure iii to structure i). However, the capacity of the 3′ end of RNA-IN to form a stable secondary structure in the presence of Hfq may prevent Hfq-bound RNA-IN (structure vi) from converting back to structure iv upon Hfq release. As Hfq rapidly cycles on and off of RNAs (Fender et al. 2010), the formation of the 3′ stem–loop structure could maintain RNA-IN in a “pairing-competent” state after Hfq release. Consistent with genetic data, the “Hfq pairing pathway” includes pairing of the 5′ terminus of RNA-IN with the hairpin loop of RNA-OUT. Also, the internal loop of RNA-OUT has been shown to be important for the antisense response (Case et al. 1989; Kittle et al. 1989; Jain 1995). In the Hfq-independent pathway, nucleotides within this loop can directly pair with RNA-IN, facilitating further propagation of pairing. In the Hfq pathway, we suggest that internal loop residues directly participate in Hfq binding and are, therefore, important in the restructuring of RNA-OUT.
FIGURE 10.
Model for RNA-IN:OUT antisense pairing in the presence vs. absence of Hfq. The Hfq-independent pairing pathway is shown on the left-hand side (structures i, iv, and vii) and the Hfq-dependent pathway is shown on the right-hand side (structures iii, vi, and viii). In structures (ii) and (v) Hfq is shown bound to RNA-OUT and RNA-IN, respectively, but conformational changes in the RNAs have not yet taken place. Other structures are described in the text. Hfq hexamers are indicated by green circles. The start codon (AUG) and Shine-Dalgarno sequence (SD) of RNA-IN are indicated by asterisks (*) at the first nucleotide of each sequence. Intramolecular base pairs in RNA-OUT/IN are indicated by blue and red, respectively. Intermolecular base pairs between RNA-OUT and RNA-IN are in gray.
An active remodeling role for Hfq has been well documented in other systems. Hfq alters the structure of RpoS mRNA such that the sequence that base-pairs with DsrA becomes single stranded (Soper et al. 2011). The pairing region within SodB mRNA is also sequestered in a stem–loop structure; Hfq binding is required to disrupt this stem–loop, resulting in formation of a large loop that is then competent to pair with the sRNA, RyhB (Geissmann and Touati 2004).
In other systems, the presence of base-pairing discontinuities in structured regions of asRNAs has also been shown to be critical for antisense regulation (see Wagner et al. 2002). At this point, it is unclear if these discontinuities are sufficient for a robust antisense response in vivo, and in this regard, it will be interesting to see if the effectiveness of other antisense systems shows any reliance on Hfq.
In the current work, we have provided additional insight into how Hfq interacts with the RNA components of the IS10 antisense system and provided further evidence that these interactions ultimately influence this system. To date, only one other antisense system is known to be Hfq-regulated. Hfq regulates the expression of the chromosomally encoded gadX gene, which is involved in acid tolerance in E. coli. An sRNA called GadY is antisense to the 3′ UTR of GadX, and it has been shown that GadY expression increases the stability of the GadX transcript. Importantly, Hfq binds to the GadY transcript and stabilizes it (Opdyke et al. 2004). However, it has not been established if Hfq plays a direct role in promoting pairing of GadY and GadX RNAs. With regard to other transposons, it should be noted that antisense RNAs to the transposase have been identified, including IS30 (Arini et al. 1997) and IS200 (Sittka et al. 2008). Additionally, a recent study identified five transcripts in Mycobacterium smegmatus that bind Hfq and are antisense to transposase mRNAs (Li et al. 2012). It will be interesting to see if any of these transposons are regulated by Hfq. Notably, Hfq regulation of other transposons might not be limited to systems encoding asRNAs. Trans-encoded sRNAs frequently target more than just one mRNA (for review, see Repoila et al. 2003), and as such, there is the potential for “off-target” effects wherein a trans-encoded sRNA might fortuitously target a transposase mRNA. This could provide the host with a previously unrecognized pathway to either down- or up-regulate transposon mobilization. Furthermore, as the induction of the transcription of sRNA genes is often linked to various cellular stresses (Repoila et al. 2003), and this induction can temporarily limit the availability of Hfq in the cell (Hussein and Lim 2011; Moon and Gottesman 2011), there is the potential to indirectly regulate transposition reactions through stress response pathways.
MATERIALS AND METHODS
Strains, plasmids, and primers
All E. coli strains and plasmids used in this study are listed in Table 3. Oligonucleotides used are listed in Table 4.
TABLE 3.
List of E. coli strains and plasmids used in this study
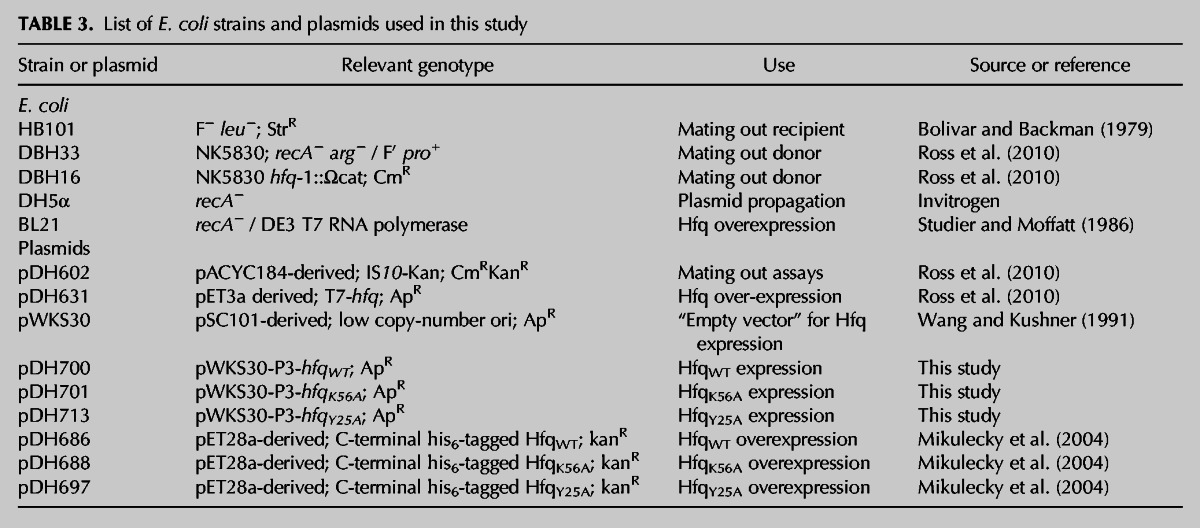
TABLE 4.
List of oligonucleotides used in this study
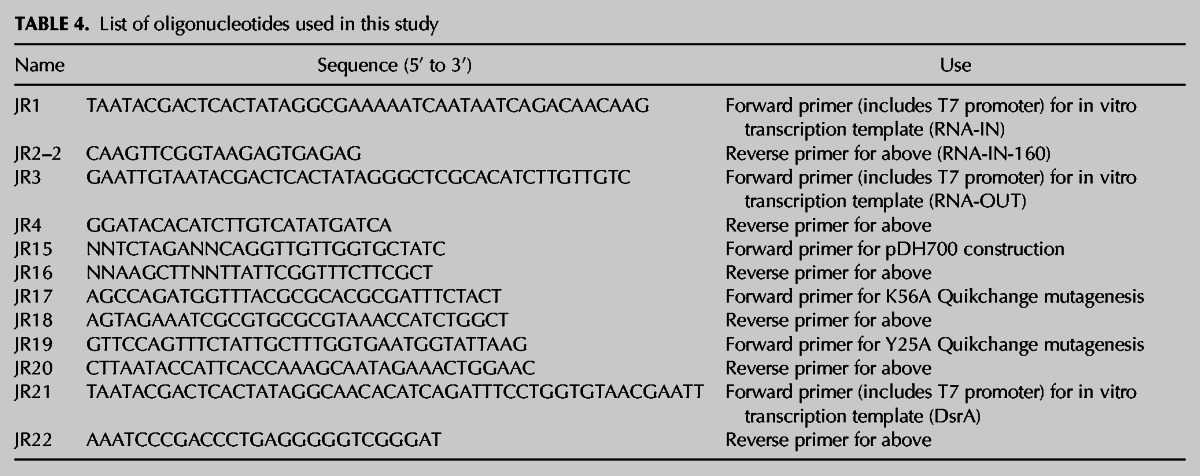
To express Hfq in vivo, we cloned a fragment that included the hfq gene with its P3 promoter into the low-copy cloning vector pWKS30 (Wang and Kushner 1991). The aforementioned fragment was generated by PCR using genomic DNA from DBH33 and primers JR15 and JR16, which include XbaI and HindIII sites, respectively. After digestion of the PCR product with XbaI-HindIII, the “hfq” fragment was ligated into XbaI-HindIII-digested pWKS30, creating pDH700. We then used pDH700 as a template for site-directed mutagenesis to create pDH701 and pDH713, which encode HfqK56A and HfqY25A, respectively. For purification of C-terminal his6-tagged Hfq (WT, HfqY25A, and HfqK56A), the hfq gene was cloned into pET28a as described in Mikulecky et al. (2004).
Hfq purification and quantitation
Untagged Hfq was purified as described in Ross et al. (2010) but included a treatment of the lysate with DNase I (100 units) and RNase A (100 μg) for 1 h on ice before heat treatment of the lysate at 85°C. His6-Hfq proteins were purified as described in Mikulecky et al. (2004). Untagged HfqWT and HfqK56A for the experiments presented in Figure 8 were expressed from pDH700 and pDH701 and purified on a TALON Cobalt column as described in Soper et al. (2010), followed by further purification on a polyA column as described in Ross et al. (2010). Purified Hfq was dialyzed against Hfq storage/binding buffer (50 mM Tris, pH 7.5, 1 mM EDTA, 250 mM NH4Cl, 10% (v/v) glycerol). SDS-PAGE revealed that the Hfq was ∼95% pure (Supplemental Fig. S6B). Hfq concentration was determined by Bradford assay.
In vitro transcription and RNA purification
Linear DNA templates for run-off transcription of RNA-IN (nucleotides 1–160) or RNA-OUT (nucleotides 1–69) were amplified from pDH602 (Ross et al. 2010) by PCR with primers JR1/JR2-2 or JR3/JR4, respectively; note that, for each primer pair, the forward primer includes the T7 core promoter. The same approach was used to make templates for in vitro transcription of DsrA (primers JR21/JR22). Our standard in vitro transcription reaction for generating unlabeled RNA was performed in a 30-μL volume with 200 ng DNA template, 2.5 mM rNTPs, 10 mM DTT, 1× T7 RNA polymerase reaction buffer (NEB), 100 units RNasin (Promega), 2.5 units yeast inorganic pyrophosphatase (NEB), and 100 units T7 RNA polymerase (NEB). For preparing 32P-labeled RNA, in vitro transcription was performed in a 20-μL volume as above except that UTP was added to only 50 nM, and 2.5 μCi [α-32P]UTP was added. Reaction mixtures were incubated at 37°C for 1 h before adding 0.1 units of Turbo DNase (Ambion) per μL of reaction and continuing incubation for 20 min. RNAs were purified using denaturing PAGE and, after elution from gel slices, were concentrated by ethanol precipitation and finally resuspended in Hfq storage/binding buffer. RNA concentrations were determined using a NanoSpectrophotometer (IMPLEN). Purity of in vitro transcribed RNA was assessed by high-resolution denaturing PAGE. A18 was purchased from Sigma-Aldrich and dissolved in Hfq storage/binding buffer.
Hfq-RNA binding assays
In our standard Hfq-RNA binding reaction, we mixed 32P-labeled RNA (0.1–0.4 nM) with Hfq (0.05–1856 nM) in Hfq storage/binding buffer (total reaction volume 10 μL) for 15 min at 37°C. In the case of “competitor” experiments, unlabeled competitor RNAs (0.5–4000 nM) were mixed with Hfq for 5 min as described above, and then either 32P-labeled RNA-IN (0.17 nM) or RNA-OUT (0.4 nM) was added. Incubation was continued at 37°C for an additional 15 min. Prior to mixing RNA with Hfq, the various RNA species were incubated at 95°C for 2 min, placed on ice for 2 min, and equilibrated to 37°C. At the reaction end points, samples were mixed with 0.3 volumes of gel load dye (21 mM Tris-HCl pH 7.5, 10 mM DTT, 100 mM KCl, 30% (v/v) glycerol, 0.05% (w/v) bromophenol blue) and applied to a 6% native polyacrylamide gel. Electrophoresis was carried out at 14 V/cm for 70 min, whereupon the gel was dried and exposed to a phosphorimager screen. Gel images were obtained using the STORM phosphorimager.
For measuring the equilibrium dissociation constant (KD) in binding reactions, bands representing shifted and unshifted RNA species were quantified (ImageQuant software), and the percentage of counts for a given shifted species (relative to total counts for all bands in the lane) was plotted on the y-axis and Hfq concentration on the x-axis (Prizm software). The resulting curve was fit by nonlinear regression to the equation:
 |
where P and L are Hfq and RNA, respectively, P:L is the percentage of RNA shifted by Hfq, [P] is the concentration of Hfq6 in nM, KD is the equilibrium dissociation constant, and h is the Hill coefficient. To calculate KD1, the percentages of all shifted species were summed to yield the appropriate curve (e.g., the curve marked “total” in Fig. 2B or D). To calculate KD2 for RNA-OUT, the percentages of all species representing complex 2 were plotted (e.g., the curve marked “Hfq:OUT*2” in Fig. 2B). To calculate KD2 for RNA-IN-160, the total percentages of all species other than free RNA-IN-160 or Hfq:IN*1 were plotted (i.e., the curve marked “Hfq:IN*2” in Fig. 2D). To calculate KD3 for RNA-IN-160, the total percentages of all species other than free RNA-IN-160, Hfq:IN*1 or Hfq:IN*2 were plotted (i.e., the curve marked “Hfq:IN*3” in Fig. 2D).
For calculating IC50 values (i.e., the concentration of competitor RNA that inhibited Hfq:RNA-IN or Hfq:RNA-OUT complex formation by 50%), bands representing Hfq:RNA* complexes (* denotes radiolabelled RNA-IN or RNA-OUT) and unshifted RNA* were quantified, and the percentage of Hfq-shifted RNA* at 0 nM competitor was set at 0% competition. The percentage of Hfq-shifted RNA* remaining at increasing concentrations of competitor was subtracted from 100% to give the percent competition (0% shifted complex = 100% competition). Percent competition was plotted on the y-axis and competitor concentration on the x-axis (Prizm). The resulting curve was fit by nonlinear regression to the equation:
 |
where PC is percent competition, [C] is the concentration of competitor RNA in nM, and IC50 is the concentration of competitor RNA giving 50% competition.
RNA structure-probing and footprinting
In vitro-transcribed RNA-IN and RNA-OUT were gel-purified, treated with Antarctic Phosphatase (NEB) and 5′ end-labeled with [γ-32P]ATP (Perkin Elmer) and OptiKinase (USB). 5′-labeled RNA was gel-purified, ethanol-precipitated, and finally resuspended in RNA Storage Buffer (20 mM MES pH 7.0, 150 mM NaCl, 1 mM EDTA). RNA concentrations were determined using a NanoSpectrophotometer (IMPLEN). RNA and Hfq were mixed in RNA Structure Buffer (20 mM MES pH 7.0, 150 mM NaCl, 1 mM EDTA, 10 mM MgCl2) to a final volume of 9 μL. Binding reactions took place at 37°C for 15 min. For RNase footprinting, 1 μL of dilute RNAse A, T1, or V1 (Ambion) was added to each binding reaction. For RNA-OUT, 0.04 ng RNase A, 0.03 units or 0.04 units of RNAse T1 (− or + Hfq, respectively), and 0.00005 units or 0.0001 units of RNase V1 (− or + Hfq, respectively) were added. For RNA-IN, 0.004 or 0.01 ng of RNAse A (− or + Hfq, respectively), 0.01 units of RNAse T1, and 0.00005 units or 0.0001 units of RNAse V1 (− or + Hfq, respectively) were added. G-lanes were produced by T1 digestion of RNA following the manufacturer’s directions (Ambion). RNase reactions proceeded for 15 min at 25°C before RNA was ethanol-precipitated and resuspended in 7 μL formamide load dye (97.5% deionized formamide (v/v), 10 mM EDTA, 0.5× TBE, 3% xylene cyanol [w/v]), and ∼2 μL was loaded onto a high-resolution 10% polyacrylamide denaturing gel. Hydroxyl radical footprinting was performed as previously described (Jain and Tullius 2008). Briefly, following binding reactions, 1 μL of freshly prepared H2O2 (2.5% [v/v]), Fe(II)EDTA (32 mM ferrous ammonium sulphate, 88 mM EDTA; Bio Basic), and sodium ascorbate (60 mM; Bio Basic) were added to each 9 μL binding reaction. The final concentrations of hydroxyl radical reagents in each 12-μL reaction were as follows: H2O2, 0.21% (v/v); Fe(II), 2.67 mM; EDTA, 7.33 mM; sodium ascorbate, 5 mM. Following incubation at 25°C for 10 min, samples were processed as described above for RNase treatment. For footprinting reactions, RNA-OUT was at a final concentration of 65 nM, RNA-IN at 45 nM, and Hfq6 at a final concentration of 99–4380 nM. Gels were dried and imaged with a phosphorimager (GE Healthcare). A sample of each binding reaction (RNA-IN and RNA-OUT, each Hfq concentration) was run on a 6% polyacrylamide gel to monitor complex formation under the conditions used (Supplemental Fig. S1). Quantitation of RNA-IN hydroxyl radical footprinting was performed using ImageQuant software.
Determination of RNA-OUT:RNA-IN pairing rates
RNA-IN:OUT pairing reactions were carried out by spotting 3.5 μL of 32P-labeled RNA-IN and RNA-OUT onto separate faces of an Eppendorf tube, mixing them with 24.5 μL of Hfq storage/binding buffer, and immediately removing 9 μL to separate tubes containing 1 μL of Hfq (or Hfq storage buffer), as indicated. Mixing was achieved by rapid pipetting. Final concentrations of reactants were: RNA-IN*, 0.85 nM; RNA-OUT*, 8.5 nM; Hfq, 45 nM. Incubation was at 37°C, and after the indicated times, each 10-μL reaction was added to tubes containing 30 μL H2O and 40 μL phenol:chloroform:isoamyl alcohol. These were immediately vortexed (8 sec) and centrifuged (3-sec pulse-spin) before removing 10 μL of the aqueous phase and loading it directly on a 6% native polyacrylamide gel at 7 V/cm. After the last sample was loaded, electrophoresis was continued at 13 V/cm for 45 min. Gels were dried and imaged as described above. Bands representing RNA-OUT:IN paired species or free RNA-IN were quantified (ImageQuant). The percentage of paired species (relative to total RNA-IN counts) was plotted on the y-axis and time on the x-axis (Prizm). The resulting curves were fit by nonlinear regression to the equation:
where A:Bt is the percentage of binary complex at time t and kobs is the observed rate constant.
Mating out assay
Mating out experiments were carried out with DBH33 (hfq+) and DBH16 (hfq−) as donor strains and HB101 as the recipient strain. Plasmids encoding IS10-Kan (pDH602) and Hfq (pDH700, 701, 713, and pWKS30 as the “empty vector” control) were cotransformed into donor strains, and transformants were selected on M9-Glucose plates supplemented with arginine, kanamycin (50 μg/mL), and ampicillin (50 μg/mL). Donors and recipient strains were grown in liquid media as previously described in Ross et al. (2010), and mating was allowed to proceed for 1 h, whereupon mating mixes were pelleted and resuspended in 0.85% saline. Resuspended mating mixes were then plated on M9 media supplemented with glucose, leucine, and streptomycin (150 μg/mL) or streptomycin plus kanamycin (50 μg/mL). Plating on the former gave the mating frequency and plating on the latter gave the number of transposition events. Relative transposition frequencies were calculated by dividing the number of colonies present on streptomycin/kanomycin plates by the number of colonies on streptomycin plates. For statistical analysis, we first carried out an F-test to demonstrate that the variances between the hfq+ control group and the other treatments were not equal (hfq+ vs. hfq−/hfqWT, P = 0.001; hfq+ vs. all other treatments, P < 0.0001). We then conducted a two-tailed t-test with Welch’s correction (does not assume equal variances) to compare the various treatments to the hfq+ control group. All statistical analyses were carried out in Prizm. Sample numbers and P values for the t-test are reported in Figure 9.
SUPPLEMENTAL MATERIAL
Supplemental material is available for this article.
ACKNOWLEDGMENTS
We thank Brian Munshaw for providing comments on the manuscript and Ryan Trussler for preparation of certain reagents. We also thank A. Feig for providing clones encoding K56A and Y25A his6-Hfq and G. Storz for providing the hfq disruption strain. This work was supported by a grant to D.B.H. (MOP 11281) from Canadian Institutes of Health Research. J.R. has been supported by OGS and NSERC scholarships.
REFERENCES
- Altuvia S, Weinstein-Fischer D, Zhang A, Postow L, Storz G 1997. A small, stable RNA induced by oxidative stress: Role as a pleiotropic regulator and antimutator. Cell 90: 43–53 [DOI] [PubMed] [Google Scholar]
- Arini A, Keller MP, Arber W 1997. An antisense RNA in IS30 regulates the translational expression of the transposase. Biol Chem 378: 1421–1431 [DOI] [PubMed] [Google Scholar]
- Bolivar F, Backman K 1979. Plasmids of Escherichia coli as cloning vectors. Methods Enzymol 68: 245–267 [DOI] [PubMed] [Google Scholar]
- Brennan RG, Link TM 2007. Hfq structure, function and ligand binding. Curr Opin Microbiol 10: 125–133 [DOI] [PubMed] [Google Scholar]
- Brescia CC, Mikulecky PJ, Feig AL, Sledjeski DD 2003. Identification of the Hfq-binding site on DsrA RNA: Hfq binds without altering DsrA secondary structure. RNA 9: 33–43 [DOI] [PMC free article] [PubMed] [Google Scholar]
- Case CC, Roels SM, Jensen PD, Lee J, Kleckner N, Simons RW 1989. The unusual stability of the IS10 anti-sense RNA is critical for its function and is determined by the structure of its stem-domain. EMBO J 8: 4297–4305 [DOI] [PMC free article] [PubMed] [Google Scholar]
- Fender A, Elf J, Hampel K, Zimmermann B, Wagner EG 2010. RNAs actively cycle on the Sm-like protein Hfq. Genes Dev 24: 2621–2626 [DOI] [PMC free article] [PubMed] [Google Scholar]
- Folichon M, Arluison V, Pellegrini O, Huntzinger E, Regnier P, Hajnsdorf E 2003. The poly(A) binding protein Hfq protects RNA from RNase E and exoribonucleolytic degradation. Nucleic Acids Res 31: 7302–7310 [DOI] [PMC free article] [PubMed] [Google Scholar]
- Geissmann TA, Touati D 2004. Hfq, a new chaperoning role: Binding to messenger RNA determines access for small RNA regulator. EMBO J 23: 396–405 [DOI] [PMC free article] [PubMed] [Google Scholar]
- Gottesman S, Storz G 2011. Bacterial small RNA regulators: Versatile roles and rapidly evolving variations. Cold Spring Harb Perspect Biol 3: a003798 10.1101/cshperspect.a003798 [DOI] [PMC free article] [PubMed] [Google Scholar]
- Hopkins JF, Panja S, Woodson SA 2011. Rapid binding and release of Hfq from ternary complexes during RNA annealing. Nucleic Acids Res 39: 5193–5202 [DOI] [PMC free article] [PubMed] [Google Scholar]
- Hussein R, Lim HN 2011. Disruption of small RNA signaling caused by competition for Hfq. Proc Natl Acad Sci 108: 1110–1115 [DOI] [PMC free article] [PubMed] [Google Scholar]
- Hwang W, Arluison V, Hohng S 2011. Dynamic competition of DsrA and rpoS fragments for the proximal binding site of Hfq as a means for efficient annealing. Nucleic Acids Res 39: 5131–5139 [DOI] [PMC free article] [PubMed] [Google Scholar]
- Ishikawa H, Otaka H, Maki K, Morita T, Aiba H 2012. The functional Hfq-binding module of bacterial sRNAs consists of a double or single hairpin preceded by a U-rich sequence and followed by a 3′ poly(U) tail. RNA 18: 1062–1074 [DOI] [PMC free article] [PubMed] [Google Scholar]
- Jain C 1995. IS10 antisense control in vivo is affected by mutations throughout the region of complementarity between the interacting RNAs. J Mol Biol 246: 585–594 [DOI] [PubMed] [Google Scholar]
- Jain SS, Tullius TD 2008. Footprinting protein-DNA complexes using the hydroxyl radical. Nat Protoc 3: 1092–1100 [DOI] [PubMed] [Google Scholar]
- Kittle JD, Simons RW, Lee J, Kleckner N 1989. Insertion sequence IS10 anti-sense pairing initiates by an interaction between the 5′ end of the target RNA and a loop in the anti-sense RNA. J Mol Biol 210: 561–572 [DOI] [PubMed] [Google Scholar]
- Lease RA, Woodson SA 2004. Cycling of the Sm-like protein Hfq on the DsrA small regulatory RNA. J Mol Biol 344: 1211–1223 [DOI] [PubMed] [Google Scholar]
- Li SK, Ng PK, Qin H, Lau JK, Lau JP, Tsui SK, Chan TF, Lau TC 2012. Identification of small RNAs in Mycobacterium smegmatis using heterologous Hfq. RNA 19: 74–84 [DOI] [PMC free article] [PubMed] [Google Scholar]
- Ma C, Simons RW 1990. The IS10 antisense RNA blocks ribosome binding at the transposase translation initiation site. EMBO J 9: 1267–1274 [DOI] [PMC free article] [PubMed] [Google Scholar]
- Mikulecky PJ, Kaw MK, Brescia CC, Takach JC, Sledjeski DD, Feig AL 2004. Escherichia coli Hfq has distinct interaction surfaces for DsrA, rpoS and poly(A) RNAs. Nat Struct Mol Biol 11: 1206–1214 [DOI] [PMC free article] [PubMed] [Google Scholar]
- Moller T, Franch T, Hojrup P, Keene DR, Bachinger HP, Brennan RG, Valentin-Hansen P 2002. Hfq: A bacterial Sm-like protein that mediates RNA-RNA interaction. Mol Cell 9: 23–30 [DOI] [PubMed] [Google Scholar]
- Moon K, Gottesman S 2011. Competition among Hfq-binding small RNAs in Escherichia coli. Mol Microbiol 82: 1545–1562 [DOI] [PMC free article] [PubMed] [Google Scholar]
- Olejniczak M 2011. Despite similar binding to the Hfq protein regulatory RNAs widely differ in their competition performance. Biochemistry 50: 4427–4440 [DOI] [PubMed] [Google Scholar]
- Opdyke JA, Kang JG, Storz G 2004. GadY, a small-RNA regulator of acid response genes in Escherichia coli. J Bacteriol 186: 6698–6705 [DOI] [PMC free article] [PubMed] [Google Scholar]
- Repoila F, Majdalani N, Gottesman S 2003. Small non-coding RNAs, co-ordinators of adaptation processes in Escherichia coli: The RpoS paradigm. Mol Microbiol 48: 855–861 [DOI] [PubMed] [Google Scholar]
- Rolle K, Zywicki M, Wyszko E, Barciszewska MZ, Barciszewski J 2006. Evaluation of the dynamic structure of DsrA RNA from E. coli and its functional consequences. J Biochem 139: 431–438 [DOI] [PubMed] [Google Scholar]
- Ross JA, Wardle SJ, Haniford DB 2010. Tn10/IS10 transposition is downregulated at the level of transposase expression by the RNA-binding protein Hfq. Mol Microbiol 78: 607–621 [DOI] [PubMed] [Google Scholar]
- Salim NN, Feig AL 2010. An upstream Hfq binding site in the fhlA mRNA leader region facilitates the OxyS-fhlA interaction. PLoS One 5: e13028. [DOI] [PMC free article] [PubMed] [Google Scholar]
- Sauer E, Schmidt S, Weichenrieder O 2012. Small RNA binding to the lateral surface of Hfq hexamers and structural rearrangements upon mRNA target recognition. Proc Natl Acad Sci 109: 9396–9401 [DOI] [PMC free article] [PubMed] [Google Scholar]
- Simons RW, Kleckner N 1983. Translational control of IS10 transposition. Cell 34: 683–691 [DOI] [PubMed] [Google Scholar]
- Sittka A, Lucchini S, Papenfort K, Sharma CM, Rolle K, Binnewies TT, Hinton JC, Vogel J 2008. Deep sequencing analysis of small noncoding RNA and mRNA targets of the global post-transcriptional regulator, Hfq. PLoS Genet 4: e1000163. [DOI] [PMC free article] [PubMed] [Google Scholar]
- Soper TJ, Woodson SA 2008. The rpoS mRNA leader recruits Hfq to facilitate annealing with DsrA sRNA. RNA 14: 1907–1917 [DOI] [PMC free article] [PubMed] [Google Scholar]
- Soper T, Mandin P, Majdalani N, Gottesman S, Woodson SA 2010. Positive regulation by small RNAs and the role of Hfq. Proc Natl Acad Sci 107: 9602–9607 [DOI] [PMC free article] [PubMed] [Google Scholar]
- Soper TJ, Doxzen K, Woodson SA 2011. Major role for mRNA binding and restructuring in sRNA recruitment by Hfq. RNA 17: 1544–1550 [DOI] [PMC free article] [PubMed] [Google Scholar]
- Studier FW, Moffatt BA 1986. Use of bacteriophage T7 RNA polymerase to direct selective high-level expression of cloned genes. J Mol Biol 189: 113–130 [DOI] [PubMed] [Google Scholar]
- Sun X, Wartell RM 2006. Escherichia coli Hfq binds A18 and DsrA domain II with similar 2:1 Hfq6/RNA stoichiometry using different surface sites. Biochemistry 45: 4875–4887 [DOI] [PubMed] [Google Scholar]
- Vecerek B, Moll I, Blasi U 2005. Translational autocontrol of the Escherichia coli hfq RNA chaperone gene. RNA 11: 976–984 [DOI] [PMC free article] [PubMed] [Google Scholar]
- Vogel J, Luisi BF 2011. Hfq and its constellation of RNA. Nat Rev Microbiol 9: 578–589 [DOI] [PMC free article] [PubMed] [Google Scholar]
- Vogel J, Papenfort K 2006. Small non-coding RNAs and the bacterial outer membrane. Curr Opin Microbiol 9: 605–611 [DOI] [PubMed] [Google Scholar]
- Wagner EG, Altuvia S, Romby P 2002. Antisense RNAs in bacteria and their genetic elements. Adv Genet 46: 361–398 [DOI] [PubMed] [Google Scholar]
- Wang RF, Kushner SR 1991. Construction of versatile low-copy-number vectors for cloning, sequencing and gene expression in Escherichia coli. Gene 100: 195–199 [PubMed] [Google Scholar]
- Waters LS, Storz G 2009. Regulatory RNAs in bacteria. Cell 136: 615–628 [DOI] [PMC free article] [PubMed] [Google Scholar]
- Zhang A, Wassarman KM, Ortega J, Steven AC, Storz G 2002. The Sm-like Hfq protein increases OxyS RNA interaction with target mRNAs. Mol Cell 9: 11–22 [DOI] [PubMed] [Google Scholar]


