

Translational bypassing is a unique phenomenon of bacteriophage T4 gene 60 mRNA wherein the bacterial ribosome produces a single polypeptide chain from a discontinuous open reading frame (ORF). Previous studies have suggested that a compact structure, including a stable hairpin, forms in the coding gap to induce bypassing, yet direct evidence is lacking. However, the authors show that it forms only a short stem–loop. The structural autonomy of the coding gap is consistent with its recently discovered role as a mobile genetic element inserted into gene 60 mRNA to inhibit cleavage by homing endonuclease MobA.
Keywords: discontinuous open reading frame, frameshift, bacterial translation, mRNA structure, SHAPE structure probing, terbium-mediated structure probing
Abstract
Translational bypassing is a unique phenomenon of bacteriophage T4 gene 60 mRNA wherein the bacterial ribosome produces a single polypeptide chain from a discontinuous open reading frame (ORF). Upon reaching the 50-nucleotide untranslated region, or coding gap, the ribosome either dissociates or bypasses the interruption to continue translating the remainder of the ORF, generating a subunit of a type II DNA topoisomerase. Mutational and computational analyses have suggested that a compact structure, including a stable hairpin, forms in the coding gap to induce bypassing, yet direct evidence is lacking. Here we have probed the secondary structure of gene 60 mRNA with both Tb3+ ions and the selective 2′-hydroxyl acylation analyzed by primer extension (SHAPE) reagent 1M7 under conditions where bypassing is observed. The resulting experimentally informed secondary structure models strongly support the presence of the predicted coding gap hairpin and highlight the benefits of using Tb3+ as a second, complementary probing reagent. Contrary to several previously proposed models, however, the rest of the coding gap is highly reactive with both probing reagents, suggesting that it forms only a short stem–loop. Mutational analyses coupled with functional assays reveal that two possible base-pairings of the coding gap with other regions of the mRNA are not required for bypassing. Such structural autonomy of the coding gap is consistent with its recently discovered role as a mobile genetic element inserted into gene 60 mRNA to inhibit cleavage by homing endonuclease MobA.
INTRODUCTION
Escherichia coli bacteriophage isolates in the T-even family contain a highly conserved type II DNA topoisomerase whose subunits are encoded by genes 52 and 39 (Hatfull 2008; Cresawn et al. 2011). In contrast, in bacteriophage T4 (T4) the conserved open reading frame (ORF) of gene 39 is disrupted by the insertion of an ∼1000-bp mobile DNA element. This insertion splits the N-terminal portion of the conserved gene 39 ORF from its C-terminal portion, which is encoded by the new T4 gene 60 (Fig. 1A; Hatfull 2008; Bonocora et al. 2011; Cresawn et al. 2011). The mobile DNA element encodes the homing endonuclease MobA, which catalyzes the transfer of the mobile DNA element between related phage genomes (Edgell et al. 2010; Bonocora et al. 2011). MobA recognizes and cleaves a specific sequence within the genomic DNA of gene 39 (Bonocora et al. 2011) just upstream of the coding region for the highly conserved Toprim motif (Fig. 1B), which coordinates a catalytic Mg2+ in the topoisomerase (Sissi and Palumbo 2009; Laponogov et al. 2010; Bonocora et al. 2011). Edges of the cleavage site are degraded by exonucleases, and the cleaved genome is repaired using a mobA-containing genome as a template, resulting in horizontal transfer of the mobA-containing mobile DNA element (Edgell et al. 2010; Bonocora et al. 2011). To prevent self-cleavage, genomes with the mobA genetic element contain an additional short insertion of 50 bp just downstream from the Toprim motif in the newly formed gene 60. The presence of this additional sequence is necessary and sufficient to completely inhibit MobA cleavage and further homing (Bonocora et al. 2011). Due to the proximity of this short insertion and mobA to the MobA cleavage site, both sequence elements are copied together into cleaved genomes, providing directionality for mobA transfer (Bonocora et al. 2011).
FIGURE 1.

Translational bypassing in bacteriophage T4 (T4) gene 60. (A) The conserved T-even gene 39 (gray portion of arrows) was split into two genes by the insertion of a mobile DNA element (black portion of arrows). The N-terminal portion of conserved gp39 is encoded by T4 gene 39, while the C-terminal portion is now encoded by T4 gene 60 and referred to as gp60. Sequence inserted by the mobile DNA element adds a negatively charged C terminus and termination signals to gp39 while adding initiation signals and a positively charged N terminus to gp60. These signals likely ensure the two protein fragments are translated and may provide a platform for re-association via electrostatic interactions. A second insertion of 50 nt in gene 60 (black striped region) called the coding gap is present in gene 60 mRNA but is skipped over during translation (black curved arrow). Two gp60 products are produced from this transcript: full-length gp60, which has undergone translational bypassing, and truncated gp60 from ribosomes unable to complete bypassing. (B) Sequence of gene 60 mRNA: The translated sequence is shown above gray ORF nucleotides, while coding gap nucleotides are black or colored. Take-off and landing codons (green), stop codons (red), potential SD element (blue), and potential tRNAGly landing site (purple) are labeled. Toprim motif amino acids are highlighted in orange (also orange box in A). The site of MobA cleavage is indicated. Potential stop codons in alternative reading frames within the coding gap are underlined in red. Nucleotides highlighted in green compose the hairpin at the 5′ edge of the coding gap. (C–F) Secondary structure models of the coding gap proposed by Huang et al. (1988) and Burke-Aguero et al. (1990) (C) and Le et al. (1993) (D–F; nucleotide colors as in B). Dark blue boxes in C represent the hypothetical location of the ribosomal acyl (A), peptidyl (P), and exit (E) sites.
In addition to assisting in MobA-catalyzed homing, the 50-bp insertion into gene 60 triggers an anomalous event at the mRNA level known as translational bypassing (Huang et al. 1988; Weiss et al. 1990; Maldonado and Herr 1998; Herr et al. 2000a,b, 2001; Wills et al. 2008). The insertion is not spliced out of the transcript, yet it is not translated (Fig. 1B; Huang et al. 1988). The untranslated 50 nucleotides (nt), known as the “coding gap,” are skipped over by the ribosome in ≈50% of translational events to produce a single polypeptide from two distinct ORFs (referred to hereafter as full-length gp60); the rest of the time a truncated gp60 is produced due to unsuccessful bypassing (Fig. 1A; Maldonado and Herr 1998; Herr et al. 2000b, 2001). Although originally discovered almost a quarter century ago (Huang et al. 1988), the exact mechanism by which the coding gap induces this unique ribosome bypassing is still unknown (Herr et al. 2000a,b, 2001; Wills et al. 2008; Uzan and Miller 2010). The simplest potential mechanism is an extension of the previously characterized “stop-hopping” (Herr et al. 2000a) or “starvation scanning” (Gallant and Lindsley 1998), wherein either the in-frame stop codon at the 5′ edge of the coding gap or a downstream structure in the mRNA triggers dissociation of the peptidyl-tRNAGly:mRNA interaction or “take-off.” The ribosome, still associated with the peptidyl-tRNAGly, then scans along the transcript until it encounters the Gly codon or “landing site” 50 nt away, at which time the peptidyl-tRNAGly rebinds the mRNA and the ribosome continues translation. Consistent with this notion, the coding gap is flanked on either side by matching Gly codons (Huang et al. 1988; Weiss et al. 1990; Maldonado and Herr 1998; Herr et al. 2000a,b, 2001; Bucklin et al. 2005; Wills et al. 2008) and contains a short Shine-Dalgarno (SD)–like element (Fig. 1B) that could align the P-site of the ribosome over the landing codon (Herr et al. 2000a; Wills et al. 2008). This simple mechanism is disfavored, however, by several observations. First, if the ribosome were scanning the coding gap, it would be expected to land most frequently at the Gly codon closest to the take-off site, which in the case of gene 60 mRNA is only 11 nt downstream from the take-off site. This closer Gly codon, however, is never used (Wills et al. 2008). Second, the efficiency of bypassing is 50% (Maldonado and Herr 1998; Herr et al. 2000b, 2001), which is much higher than the efficiency of stop-hopping (Herr et al. 2000a) and starvation scanning (scans of 22 nt and 40 nt are 20% and 1% efficient, respectively) (Gallant and Lindsley 1998). Third, if a scanning mechanism were employed, one would expect that deleting portions of the coding gap to bring the take-off and landing codons closer together would increase efficiency. In contrast, deletions in the coding gap decrease efficiency (Weiss et al. 1990; Herr et al. 2000a). Fourth, MobA homing always transfers the complete sequence of the coding gap (Repoila et al. 1994; Bonocora et al. 2011), suggesting that it is needed in its entirety for optimal bypassing. Taken together, these findings suggest that the ribosome is not scanning but is rather completely skipping over the coding gap in gene 60 mRNA.
Given these unique features of gene 60-mediated translational bypassing, several groups have proposed that the coding gap RNA adopts a compact structure to facilitate ribosomal bypassing (Fig. 1C–F; Huang et al. 1988; Burke-Aguero and Hearst 1990; Le et al. 1993; Wills et al. 2008). For example, Huang et al. (1988) proposed a secondary structure in the coding gap of gene 60 mRNA that would place the take-off codon adjacent to the codon following the landing site (Fig. 1C). In this conformation, the ribosome would not need to unwind and/or scan the coding gap region. As an extension of this structural model, Burke-Aguero et al. (1990) proposed that the UGGAU pentanucleotide repeats on either side of the coding gap might affect branch migration in a manner similar to the resolution of a Holliday junction. This would overcome challenges the ribosome may face translating over a discontinuity in the mRNA. In addition to this compact structure, computational predictions of gene 60 mRNA base-pairing by Le et al. (1993) suggest three additional conformations, all of which have folding free energies within 20% of each other (see Fig. 8D–F, below). Finally, Wills et al. (2008) demonstrated that the ribosome can land on codons upstream of the take-off site. To explain this phenomenon, the investigators suggested that once the peptidyl-tRNAGly dissociates from the mRNA, the coding gap region might fold into the A-site of the ribosome, pulling mRNA from both the 5′ and 3′ directions. Common to all of these models is a hairpin containing a tight-turning UUCG tetraloop at the 5′ edge of the coding gap (Fig. 1C–F; Huang et al. 1988; Burke-Aguero and Hearst 1990; Le et al. 1993; Wills et al. 2008).
FIGURE 8.

Compatibility between experimental probing data and previously proposed models. (A) Normalized reactivity for coding gap nucleotides from full-length gene 60 mRNA. Tb3+ data are red, and 1M7 data are blue. Shading is as described in Figure 3. (B) mRNA sequence of the gene 60 mRNA coding gap. Important coding gap features are labeled. Nucleotides are color-coded based on their Tb3+ reactivity range in full-length gene 60 mRNA, and the 5′ hairpin is shaded in green. Secondary structure models of the coding gap proposed by Huang et al. (1988) and Burke-Aguero et al. (1990) (C) and Le et al. (1993) (D–F; nucleotide colors as in B).
Extensive mutational analyses have been performed to test various hypotheses about the structural requirements for the coding gap, in particular concerning the presence of the 5′ hairpin (Huang et al. 1988; Weiss et al. 1990; Maldonado and Herr 1998; Herr et al. 2000a,b, 2001; Bucklin et al. 2005; Wills et al. 2008). This hairpin is crucial for bypassing, as mutants destabilizing the stem or extending the loop greatly decrease bypassing efficiency (Weiss et al. 1990; Herr et al. 2000a,b; Wills et al. 2008). Identification of protein products by mass spectrometry from the translation of these hairpin mutants revealed that part of the decrease in efficiency arises from landing at the closer Gly codon 11 nt downstream from the take-off site (Fig. 1B). The stability of the 5′ hairpin thus appears to modulate the relative partitioning of the ribosome into bypassing versus scanning of the coding gap region (Wills et al. 2008). Other features known to be important for bypassing are matching take-off and landing codons (Huang et al. 1988; Weiss et al. 1990; Maldonado and Herr 1998; Herr et al. 2000a,b, 2001; Bucklin et al. 2005; Wills et al. 2008), an in-frame stop codon at the 5′ edge of the coding gap (Weiss et al. 1990; Herr et al. 2000a,b), and the short potential SD-like element just upstream of the landing codon (Fig. 1B; Wills et al. 2008). Finally, bypassing is stimulated by the nascent peptide sequence that lies in the ribosomal exit tunnel as the ribosome approaches the coding gap of gene 60 mRNA (Weiss et al. 1990; Lovett 1994; Larsen et al. 1995; Choi and Brimacombe 1998; Choi et al. 1998; Herr et al. 2000a,b, 2001; Wills et al. 2008).
Despite decades of extensive mutational and computational studies suggesting various secondary structure models for the coding gap (Huang et al. 1988; Burke-Aguero and Hearst 1990; Le et al. 1993; Wills et al. 2008), the structure of gene 60 mRNA has not yet been directly probed. To test the existing structural hypotheses and their relationship to bypassing, we have experimentally assessed the structure of gene 60 mRNA using limited chemical probing with Tb3+ ions and a selective 2′-hydroxyl acylation analyzed by primer extension (SHAPE) reagent under buffer conditions conducive to bypassing, and we find Tb3+ to yield a thermodynamically more stable structural model. As expected, the predicted UUCG-tetraloop hairpin forms at the 5′ edge of the coding gap. Contrary to most previously predicted models, however, we find that the remainder of the coding gap is not significantly structured. Furthermore, mutational analyses coupled with functional assays show that several potential base-pairings between the coding gap and other portions of gene 60 mRNA likely exist in solution but are not required for bypassing. The structurally autonomous nature of the coding gap region is consistent with its role as a collaborative homing partner in the horizontal transfer of genetic material.
RESULTS
Conditions for translation and bypassing of gene 60 mRNA in vitro
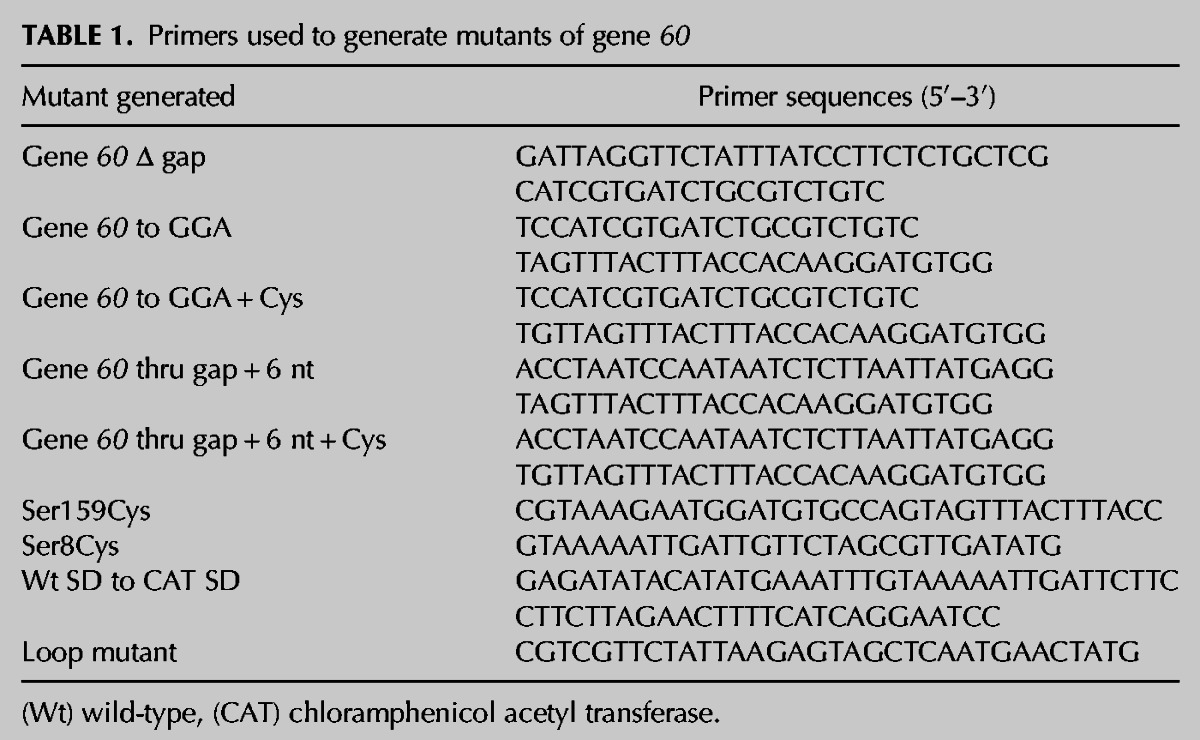
Prior to structure probing, we sought to determine appropriate buffer conditions under which gene 60 mRNA adopts its functional fold. To this end, we optimized the conditions for observing translational bypassing in a cell-free translation assay (see Materials and Methods). Briefly, mRNA was prepared by in vitro run-off transcription and gel purification. Purified transcripts were added to S30 bacterial cell extract in the presence of 35S-Met, and SDS-PAGE was used to resolve the products resulting from in vitro translation. Figure 2A illustrates the various gene 60 mRNA constructs generated for this study (PCR primers used to prepare mutants are listed in Table 1). As expected, for wild-type gene 60 mRNA we observed two predominant bands corresponding in molecular mass to truncated and full-length gp60 (Fig. 2B). Quantification of the bands indicated bypassing levels of ∼50%, in accordance with previous reports (Maldonado and Herr 1998; Herr et al. 2000b, 2001).
FIGURE 2.

In vitro translational bypassing of T4 gene 60 mRNA. (A) Schematic of T4 gene 60 mRNA and mutant transcripts prepared to validate in vitro translation assay. ORF and coding gap regions are depicted by light gray and black rectangles, respectively. Take-off and landing Gly codons are dark gray, while stop codons and positions of added Cys residues are indicated by boxes marked by an X and striped boxes, respectively. White boxes on either edge of each transcript represent the 5′ and 3′ UTRs, whose sequences are identical for each mutant. Transcripts are not drawn to scale. (B) In vitro translation of each of the transcripts in A in the presence either 35S-Met or 35S-Cys. The asterisk indicates ambiguity of translational bypassing in the gene 60 thru gap + Cys construct (for details, see text). (C) Native gel of the indicated transcripts.
TABLE 1.
Primers used to generate mutants of gene 60
To further support the identity of these two bands, several mutants of gene 60 mRNA were prepared (Fig. 2A). Complete deletion of the 50-nt coding gap (“60 Δ gap”) generated only a single protein product corresponding to the full-length gp60 band, whereas truncation of gene 60 mRNA after the in-frame stop codon in the coding gap (“60 to gap”) produced only truncated gp60 band, both as expected (Fig. 2B). Furthermore, we realized that full-length gp60 contains no natural Cys residues and exploited this feature by mutating Ser8 to Cys as a second way to observe both products of translational bypassing. Alternatively, Ser159, the second-to-last residue of gp60, was mutated to Cys to specifically indicate translation of the entire gene 60. Both mutations were introduced into the wild-type “60” as well as the mutant “60 Δ gap” mRNAs. We found that “60 S8C” mRNA produced two protein products identical to those of wild-type in the presence of either 35S-Met or 35S-Cys, whereas “60 Δ gap S8C” mRNA produced only full-length gp60 under both conditions, as expected (Fig. 2B). In contrast, when translated in the presence of 35S-Cys, the S159C mutants of both “60” and “60 Δ gap” mRNAs yielded a single band corresponding to full-length gp60 (Fig. 2B), confirming that this band is in fact a translation product of the entire gene 60 ORF. Finally, gene 60 mRNA was truncated after the in-frame stop codon at the beginning of the coding gap (“60 to gap”). A Cys residue was incorporated into this construct before the stop codon, just after the take-off Gly, and the proteins resulting from translation in the presence of either 35S-Met or 35S-Cys were identical in size to that of the truncated gp60, further verifying the identity of this band (Fig. 2B). The above results indicate that our assay conditions sufficiently replicate the characteristics of translational bypassing of gene 60 mRNA observed in prior studies (Maldonado and Herr 1998; Herr et al. 2000b, 2001).
We also sought to test the importance of the 3′ portion of gene 60 mRNA, as translational bypassing is observed even if the sequence beyond the fifth nucleotide after the coding gap is replaced with a lacZ reporter (Weiss et al. 1990). To test this hypothesis, we generated a mutant of gene 60 that terminates 6 nt (or two amino acids) after the coding gap (“60 thru gap”). The product of bypassing in this shortened construct, however, could not be distinguished from the truncated gp60 band due to their very small difference in molecular weight. The addition of Cys as a third amino acid after the coding gap should only yield a product if translational bypassing has occurred. However, as indicated by the asterisk in Figure 2B, when translating mutant “60 thru gap + Cys” in the presence of 35S-Cys, a product of the appropriate size could not reliably be detected over background. This observation suggests that the ribosome requires additional, yet nonspecific, sequence after the coding gap as a landing platform (such as the lacZ reporter used by Weiss et al. 1990).
Gene 60 mRNA adopts an ensemble of structures in solution
After determining appropriate buffer conditions for probing gene 60’s functional fold(s), we next sought to examine the folding homogeneity of the mRNA. To this end, gene 60 mRNA was prepared in the same buffer used for in vitro translation (S30 buffer), and structural populations were resolved by native gel electrophoresis or by electrophoretic mobility shift assay (EMSA, Materials and Methods). Refolded, wild-type gene 60 mRNA segregates into a slower migrating EMSA band and two faster migrating, diffuse bands (Fig. 2C). The fraction of gene 60 mRNA in each band remained constant as the mRNA concentration was varied from 0 to 500 nM (data not shown), indicating that the slower migrating species is a less compact fold and not the result of multimerization. The existence of multiple conformations is not surprising considering gene 60’s length of 686 nt. Accordingly, both the “60 Δ gap” and much shorter “60 thru gap” mRNAs migrated as more homogeneous folds (Fig. 2C). As the 3′ segment of gene 60 can be replaced with nonspecific sequence while maintaining bypassing (Weiss et al. 1990), our “60 thru gap” mRNA must contain all segments of gene 60 mRNA that are functionally essential for bypassing. Because we could not unequivocally demonstrate bypassing activity in this shortened mRNA, however, we probed the secondary structures of both the full-length “60” and minimal “60 thru gap” mRNAs for comparison.
Secondary structural models of gene 60 mRNA based on Tb3+ and SHAPE probing
Structure probing of gene 60 mRNA was carried out using the capillary electrophoresis (CE)–based high-throughput analysis method described by Weeks and coworkers (Vasa et al. 2008; Wilkinson et al. 2008; Watts et al. 2009; Low and Weeks 2010). Briefly, in vitro transcribed, gel-purified mRNA was refolded in the same S30 buffer where we observed bypassing, and probed with either 1 mM Tb3+ ions as described (Walter et al. 2000; Harris and Walter 2003, 2005; Jeong et al. 2003; Harris et al. 2004; Sefcikova et al. 2007a,b) or 2 mM of the SHAPE reagent 1M7 (Mortimer and Weeks 2007; Gherghe et al. 2008, 2010; Watts et al. 2009). These two complementary reagents target accessible 2′-OH groups, either to deprotonate them and cleave the adjacent phosphodiester bond (Tb3+) or to acylate them (1M7). Modified nucleotides were then identified as stops in primer extension of fluorescently labeled DNA primers. The resulting cDNAs were resolved by CE, and electropherograms were analyzed with the ShapeFinder software (Vasa et al. 2008). Data were then normalized on a scale from zero to approximately one, such that highly reactive, single-stranded nucleotides had an average reactivity of one (Mortimer and Weeks 2008). On this normalized scale, 1M7 reacted overall slightly more strongly than Tb3+, giving an average reactivity along the mRNA of ∼0.43 ± 0.12 compared with ∼0.35 ± 0.06 for Tb3+. Although addition of 1 mM Tb3+ to probing reactions altered the ionic strength by <3%, ions of greater charge density, such as Tb3+, can preferentially stabilize structural elements (including tertiary structures) in an RNA by shielding its negatively charged backbone (Walter et al. 2000; Harris and Walter 2003, 2005; Jeong et al. 2003; Harris et al. 2004; Newby Lambert et al. 2006; Sefcikova et al. 2007b). This feature is a plausible cause for the on average lower overall reactivity of gene 60 mRNA to Tb3+ ions than to the neutral SHAPE reagent. To allow us to directly compare reactivity differences between the two reagents at each nucleotide, the reactivity at each nucleotide position was renormalized such that the average reactivity throughout gene 60 mRNA was set to 0.40 for both reagents.
The pattern of reactivity with gene 60 mRNA nucleotides is generally similar between the two reagents (Fig. 3A), indicating that the data sets capture similar structures. The few regions where the patterns are significantly different are evident from the difference plot of Figure 3B. These differences tend to occur at highly reactive nucleotides. Generally, the range of normalized reactivity for each nucleotide from three independent experiments is less than 0.1 normalized units, as observed for SHAPE reagents previously (Vasa et al. 2008; Watts et al. 2009). For some highly reactive nucleotides, however, the extent of modification varied significantly, leading to higher uncertainty. Narrowly defined values, however, may not be required as long as highly reactive nucleotides are restrained as single-stranded during folding (Vasa et al. 2008).
FIGURE 3.
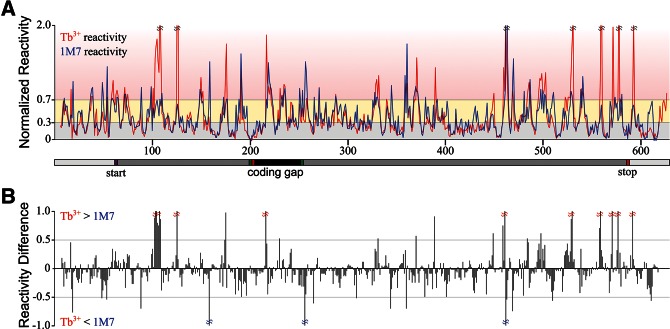
Comparison of Tb3+ and 1M7 reactivity for gene 60 mRNA. (A) Average normalized reactivity of each nucleotide with Tb3+ (red) or 1M7 (blue). The x-axis indicates the nucleotide position in gene 60 mRNA, with the gene 60 translation start site and coding gap region indicated. Shading indicates range of nucleotide reactivity: unreactive (gray), moderately reactive (yellow), and highly reactive (red). (B) Difference between average Tb3+ and 1M7 reactivity at each nucleotide position along gene 60 mRNA (x-axis scale is identical to that in A).
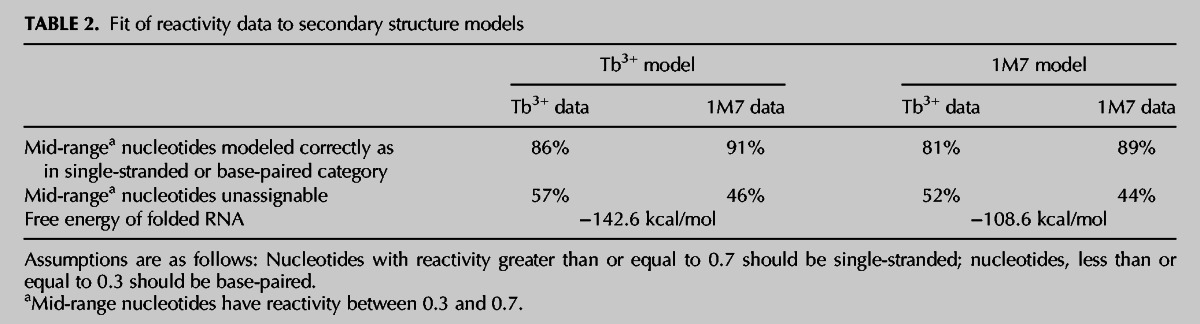
Average reactivities at each nucleotide position were then used as pseudo-free energy constraints during folding with the Max Expect algorithm in RNAstructure (Reuter and Mathews 2010); the structural models resulting from probing with Tb3+ and 1M7 are presented in Figures 4 and 5, respectively. Nucleotides are color-coded to show their normalized reactivity range; colored dots next to each nucleotide show the normalized reactivity range for the second reagent, as indicated. Overall, the structures fit the data well; highly reactive nucleotides are modeled to reside in single-stranded loops and bulges, whereas unreactive nucleotides are buried in secondary structural elements. The statistical consistency between constraint and prediction was calculated for each model (Materials and Methods), and the results are presented in Table 2. Strikingly, both data sets fit the Tb3+ model slightly better than the 1M7 model. Additionally, the predicted free energy of folding of the Tb3+ model is significantly (by 34 kcal/mol) lower than that of the 1M7 model (Table 2). Interestingly, all highly hit Tb3+ sites are in regions that the 1M7 model predicts as single-stranded or at the ends of stems (Fig. 5). In contrast, a few examples of strong 1M7 hits occur in the middle of stable stems in the Tb3+ model (Fig. 4, nucleotides A19, G54, C266). These few strongly hit nucleotides inconsistent with the Tb3+ model likely disfavor corresponding stems during the folding calculations, leading to the significantly higher free energy of the 1M7 model. At thermodynamic equilibrium in solution, this difference is expected to lead to a several orders-of-magnitude preference for the Tb3+ over the 1M7 fold. Finally, a minimal free energy structure generated based on the average of the normalized Tb3+ and 1M7 reactivities did not significantly differ from that generated based on the Tb3+ data alone (data not shown). Based on these results, we conclude that the Tb3+ model is the favored conformation of gene 60 mRNA in solution.
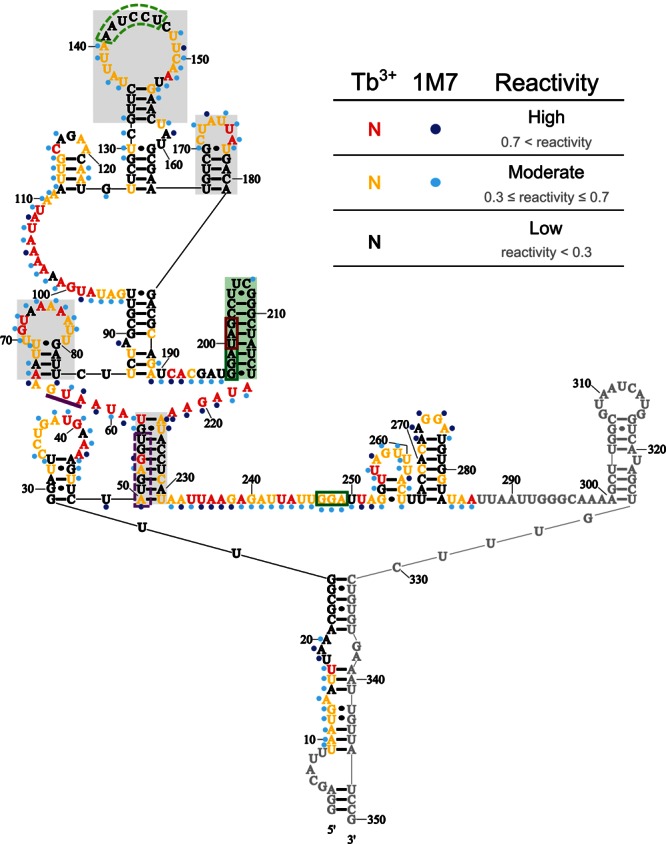
FIGURE 4.

Secondary structure model of gene 60 mRNA generated from Tb3+ data. The mRNA is rendered from 5′ to 3′ from left to right. Nucleotides are color-coded based on their reactivity range: low reactivity (black), moderate reactivity (orange), high reactivity (red). Colored circles indicate nucleotides that are moderately (light blue) or highly (dark blue) reactive with the 1M7 SHAPE reagent. The gene 60 start codon is underlined in purple, the take-off and landing codons are boxed in green, and stop codons are boxed in red. The hairpin at the 5′ edge of the coding gap is shaded in green. Large and small purple triangles represent major and minor AMV reverse transcriptase stops, respectively, as determined by Huang et al. (1988). The SD of gene 60 mRNA and protected loop nucleotides (for details, see text) are enclosed in dashed purple and light green boxes, respectively.
FIGURE 5.

Secondary structure model of gene 60 mRNA generated from 1M7 data. The mRNA is rendered from 5′ to 3′ from left to right. Nucleotides are color-coded based on their reactivity range: low reactivity (black), moderate reactivity (light blue), high reactivity (dark blue). Colored circles indicate nucleotides that are moderately (orange) or highly (red) reactive with Tb3+. The gene 60 start codon is underlined in purple, the take-off and landing codons are boxed in green, and stop codons are boxed in red. The hairpin at the 5′ edge of the coding gap is shaded in green. Large and small purple triangles represent major and minor AMV reverse transcriptase stops, respectively, as determined by Huang et al. (1988). The SD of gene 60 mRNA and protected loop nucleotides (for details, see text) are enclosed in dashed purple and light green boxes, respectively.
TABLE 2.
Fit of reactivity data to secondary structure models
A structural model of the minimal “60 thru gap” mRNA resembles that of the full-length mRNA
We noticed that in both of our experimentally derived full-length gene 60 mRNA structural models, the 5′ and 3′ portions of the mRNA fold relatively independently of one another (i.e., tend to form local structure elements such as long stem–loops) (Figs. 4, 5). This feature is functionally supported by the fact that the entire 3′ portion of gene 60 mRNA can be replaced by a lacZ reporter without disrupting translational bypassing (Huang et al. 1988; Weiss et al. 1990). Thus, any structural features critical for translational bypassing must not require a specific sequence in the 3′ end of gene 60 mRNA. Furthermore, the 5′ portion of gene 60 known to be involved in bypassing (embodied in the “60 thru gap” mRNA) migrates as a single homogeneous population during EMSA (Fig. 2C), indicating it is a good candidate for structure probing.
The minimal gene “60 thru gap” mRNA was thus probed with both Tb3+ and SHAPE reagents. We found extensive similarities in reactivity between the minimal and full-length gene 60 mRNAs (Fig. 6A,C). A structural model of the “60 thru gap” mRNA derived from the Tb3+-mediated probing data is shown in Figure 7 (1M7 data overlaid; structure not shown), and structural features in common between full-length and truncated gene 60 mRNA probed with Tb3+ are shaded. The extensive similarities between the truncated and full-length models for both probing reagents validate the 5′ portions of our full-length gene 60 mRNA models (Figs. 4, 5). They also suggest that the majority of the heterogeneity in full-length mRNA on the native gel (Fig. 2C) arises from multiple conformations in the 3′ end that do not greatly influence the structure of the functional 5′ portion.
FIGURE 6.

Comparison of reactivity between full-length gene 60 and gene 60 thru gap mRNA. (A) Normalized average reactivity from Tb3+ probing for full-length gene 60 (red) and gene 60 thru gap (green) mRNA. The x-axis indicates the nucleotide position in gene 60 mRNA, with gene 60 translation start site and coding gap region indicated. Shading is as described in Figure 3. (B) Difference between full-length gene 60 and gene 60 thru gap Tb3+ reactivity at each nucleotide position (x-axis scale is identical to that in A). (C) Normalized average reactivity from 1M7 probing for full-length gene 60 (blue) and gene 60 thru gap (green) mRNA. (D) Difference between full-length gene 60 and gene 60 thru gap 1M7 reactivity at each nucleotide position (x-axis scale is identical to that in C).
FIGURE 7.
Secondary structure model of gene 60 thru gap mRNA consistent with Tb3+ data with 1M7 data overlaid. Colors and symbols are as described in Figure 4. The 5′ hairpin is shaded in green, while other structural features in common between full-length and gene 60 thru gap mRNA are shaded gray.
A difference plot between the reactivities of the truncated and full-length mRNAs emphasizes the similarity between the two structures (Fig. 6B,D). For almost all nucleotides, the difference in reactivity is well below 0.5 normalized units. Upon Tb3+ probing, U126 shows the most extreme difference between the full-length and gene “60 thru gap” mRNAs. This nucleotide is very reactive in full-length, while only modestly reactive in the truncated mRNA. This variation could be because this nucleotide becomes involved in more local interactions and/or loses a metal binding site in the truncated form. The very 3′ end of the coding gap shows some minor differences between the two mRNAs, but the disparity in reactivity is likely due to changes in local environment caused by loss of the immediate downstream sequence in the truncated mRNA. Notably, the differences between the reactivities of the truncated and full-length mRNAs are more pronounced upon 1M7 probing, again consistent with the notion that Tb3+ better stabilizes the consensus structure of the conformational ensembles that are probed in both mRNAs.
A 5′ hairpin and a short stem–loop are the only predominant features in the coding gap
We next asked which of the multiple compact structures of the coding gap region previously suggested to induce translational bypassing on gene 60 mRNA (Fig. 1C–F; Huang et al. 1988; Burke-Aguero and Hearst 1990; Le et al. 1993; Wills et al. 2008) is most consistent with our experimentally validated secondary structure. Common to all of these models is a tight-turning hairpin at the 5′ edge of the coding gap (Weiss et al. 1990; Herr et al. 2000a,b; Wills et al. 2008). Consistent with this predicted hairpin, we find nucleotides 197–216 all highly protected from both reagents, with an average reactivity of 0.11 ± 0.07 for Tb3+ and 0.18 ± 0.12 for 1M7 (Fig. 8A). Low reactivity includes the 2′-hydroxyls of the loop region of the hairpin, which is expected given that the tight turn of UUCG-loops is generated by intramolecular hydrogen bonding of the 2′-hydroxyls of the first three loop nucleotides (Ennifar et al. 2000). Based on our reactivity data, it appears that the stem only extends through the take-off Gly codon, despite the potential for two additional Watson-Crick base pairs to form (Fig. 8B–F). In addition to extensive mutational analyses (Weiss et al. 1990; Herr et al. 2000a, b; Wills et al. 2008), a compact fold in this region is also supported by a major stop of AMV reverse transcriptase between nucleotides 211 and 212 (Figs. 4, 5, large purple triangle; Huang et al. 1988). Taken together, these data clearly support the presence of a hairpin at the 5′ edge of the coding gap.
In contrast, the rest of the coding gap (nucleotides 217–249) reacted strongly with both reagents, producing an average reactivity of 0.54 ± 0.10 for Tb3+ and 0.50 ± 0.14 for 1M7. These data were unexpected given the potential for significant intramolecular base-pairing among these nucleotides and suggested that there is little (consistent) structure in the 3′ portion of the coding gap. An overlay of the Tb3+ reactivity from full-length gene 60 mRNA onto previously proposed models in Figure 8, C–F, reveals that only a short stem–loop between the 5′ hairpin and the 3′ end of the coding gap is compatible with our experimental data (Fig. 8F). Lack of other well-defined structural motifs in this region may explain why mutational analyses in this region could not clearly support or refute any predicted structural features important for bypassing (Weiss et al. 1990).
Translational bypassing does not require base-pairing between the SD sequence and the coding gap
While both experimentally derived secondary structure models of gene 60 mRNA contain the predicted hairpin at the 5′ edge of the coding gap, each renders its 3′ portion differently. The 1M7 model contains only the short stem–loop that fits our data from both reagents well (Fig. 8A,F). The Tb3+ models of both full-length and truncated gene 60 mRNA, however, render the coding gap in a base-pairing interaction with the strongly protected SD sequence of gene 60 mRNA (Figs. 4, 7). The complementarity of these regions was first noted in the original discovery of translational bypassing (Huang et al. 1988) but did not appear to be functionally critical (Huang et al. 1988; Weiss et al. 1990; Maldonado and Herr 1998; Herr et al. 2000b, 2001; Wills et al. 2008). To further test this notion, we prepared a gene 60 construct with a mutated SD sequence (CAT SD) that is no longer able to form extensive base-pairing interactions with the coding gap (Fig. 9A). Structure probing of this variant with either Tb3+ (Fig. 9B) or 1M7 (Fig. 9C) indeed showed an increase in the relative accessibility of part of the SD-complementary sequence in the coding gap, as expected, but the mutant yielded wild-type levels of translational bypassing (Fig. 9D). These observations suggest that SD:coding gap interaction, while present in a significant subset of molecules in solution, plays no functional role in translational bypassing. Accordingly, probing data of our bypassing-competent CAT SD gene 60 mRNA are consistent with a 5′ hairpin and short 3′ stem–loop in the coding gap (Fig. 9E), identical to the structure supported by wild-type SD gene 60 mRNA. These results are consistent with the notions that the SD sequence needs to be single-stranded for ribosomes to bind and initiate translation.
FIGURE 9.
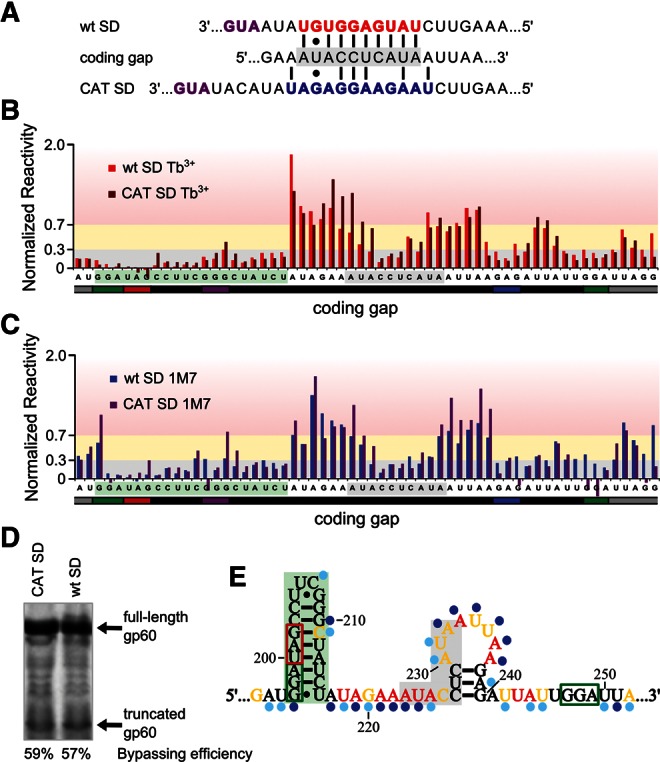
The coding gap reactivity does not change significantly in the absence of the wild-type gene 60 SD (wt SD). (A) Mutation of the wild-type gene 60 SD (red) to that of the chloramphenicol acetyl transferase (CAT) gene (blue). Start codons are purple, and the portion of the coding gap complementary to the wt SD is shaded in gray. (B) Comparison of reactivity of wt SD gene 60 (red) and CAT SD gene 60 (brown) coding gap nucleotides with Tb3+. The 5′ hairpin nucleotides are shaded in green, and the portion of the coding gap complementary to the wt SD is shaded in gray. (C) Comparison of reactivity of wt SD gene 60 (blue) and CAT SD gene 60 (purple) coding gap nucleotides with 1M7. (D) In vitro translation products of gene 60 with the wt or CAT SD. Bypassing efficiency for each template is indicated. (E) Secondary structure model of the coding gap region generated from probing data for CAT SD gene 60 mRNA (both Tb3+ and 1M7 probing generated models contain this coding gap structure). Shading is as described in B, and colors and symbols are as described in Figure 4.
Base-pairing between a protected loop complementary to the take-off and landing sites is not required for bypassing
Intriguingly, nucleotides 141–146 reside in a large loop in the Tb3+ models (Figs. 4, 7), yet are highly protected from both reagents. As nucleotides in large loops are usually very flexible and highly reactive, we searched for potential Watson-Crick binding partners of the protected nucleotides. Strikingly, the protected nucleotides are complementary to both the take-off and landing codons. We therefore asked whether these nucleotides may in some way be involved in translational bypassing. They reside in the coding region for the critical nascent peptide sequence involved in bypassing (Weiss et al. 1990; Lovett 1994; Larsen et al. 1995; Choi and Brimacombe 1998; Choi et al. 1998; Herr et al. 2000a,b, 2001; Wills et al. 2008). Previous mutations of this region to synonymous codons demonstrated that the protein sequence rather than the nucleotide sequence is critical for bypassing (Weiss et al. 1990). We independently verified this result by mutating the protected nucleotides to synonymous codons, disrupting their ability to interact with the take-off and landing codons; we observed no effect on translational bypassing (data not shown).
There are several other potential base-pairing partners for loop nucleotides 141–147 throughout the length of gene 60 mRNA. In the 1M7 model, these protected residues are paired with nucleotides 277–282. They are also complementary to nucleotides 29–33 within the 5′ UTR, 52–55 in the SD of gene 60 mRNA, 312–315, 398–401, 444–447, 530–534, 552–555, and 609–613, the loop of the likely natural transcription terminator for gene 60. As protection of nucleotides 141–147 is observed in a truncated version of gene 60 mRNA as well (Fig. 7), the most likely base-pairing partners are nucleotides 29–33 and 52–55. Yet these interactions, if present in solution, are not required for translational bypassing.
Alternatively, the protected loop nucleotides may indicate a local structural motif. Similar C- and U-rich loop regions in other RNAs have been found to have low reactivity toward SHAPE reagents (Legiewicz et al. 2010), in part because of the slightly lower reactivity of C and U nucleotides compared with A and G (Wilkinson et al. 2009). Our Tb3+ data, however, exhibit the same protection of these nucleotides as 1M7. Since runs of Cs can form helices that are significantly more stable than those of other homopolymers (Seol et al. 2007), it is conceivable that there exists a local stabilizing structure in this region that protects it from structure probing reagents.
The coding gap in gene 60 mRNA is structurally autonomous
Based on the results presented thus far, it appears that the coding gap (1) is mostly unstructured except for the 5′ hairpin and a short downstream stem–loop, (2) does not interact with sequence 3′ of the landing codon, and (3) does not need to interact with complementary regions in the 5′ region of gene 60 mRNA, specifically the SD or protected loop nucleotides 141–147, for bypassing to occur. To further test this apparent structural autonomy of the coding gap, we probed the structure of the gene 60 mRNA that lacks the entire 50-nt insertion (“60 Δ gap”). Figure 10 compares both the 1M7 and Tb3+ reactivities at each nucleotide position along the gene 60 and “60 Δ gap” mRNAs. Difference plots reveal that the patterns and intensities of reactivity along the two mRNAs are almost identical (Fig. 10B,D). Minor perturbations in reactivity observed on either side of the coding gap are likely caused by changes in local structural environment in the presence or absence of the coding gap. Accordingly, predicting the secondary structure of gene “60 Δ gap” mRNA using RNAstructure and either the Tb3+ or 1M7 reactivity data as pseudo-free energy constraints generated structures almost identical to those of the wild-type gene 60 mRNA (data not shown). We conclude that the coding gap is an independent sequence element that only weakly interacts with any other part of gene 60 mRNA, as its removal has no significant impact on the remainder of the structure.
FIGURE 10.

Comparison of reactivity between gene 60 and gene 60 Δ gap mRNA. (A) Normalized average reactivity from 1M7 probing for gene 60 (dark blue) and gene 60 Δ gap (light blue) mRNA. The x-axis indicates the nucleotide position in gene 60 mRNA, with the gene 60 translation start site and coding gap region indicated. Shading is as described in Figure 3. (B) Difference between gene 60 and gene 60 Δ gap mRNA 1M7 reactivity at each nucleotide position (x-axis scale is identical to that in A). (C) Normalized average reactivity from Tb3+ probing for gene 60 (red) and gene 60 Δ gap (brown) mRNA. (D) Difference between gene 60 and gene 60 Δ gap Tb3+ reactivity at each nucleotide position (x-axis scale is identical to that in C).
DISCUSSION
Under in vitro conditions where T4 bacteriophage gene 60 mRNA shows a typical translational bypassing efficiency of 50%, structure probing using either Tb3+ or SHAPE reagents, which both detect the accessibility of 2′-OH groups, yields distinct secondary structure models. The Tb3+-derived model fits better to both data sets and is thermodynamically more stable, consistent with the notion that Tb3+ ions stabilize a major solution structure of the mRNA. Key differences between the models occur at the SD sequence of gene 60 mRNA, which is single-stranded in the 1M7 model but forms extensive base-pairing interactions with the coding gap in the Tb3+ model. Conversely, six unreactive nucleotides with potential complementarity to the take-off and landing sites are involved in unrelated base-pairing interactions in the 1M7 model yet are rendered single-stranded in a large loop in the Tb3+ model. We found both of these potential base-pairing interactions with the coding gap to be unnecessary for translational bypassing. Furthermore, the sequence downstream from the coding gap also does not interact with the coding gap or the 5′ region of gene 60 mRNA, as probing of a minimal, more homogenously folded mRNA (“60 thru gap”) generates similar structures to the 5′ portion of full-length models. Given the sum of this structural and functional information, we conclude that the functional coding gap only requires a very stable 5′ hairpin and a short downstream stem–loop (Fig. 8F). This model of the coding gap is consistent with only one of several models previously proposed by Le et al. (1993) based on a purely computational prediction of secondary structures that are energetically within 20% of the lowest-energy conformation (Fig. 8F). The coding gap thus does not functionally require any base-pairing with an upstream or downstream sequence, making it structurally autonomous.
There are several possible origins for the systematic reactivity differences we observe between the Tb3+ and SHAPE probing reagents, even after careful normalization and cross-validation of the data sets. First, since cationic metal ions often critically stabilize secondary and tertiary structure elements in negatively charged RNA, the addition of trivalent Tb3+ ions may capture transiently sampled structures in gene 60 mRNA, leading to a lower reactivity of some nucleotides with Tb3+ than with 1M7. Conversely, SHAPE reagents were recently found to preferably react with nucleotides on whose nucleo bases they can stack (Steen et al. 2012), suggesting that they may have an effect opposite that of Tb3+ by destabilizing intramolecular (stacking) interactions in the probed RNA. Second, several nucleotides that are well-ordered in the small ribosomal crystal structure have been shown to be hyper-reactive to SHAPE reagents. This unexpectedly high reactivity was attributed to local effects such as potential general base catalysis by RNA functional groups and specific orientations of the flanking 3′ phosphate group (McGinnis et al. 2012), which may occur in gene 60 mRNA as well. Third, Tb3+ ions bind preferentially to and can displace metals from cation binding sites (Hargittai and Musier-Forsyth 2000; Walter et al. 2000). Nucleotides proximal to specific metal ion binding sites may thus be expected to be more reactive to Tb3+, while potentially being protected from SHAPE reagents. Fourth, potential differences in reactivity may arise due to the difference in timescale at which the two reagents modify RNA. At 37°C, Tb3+ reactions were incubated for 30 min, whereas 1M7 reactions are complete after only 4 min. Because Tb3+ reacts more slowly than 1M7, the Tb3+ data may be more likely to average over slowly interchanging conformations of the RNA, while 1M7 data are expected to reflect a shorter “snapshot” of an RNA structure (Gherghe et al. 2008). This difference may be particularly significant in light of the fact that our EMSA analysis revealed that gene 60 mRNA adopts an ensemble of conformations (Fig. 2C), which may interchange. It should further be noted that a recent error assessment of SHAPE-derived structural models found a significant frequency of each ∼20% false-negative and false-positive discovery, independent of variations in data processing, normalization, and modeling parameters (Kladwang et al. 2011). This error rate is consistent with the extent of discrepancies between our Tb3+ and 1M7 models and suggests that the inclusion of a second reagent class, such as Tb3+ ions, may generally be advisable to obtain more reliable results from secondary structure probing experiments.
Highly structured segments, such as pseudoknots and stable hairpins, have been shown to modulate the movement of the ribosome along an mRNA inducing shifts in reading frame (Farabaugh 1996; Herr et al. 2000a; Kontos et al. 2001; Giedroc and Cornish 2009; Mazauric et al. 2009; Chou and Chang 2010; Chung et al. 2010), presumably due to the difficulty that the ribosome has unwinding complex, stable structures (Firth and Brierley 2012). In these cases, multiple protein products are encoded in overlapping reading frames, and the efficiency of the frameshifting event determines the relative ratio at which each protein is expressed (Farabaugh 1996; Chou and Chang 2010). In these ways, mRNA provides additional layers of regulation for gene expression beyond those at the DNA and protein levels (Herr et al. 2000a; Kontos et al. 2001). When probing the secondary structure of an mRNA, highly structured regions in an ORF or between ORFs often indicate critical points for regulation during translation (Watts et al. 2009). In contrast, coding regions of mRNAs are relatively unstructured compared with regulatory elements, presumably to prevent significant delays during translation (Wilkinson et al. 2008; Watts et al. 2009). An example is found in the HIV-1 genome, where the 335-nt-long 5′ UTR contains several well-known, highly structured regulatory elements required for viral replication and packaging, whereas the next ∼600-nt code for viral proteins. In accordance with these functional differences, the median SHAPE reactivity in the 5′ UTR was 0.13, whereas coding regions had a median reactivity of 0.40 (Wilkinson et al. 2008). Thus, probing data accurately reflect the facts that regulatory regions of mRNA are structured and coding regions tend to lack such structures.
Our final model of the bypassing-competent secondary structure of the coding gap is inconsistent with the previous expectation to find significant secondary structure to choreograph translational bypassing. (Huang et al. 1988; Burke-Aguero and Hearst 1990; Le et al. 1993; Wills et al. 2008). In contrast, we have shown that aside from the stable 5′ hairpin, the coding gap contains little additional structure with itself or the rest of gene 60 mRNA in solution. This autonomy is consistent with the recent finding that the coding gap is a foreign DNA element (Bonocora et al. 2011) that can be inserted into genes whose sequences do not necessarily contain regions of complementary. Although mostly unstructured, the entire coding gap is important for bypassing as deletions of its 3′ portion reduce bypassing efficiency (Weiss et al. 1990; Herr et al. 2000a), and the entire and exact sequence of the coding gap is always transmitted during MobA homing (Repoila et al. 1994; Bonocora et al. 2011). The unstructured portion could function as a single-stranded spacer and ribosome landing platform, fold into a distinct structure cotranslationally, and/or recruit cellular cofactors required for bypassing. In the minimum, it provides a potential SD-like sequence for anchoring the ribosome near the landing codon (Fig. 1B), analogous to the recent observation that SD-like sequences in coding regions often cause transient ribosome arrest (Li et al. 2012).
The site of take-off during translational bypassing occurs within the critical hairpin structure of the coding gap. To decode the take-off Gly codon, the ribosome presumably must first unwind this stable hairpin as it only allows single-stranded RNA to pass into the mRNA entry tunnel (Culver 2001). After decoding the Gly codon, the in-frame stop codon would lie directly in the A-site, ready to trigger termination by RF2. At natural cellular levels of RF2, however, termination does not compete with bypassing since all ribosomes take-off even though only ∼50% are able to complete the bypassing event and continue translating (Herr et al. 2000b). This observation indicates either that bypassing must initiate quickly after decoding of the take-off Gly codon or that some other feature prevents RF2 from sampling the A-site stop codon. In the crystal structure of the 70S ribosome bound to a short (36-nt) mRNA, the mRNA forms a hairpin with a 4-bp stem and a tetraloop in the A-site of the ribosome, overlapping the natural codon-anticodon interaction region (Yusupova et al. 2001). With the take-off Gly codon in the P-site, the top portion of the 5′ hairpin in the coding gap could similarly form a short hairpin in the A-site, preventing recognition of the stop codon by RF2. This model is supported by the fact that the UUCG loop found in the 5′ hairpin has a propensity to form a tight structure, stabilized by an extensive hydrogen bonding network (Ennifar et al. 2000). For Huang et al. (1988), this hairpin generated a major stop between nucleotides 211 and 212 during primer extension with AMV reverse transcriptase (Figs. 4, 5); it also caused persistent peak compression in our electropherograms of cDNAs ending in nucleotides complementary to 202–205 (data not shown). In the crystal structure of the 70S ribosome, slippage may have occurred due to the short length of the mRNA (Yusupova et al. 2001), whereas in the case of gene 60 mRNA, stalling of the ribosome may allow the top of the 5′ hairpin to reform and reject RF2. In addition, the N terminus of the nascent peptide chain has been found to cross-link with the peptidyl-transferase center (Choi and Brimacombe 1998) as well as to ribosomal proteins S1, S2, S3, and S4 (Choi et al. 1998). S3, S4, and S5 form a tunnel through which single-stranded mRNA is brought into the peptidyl transferase center (Culver 2001). Thus, it is possible that the nascent peptide sequence alters the geometry of the decoding center and/or interferes with the natural unwinding ability of the mRNA entrance tunnel, allowing extra mRNA to enter and fold in the A-site.
Alternative to just the top of the 5′ hairpin folding in the A-site, Wills et al. (2008) identified protein products of bypassing to codons upstream of the take-off site, which supports the notion that mRNA can be pulled into the A-site from the 5′ direction. The investigators hypothesized that, once released from the peptidyl-tRNA, the entire coding gap may be pulled from both the 3′ and 5′ directions to fold in the A-site. Furthermore, toeprinting of small ribosomal subunits bound in the presence of charged tRNAs to an mRNA containing the coding gap sequence just downstream from a strong SD element is significantly shorter than expected for a linear mRNA (Ringquist et al. 1993). These results are consistent with the idea that the entire coding gap may be able to fold into a compact structure only in the presence of the ribosome. Future structural studies of gene 60 mRNA in the presence of the ribosome may be able to resolve this question; free in solution, however, our data show that such a more compact secondary structure is at most a minor conformation.
MATERIALS AND METHODS
Preparation of gene 60 mRNA mutants
A clone of gene 60 in pUC19 was generated by PCR directly from the T4 phage genome. This construct contained the gene 60 ORF, flanked by 61 nt of its natural 5′ UTR and 41 nt of its natural 3′ UTR, under transcriptional control of a T7 promoter. Site-directed mutagenesis to prepare all mutants was performed as follows. Briefly, primers (Invitrogen) were phosphorylated with T4 polynucleotide kinase (New England Biolabs) and used to amplify portions of gene 60 by PCR in the presence of Taq DNA ligase (New England Biolabs). Following digestion of template plasmids with DpnI (New England Biolabs), mutant plasmids were transformed into JM109 cells (Promega), and resulting clones were sequenced to confirm mutations. Primers used for site-directed mutagenesis are listed in Table 1.
Gene 60 mRNA was transcribed in vitro for 1 h at 37°C with 50 nM plasmid linearized with BsrBI (New England Biolabs), 40 mM Tris-HCl (pH 8.0), 25 mM MgCl2, 100 mM NaCl, 0.01% Triton-X, 5 mM DTT, 1 mM spermidine, 12 mM each NTP, 0.01 units/μL pyrophosphatase (MP Biomedicals), and 0.065 mg/ml T7 RNA polymerase (homemade). RNA was purified by denaturing PAGE and stored at −20°C in TE (10 mM Tris-HCl at pH 7.0, 1 mM EDTA).
In vitro translation assay conditions
S30 extracts were prepared essentially according to the method previously described (Pratt 1984) from BL21 Star(DE3) cells (Invitrogen) after induction of T7 RNA polymerase for 1.5 h at 37°C. In vitro translation reactions were carried out as according to the method described previously (Kigawa et al. 2004). Briefly, 10 μL reactions contained 4 μL of 2.5× S30 premix (S30 buffer [55 mM Hepes-KOH, at pH 7.5, 210 mM potassium glutamate, 27.5 mM ammonium acetate, 10.7 mM magnesium acetate, 1.7 mM DTT], 1.2 mM ATP, 0.8 mM CTP, 0.8 mM GTP, 0.8 mM UTP, 640 μM cAMP, 68 μM folinic acid, 175 μg/mL total tRNA from E. coli MRE600 [Roche], 80 mM creatine phosphate, 75 U creatine phosphokinase [Roche], 4% [w/v] PEG 8000); 2 μL S30 extract; 50 nM mRNA or DNA template; 0.1–1 μL of 10 μCi/μL 35S-Met, or 35S-Cys (∼1 μCi per reaction); and water (as necessary). Reactions were assembled on ice and incubated for 30 min at 37°C. One microliter of 1 M KOH was added to quench the reaction and cleave any remaining peptide from their tRNAs. Protein products were precipitated with 50 μL of cold acetone and pelleted by centrifugation at 20,000 rcf for 10 min at room temperature. Pellets were resuspended in 15 μL of 1× loading buffer (100 mM Tris-HCl at pH 6.8, 24% glycerol, 2% [w/v] SDS, 200 mM DTT, 0.02% Coomassie blue), and protein products were resolved on a 20% Tris-Tricine gel at 150 V for ∼4 h or until dye ran completely off the gel. Gels were soaked for 1 h in 5% (v/v) glycerol, 40% (v/v) methanol, and 10% (v/v) acetic acid and dried onto 3-mm Whatman paper (Biorad Model 583 Gel Dryer). A phosphor storage screen and Typhoon 9410 Variable Mode Imager (GE Healthcare Life Sciences) were used to quantify bands, and bypassing efficiency was calculated as the intensity of full-length gp60 divided by the sum of intensities from full-length and truncated gp60 bands. We note that full-length gp60 contains twice as many Met residues as truncated gp60; therefore when labeling with 35S-Met, the intensity of full-length gp60 was divided by two before comparison to truncated gp60 intensity.
Structure determination of gene 60 mRNA
Gene 60 mRNA was probed essentially according to the method previously described (Harris and Walter 2003, 2005; Jeong et al. 2003; Harris et al. 2004; Sefcikova et al. 2007b; Watts et al. 2009). Briefly, a pool of gene 60 mRNA was diluted to 0.2 pmol/μL in TE (pH 7.0), heat denatured for 1 min at 90°C, and snap cooled on ice. The mRNA pool was refolded in S30 buffer for 15 min at 37°C. Refolded mRNA was divided into individual tubes containing 1 pmol (9 μL) each. Multiple negative control reactions and dideoxy sequencing reactions were performed in parallel as pools.
For Tb3+ probing, 1 μL of a 10 mM stock of TbCl3 in water was added to each reaction sample, and 1 μL of water was added to negative controls. Reactions were incubated for 30 min at 37°C and quenched by adding 1 μL of 50 mM EDTA (Harris and Walter 2003, 2005). SHAPE probing was performed similarly, wherein 1 μL of a 20 mM stock of SHAPE reagent in DMSO was added to each reaction sample, and 1 μL of neat DMSO was added to negative controls. SHAPE reactions were incubated at 37°C for five reagent half-lives (4 min), and then 1 μL of 50 mM EDTA was added (Watts et al. 2009). Each sample was precipitated with 1 μL of 20 μg/μL glycogen per pmol RNA, 1/10 volume of 3 M NH4OAc and 3 volumes of ethanol. The RNA was pelleted by centrifugation at 20,000 rcf for 30 min at 4°C, washed with 70% (v/v) ethanol, and dried under vacuum.
5′ Fluorophore-labeled probes were ordered from Invitrogen (with 6-FAM, HEX, and ROX) or Applied Biosystems (NED). Two primers were necessary to obtain data for the entire length of gene 60 mRNA (686 nt). The first primer was complementary to the very 3′ end of gene 60 mRNA (5′-CGGATAACAATTTCACACAGGAAACAGC-3′), whereas the second bound to gene 60 mRNA just after the coding gap from nucleotides 338–359 (5′-CCGACCTGAGCGATGATTACAG-3′). Chemically probed RNAs were resuspended with 10 μL of 0.5× TE (pH 8.0) and annealed with 3 μL of 400 nM fluorophore-labeled primer for 5 min at 65°C, followed by 2 min at 45°C. Seven microliters of reverse transcription master mix (4 μL Invitrogen Superscript III first strand buffer, 1 μL 100 mM DTT, 1 μL 10 mM dNTPs, and 1 μL Invitrogen SuperScript III Reverse Transcriptase) was preheated for 1 min to 45°C and added to each reaction tube. Once mixed, reactions were transferred for 5 min to 52°C, followed by 5 min at 65°C, and then placed on ice. Dideoxy sequencing reactions were performed on the gene 60 mRNA according to the method previously described (Watts et al. 2009) except that each reverse transcription reaction also contained 500 nM of either ddATP or ddTTP. Twenty microliters of the probing reaction, the negative control, and each of the dideoxy sequencing reactions were combined and precipitated with 1/10 volume of NH4OAc and 3 volumes of ethanol. cDNA was pelleted by centrifugation at 20,000 rcf for 30 min at 4°C, washed with 70% (v/v) ethanol, and dried under vacuum. Pellets were resuspended in 12 μL of Hi-Di Formamide (Applied Biosystems) and loaded onto a 96-well optical reaction plate (Applied Biosystems). Plates were submitted to the University of Michigan Sequencing Core for fragment analysis by CE on an Applied Biosystems 3730XL capillary sequencer.
Raw electropherograms were analyzed with the ShapeFinder software (Vasa et al. 2008) and normalized in Excel according to the method previously described (Mortimer and Weeks 2008). The data presented are the average of three independent structure probing experiments, and the relative error at each nucleotide position is generally less than 0.1 normalized units (Vasa et al. 2008; Watts et al. 2009). Structural models were generated using the Max Expect and ProbKnot functions in RNAstructure (Reuter and Mathews 2010) using the normalized reactivity of each nucleotide as pseudo-free energy constraints. Both algorithms produced similar structures, indicating that no pseudoknots were supported by our experimental data. The resulting secondary structures were rendered in Inkscape (http://inkscape.org/). A rough estimate of the congruency between each data set and each model was derived by assuming nucleotides with reactivity >0.7 should be single-stranded and nucleotides with reactivity <0.3 should be structured (we note that these calculations do not take into account causes other than Watson-Crick base pairs for low reactivity). Two separate calculations were performed, one assuming nucleotides with reactivity between 0.3 and 0.7 were correctly rendered in our model regardless of their environment (single- or double-stranded). In the second calculation, these mid-range nucleotides were deemed not assignable. The results of these calculations are presented in Table 2.
Electrophoretic mobility shift assay (EMSA)
One microgram of each mRNA was refolded in S30 buffer as described above and resolved on a 6% THEMA native gel (34 mM Tris, 66 mM HEPES, 100 μM EDTA, and 10 mM magnesium acetate) (Woodson 2001) for 7 h at 4°C and 15 W. Gels were stained in 1× SYBR Gold (Invitrogen) for 20 min, and bands were visualized by UV illumination.
ACKNOWLEDGMENTS
We thank Rachel Green (Johns Hopkins University) and Hani Zaher (Washington University in St. Louis) for protocols, reagents, training, and helpful discussions pertaining to in vitro translation; John Hoerter (Genomics Institute of the Novartis Research Foundation) for generating the original pUC19 plasmid containing gene 60; Kevin Weeks (University of North Carolina at Chapel Hill) for help with setting up our SHAPE probing; and the group of Roger Sunahara (University of Michigan) for a mutagenesis protocol. We also thank Walter lab members Paul Lund and Matthew Marek for critical reading of this manuscript, and the latter for preparation of the SHAPE reagent 1M7. We acknowledge funding from NIH grant R01 GM062357.
REFERENCES
- Bonocora RP, Zeng Q, Abel EV, Shub DA 2011. A homing endonuclease and the 50-nt ribosomal bypass sequence of phage T4 constitute a mobile DNA cassette. Proc Natl Acad Sci 108: 16351–16356 [DOI] [PMC free article] [PubMed] [Google Scholar]
- Bucklin DJ, Wills NM, Gesteland RF, Atkins JF 2005. P-site pairing subtleties revealed by the effects of different tRNAs on programmed translational bypassing where anticodon re-pairing to mRNA is separated from dissociation. J Mol Biol 345: 39–49 [DOI] [PubMed] [Google Scholar]
- Burke-Aguero DH, Hearst JE 1990. An RNA Holliday junction? Structural and dynamic considerations of the bacteriophage T4 gene 60 interruption. J Mol Biol 213: 199–201 [DOI] [PubMed] [Google Scholar]
- Choi KM, Brimacombe R 1998. The path of the growing peptide chain through the 23S rRNA in the 50S ribosomal subunit; a comparative cross-linking study with three different peptide families. Nucleic Acids Res 26: 887–895 [DOI] [PMC free article] [PubMed] [Google Scholar]
- Choi KM, Atkins JF, Gesteland RF, Brimacombe R 1998. Flexibility of the nascent polypeptide chain within the ribosome—Contacts from the peptide N-terminus to a specific region of the 30S subunit. Eur J Biochem 255: 409–413 [DOI] [PubMed] [Google Scholar]
- Chou MY, Chang KY 2010. An intermolecular RNA triplex provides insight into structural determinants for the pseudoknot stimulator of −1 ribosomal frameshifting. Nucleic Acids Res 38: 1676–1685 [DOI] [PMC free article] [PubMed] [Google Scholar]
- Chung BY, Firth AE, Atkins JF 2010. Frameshifting in alphaviruses: A diversity of 3′ stimulatory structures. J Mol Biol 397: 448–456 [DOI] [PubMed] [Google Scholar]
- Cresawn SG, Bogel M, Day N, Jacobs-Sera D, Hendrix RW, Hatfull GF 2011. Phamerator: A bioinformatic tool for comparative bacteriophage genomics. BMC Bioinformatics 12: 395. [DOI] [PMC free article] [PubMed] [Google Scholar]
- Culver GM 2001. Meanderings of the mRNA through the ribosome. Structure 9: 751–758 [DOI] [PubMed] [Google Scholar]
- Edgell DR, Gibb EA, Belfort M 2010. Mobile DNA elements in T4 and related phages. Virol J 7: 290. [DOI] [PMC free article] [PubMed] [Google Scholar]
- Ennifar E, Nikulin A, Tishchenko S, Serganov A, Nevskaya N, Garber M, Ehresmann B, Ehresmann C, Nikonov S, Dumas P 2000. The crystal structure of UUCG tetraloop. J Mol Biol 304: 35–42 [DOI] [PubMed] [Google Scholar]
- Farabaugh PJ 1996. Programmed translational frameshifting. Microbiol Rev 60: 103–134 [DOI] [PMC free article] [PubMed] [Google Scholar]
- Firth AE, Brierley I 2012. Non-canonical translation in RNA viruses. J Gen Virol 93: 1385–1409 [DOI] [PMC free article] [PubMed] [Google Scholar]
- Gallant JA, Lindsley D 1998. Ribosomes can slide over and beyond “hungry” codons, resuming protein chain elongation many nucleotides downstream. Proc Natl Acad Sci 95: 13771–13776 [DOI] [PMC free article] [PubMed] [Google Scholar]
- Gherghe CM, Mortimer SA, Krahn JM, Thompson NL, Weeks KM 2008. Slow conformational dynamics at C2′-endo nucleotides in RNA. J Am Chem Soc 130: 8884–8885 [DOI] [PMC free article] [PubMed] [Google Scholar]
- Gherghe C, Lombo T, Leonard CW, Datta SA, Bess JW Jr, Gorelick RJ, Rein A, Weeks KM 2010. Definition of a high-affinity Gag recognition structure mediating packaging of a retroviral RNA genome. Proc Natl Acad Sci 107: 19248–19253 [DOI] [PMC free article] [PubMed] [Google Scholar]
- Giedroc DP, Cornish PV 2009. Frameshifting RNA pseudoknots: Structure and mechanism. Virus Res 139: 193–208 [DOI] [PMC free article] [PubMed] [Google Scholar]
- Hargittai MR, Musier-Forsyth K 2000. Use of terbium as a probe of tRNA tertiary structure and folding. RNA 6: 1672–1680 [DOI] [PMC free article] [PubMed] [Google Scholar]
- Harris DA, Walter NG 2003. Probing RNA structure and metal-binding sites using terbium(III) footprinting. Curr Protoc Nucleic Acid Chem Chapter 6: Unit 6.8 10.1002/0471142700.nc0608s13 [DOI] [PubMed] [Google Scholar]
- Harris DA, Walter NG 2005. Terbium(III) Footprinting as a probe of RNA structure and metal-binding sites. In Handbook of RNA biochemistry (ed. Hartmann RK, et al. ), pp. 205–213 Wiley-VCH, Weinheim [Google Scholar]
- Harris DA, Tinsley RA, Walter NG 2004. Terbium-mediated footprinting probes a catalytic conformational switch in the antigenomic hepatitis delta virus ribozyme. J Mol Biol 341: 389–403 [DOI] [PubMed] [Google Scholar]
- Hatfull GF 2008. Bacteriophage genomics. Curr Opin Microbiol 11: 447–453 [DOI] [PMC free article] [PubMed] [Google Scholar]
- Herr AJ, Atkins JF, Gesteland RF 2000a. Coupling of open reading frames by translational bypassing. Annu Rev Biochem 69: 343–372 [DOI] [PubMed] [Google Scholar]
- Herr AJ, Gesteland RF, Atkins JF 2000b. One protein from two open reading frames: Mechanism of a 50 nt translational bypass. EMBO J 19: 2671–2680 [DOI] [PMC free article] [PubMed] [Google Scholar]
- Herr AJ, Wills NM, Nelson CC, Gesteland RF, Atkins JF 2001. Drop-off during ribosome hopping. J Mol Biol 311: 445–452 [DOI] [PubMed] [Google Scholar]
- Huang WM, Ao SZ, Casjens S, Orlandi R, Zeikus R, Weiss R, Winge D, Fang M 1988. A persistent untranslated sequence within bacteriophage T4 DNA topoisomerase gene 60. Science 239: 1005–1012 [DOI] [PubMed] [Google Scholar]
- Jeong S, Sefcikova J, Tinsley RA, Rueda D, Walter NG 2003. Trans-acting hepatitis delta virus ribozyme: Catalytic core and global structure are dependent on the 5′ substrate sequence. Biochemistry 42: 7727–7740 [DOI] [PubMed] [Google Scholar]
- Kigawa T, Yabuki T, Matsuda N, Matsuda T, Nakajima R, Tanaka A, Yokoyama S 2004. Preparation of Escherichia coli cell extract for highly productive cell-free protein expression. J Struct Funct Genomics 5: 63–68 [DOI] [PubMed] [Google Scholar]
- Kladwang W, VanLang CC, Cordero P, Das R 2011. Understanding the errors of SHAPE-directed RNA structure modeling. Biochemistry 50: 8049–8056 [DOI] [PMC free article] [PubMed] [Google Scholar]
- Kontos H, Napthine S, Brierley I 2001. Ribosomal pausing at a frameshifter RNA pseudoknot is sensitive to reading phase but shows little correlation with frameshift efficiency. Mol Cell Biol 21: 8657–8670 [DOI] [PMC free article] [PubMed] [Google Scholar]
- Laponogov I, Pan XS, Veselkov DA, McAuley KE, Fisher LM, Sanderson MR 2010. Structural basis of gate-DNA breakage and resealing by type II topoisomerases. PLoS One 5: e11338. [DOI] [PMC free article] [PubMed] [Google Scholar]
- Larsen B, Peden J, Matsufuji S, Matsufuji T, Brady K, Maldonado R, Wills NM, Fayet O, Atkins JF, Gesteland RF 1995. Upstream stimulators for recoding. Biochem Cell Biol 73: 1123–1129 [DOI] [PubMed] [Google Scholar]
- Le SY, Chen JH, Maizel JV Jr 1993. Identification of unusual RNA folding patterns encoded by bacteriophage T4 gene 60. Gene 124: 21–28 [DOI] [PMC free article] [PubMed] [Google Scholar]
- Legiewicz M, Zolotukhin AS, Pilkington GR, Purzycka KJ, Mitchell M, Uranishi H, Bear J, Pavlakis GN, Le Grice SF, Felber BK 2010. The RNA transport element of the murine musD retrotransposon requires long-range intramolecular interactions for function. J Biol Chem 285: 42097–42104 [DOI] [PMC free article] [PubMed] [Google Scholar]
- Li GW, Oh E, Weissman JS 2012. The anti-Shine-Dalgarno sequence drives translational pausing and codon choice in bacteria. Nature 484: 538–541 [DOI] [PMC free article] [PubMed] [Google Scholar]
- Lovett PS 1994. Nascent peptide regulation of translation. J Bacteriol 176: 6415–6417 [DOI] [PMC free article] [PubMed] [Google Scholar]
- Low JT, Weeks KM 2010. SHAPE-directed RNA secondary structure prediction. Methods 52: 150–158 [DOI] [PMC free article] [PubMed] [Google Scholar]
- Maldonado R, Herr AJ 1998. Efficiency of T4 gene 60 translational bypassing. J Bacteriol 180: 1822–1830 [DOI] [PMC free article] [PubMed] [Google Scholar]
- Mazauric MH, Seol Y, Yoshizawa S, Visscher K, Fourmy D 2009. Interaction of the HIV-1 frameshift signal with the ribosome. Nucleic Acids Res 37: 7654–7664 [DOI] [PMC free article] [PubMed] [Google Scholar]
- McGinnis JL, Dunkle JA, Cate JH, Weeks KM 2012. The mechanisms of RNA SHAPE chemistry. J Am Chem Soc 134: 6617–6624 [DOI] [PMC free article] [PubMed] [Google Scholar]
- Mortimer SA, Weeks KM 2007. A fast-acting reagent for accurate analysis of RNA secondary and tertiary structure by SHAPE chemistry. J Am Chem Soc 129: 4144–4145 [DOI] [PubMed] [Google Scholar]
- Mortimer SA, Weeks KM 2008. Time-resolved RNA SHAPE chemistry. J Am Chem Soc 130: 16178–16180 [DOI] [PubMed] [Google Scholar]
- Newby Lambert M, Vocker E, Blumberg S, Redemann S, Gajraj A, Meiners JC, Walter NG 2006. Mg2+-induced compaction of single RNA molecules monitored by tethered particle microscopy. Biophys J 90: 3672–3685 [DOI] [PMC free article] [PubMed] [Google Scholar]
- Pratt JM 1984. Coupled transcription-translation in prokaryotic cell-free systems. IRL Press, New York [Google Scholar]
- Repoila F, Tetart F, Bouet JY, Krisch HM 1994. Genomic polymorphism in the T-even bacteriophages. EMBO J 13: 4181–4192 [DOI] [PMC free article] [PubMed] [Google Scholar]
- Reuter JS, Mathews DH 2010. RNAstructure: Software for RNA secondary structure prediction and analysis. BMC Bioinformatics 11: 129. [DOI] [PMC free article] [PubMed] [Google Scholar]
- Ringquist S, MacDonald M, Gibson T, Gold L 1993. Nature of the ribosomal mRNA track: Analysis of ribosome-binding sites containing different sequences and secondary structures. Biochemistry 32: 10254–10262 [DOI] [PubMed] [Google Scholar]
- Sefcikova J, Krasovska MV, Spackova N, Sponer J, Walter NG 2007a. Impact of an extruded nucleotide on cleavage activity and dynamic catalytic core conformation of the hepatitis delta virus ribozyme. Biopolymers 85: 392–406 [DOI] [PubMed] [Google Scholar]
- Sefcikova J, Krasovska MV, Sponer J, Walter NG 2007b. The genomic HDV ribozyme utilizes a previously unnoticed U-turn motif to accomplish fast site-specific catalysis. Nucleic Acids Res 35: 1933–1946 [DOI] [PMC free article] [PubMed] [Google Scholar]
- Seol Y, Skinner GM, Visscher K, Buhot A, Halperin A 2007. Stretching of homopolymeric RNA reveals single-stranded helices and base-stacking. Phys Rev Lett 98: 158103. [DOI] [PubMed] [Google Scholar]
- Sissi C, Palumbo M 2009. Effects of magnesium and related divalent metal ions in topoisomerase structure and function. Nucleic Acids Res 37: 702–711 [DOI] [PMC free article] [PubMed] [Google Scholar]
- Steen KA, Rice GM, Weeks KM 2012. Fingerprinting noncanonical and tertiary RNA structures by differential SHAPE reactivity. J Am Chem Soc 134: 13160–13163 [DOI] [PMC free article] [PubMed] [Google Scholar]
- Uzan M, Miller ES 2010. Post-transcriptional control by bacteriophage T4: mRNA decay and inhibition of translation initiation. Virol J 7: 360. [DOI] [PMC free article] [PubMed] [Google Scholar]
- Vasa SM, Guex N, Wilkinson KA, Weeks KM, Giddings MC 2008. ShapeFinder: A software system for high-throughput quantitative analysis of nucleic acid reactivity information resolved by capillary electrophoresis. RNA 14: 1979–1990 [DOI] [PMC free article] [PubMed] [Google Scholar]
- Walter NG, Yang N, Burke JM 2000. Probing non-selective cation binding in the hairpin ribozyme with Tb(III). J Mol Biol 298: 539–555 [DOI] [PubMed] [Google Scholar]
- Watts JM, Dang KK, Gorelick RJ, Leonard CW, Bess JW Jr, Swanstrom R, Burch CL, Weeks KM 2009. Architecture and secondary structure of an entire HIV-1 RNA genome. Nature 460: 711–716 [DOI] [PMC free article] [PubMed] [Google Scholar]
- Weiss RB, Huang WM, Dunn DM 1990. A nascent peptide is required for ribosomal bypass of the coding gap in bacteriophage T4 gene 60. Cell 62: 117–126 [DOI] [PMC free article] [PubMed] [Google Scholar]
- Wilkinson KA, Gorelick RJ, Vasa SM, Guex N, Rein A, Mathews DH, Giddings MC, Weeks KM 2008. High-throughput SHAPE analysis reveals structures in HIV-1 genomic RNA strongly conserved across distinct biological states. PLoS Biol 6: e96. [DOI] [PMC free article] [PubMed] [Google Scholar]
- Wilkinson KA, Vasa SM, Deigan KE, Mortimer SA, Giddings MC, Weeks KM 2009. Influence of nucleotide identity on ribose 2′-hydroxyl reactivity in RNA. RNA 15: 1314–1321 [DOI] [PMC free article] [PubMed] [Google Scholar]
- Wills NM, O’Connor M, Nelson CC, Rettberg CC, Huang WM, Gesteland RF, Atkins JF 2008. Translational bypassing without peptidyl-tRNA anticodon scanning of coding gap mRNA. EMBO J 27: 2533–2544 [DOI] [PMC free article] [PubMed] [Google Scholar]
- Woodson SA 2001. Probing RNA folding pathways by RNA fingerprinting. Curr Protoc Nucleic Acid Chem Chapter 11: Unit 11.4 10.1002/047114270.nc1104s02 [DOI] [PMC free article] [PubMed] [Google Scholar]
- Yusupova GZ, Yusupov MM, Cate JH, Noller HF 2001. The path of messenger RNA through the ribosome. Cell 106: 233–241 [DOI] [PubMed] [Google Scholar]