. 2013 Jun 4;2:e00411. doi: 10.7554/eLife.00411

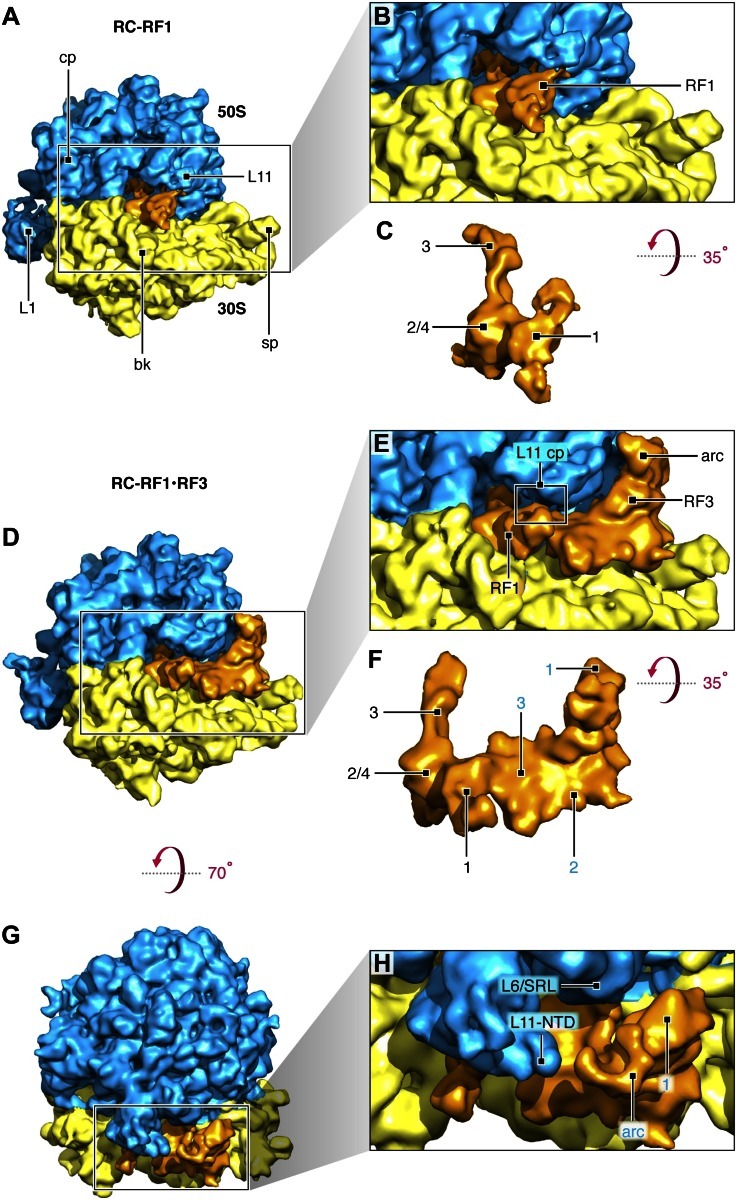
Figure 2. Termination complexes in association with RF1 alone and with both RF1 and apo-RF3.

(A) RC-RF1 (resolution 8.4 Å). (B) Close-up of RF1 in the map. (C) RF1 density from (B). Domains 1, 2/4 and 3 of RF1 are labeled. (D) RC–RF1•RF3 (resolution 9.7 Å). (E) Close-up of RF1and apo-RF3 in the map. RF1 contacts both L11—L11 contact point is labeled ‘L11 cp’— and apo-RF3. (F) Density of RF1 and RF3 from (E): RF1 domains labeled in black and RF3 domains 1, 2 and 3 in blue. (G)–(H) In the RC–RF1•RF3 complex, apo-RF3 does not interact with L11 or L6/SRL. Labels: 30S: small ribosomal subunit (yellow), 50S: large ribosomal subunit (blue), cp: central protuberance, L11: ribosomal protein L11, sp: spur, bk: beak, L1: L1 stalk, RF1: release factor 1, RF3: release factor 3, L6/SRL: position of ribosomal protein L6 and the sarcin/ricin loop, L11-NTD: ribosomal protein L11 N-terminal domain, arc: arc-like density. Density maps obtained from the total data set and of the RC-class not occupied by RF1 or RF3 are presented in Figure 2—figure supplement 1 and Figure 2—figure supplement 2, respectively. Additional panels of isolated RF1- and RF1, apo-RF3-densities are presented in Figure 2—figure supplement 3. FSC curves for resolution assessment of all density maps obtained can be found in Figure 2—figure supplement 4.

DOI: http://dx.doi.org/10.7554/eLife.00411.004

Figure 2.

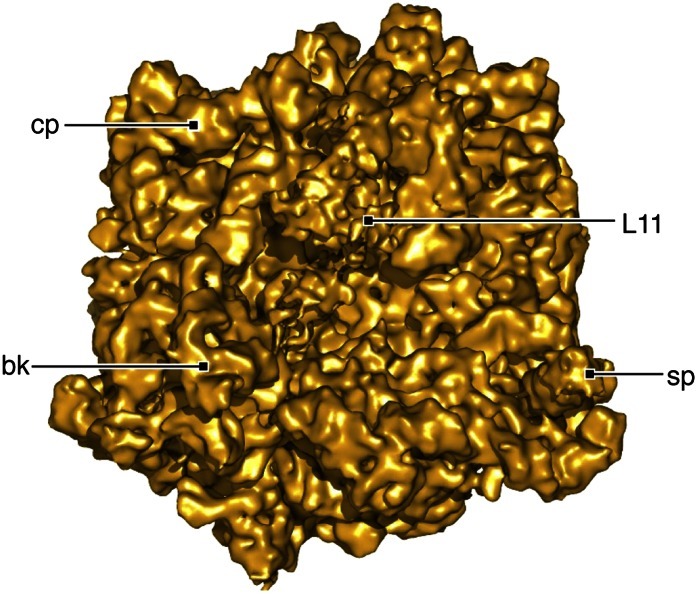
Figure 2—figure supplement 1. Density map resulting from refinement of the full data set.

Figure 2—figure supplement 1.

Map is displayed at a resolution of 6.3 Å in accordance with a Fourier shell correlation (FSC) of 0.14 between half sets. Labels same as in Figure 2.
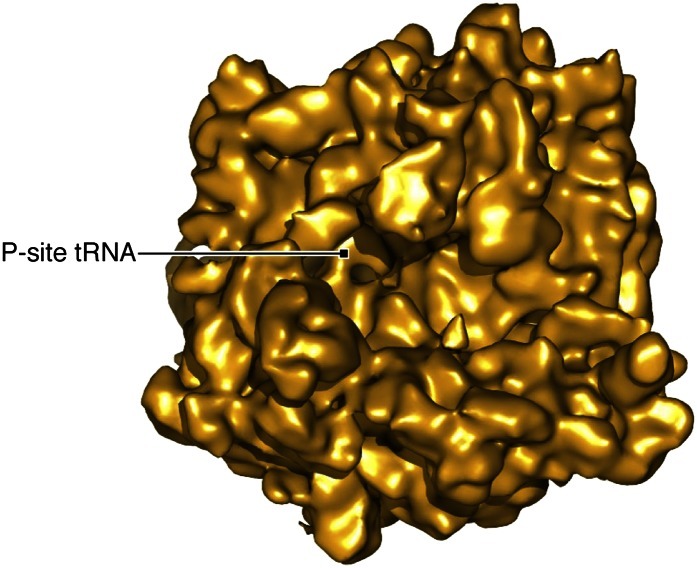
Figure 2—figure supplement 2. Density map resulting from refinement of the ‘RC’ class identified in our classification.

Figure 2—figure supplement 2.

The map shows the ribosome occupied with a P-site tRNA but no release factors.
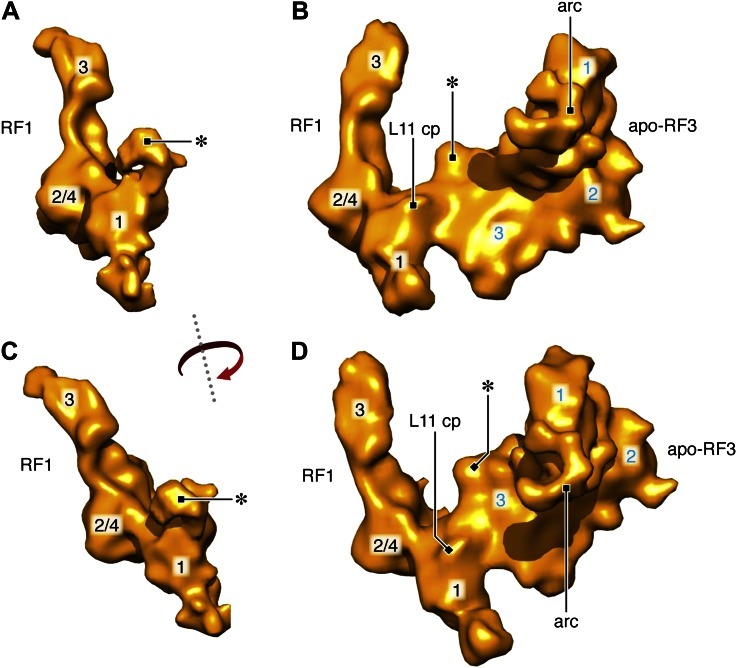
Figure 2—figure supplement 3. Segmented RF1 and RF1, apo-RF3 densities.

Figure 2—figure supplement 3.

(A), (C) Segmented RF1 density from RC-RF1, compared to the segmented, combined RF1, apo-RF3 density from RC-RF1•RF3 (B), (D). Density marked by asterisk in (A) and (C) is no longer present in (B) and (D); instead redistributed density is observed in RF1 domain 1 (asterisk in [B] and [D]) upon apo-RF3 binding. The arc of RF3 is labeled in all panels featuring RF3. L11 cp marks the point of contact between L11 and RF3 in the RC-RF1•RF3 map. RF3 domains labeled in blue; RF1 domains in black.
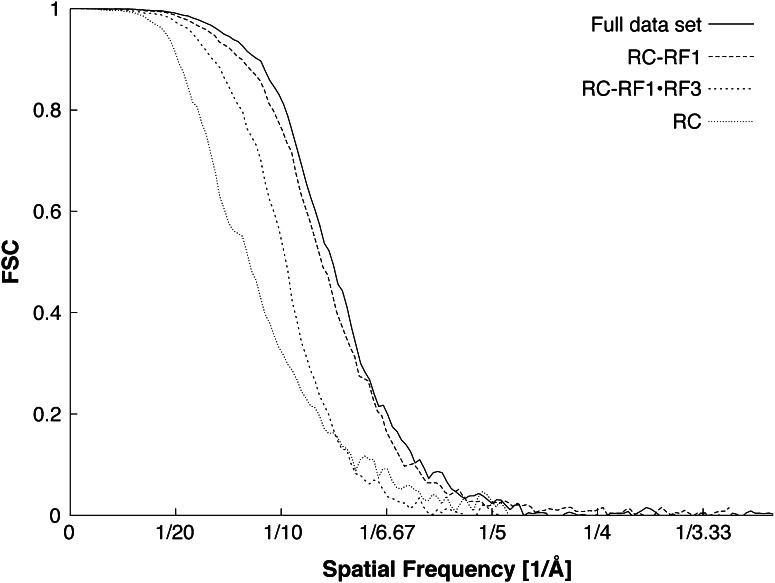
Figure 2—figure supplement 4. FSC curves for density maps obtained from total data, RC, RC-RF1 and RC-RF1•RF3.

Figure 2—figure supplement 4.

Resolutions, determined using the FSC = 0.5 cutoff criterion, are 8.0 Å (full data set), 8.4 Å (RC-RF1), 9.7 Å (RC-RF1•RF3) and 11.8 Å (RC).