Significance
Causes of intersubject variability in electrophysiological activity are unknown. We describe a methodology to unravel the ionic determinants of variability exhibited in experimental cardiac action potential recordings, based on the construction and calibration of populations of models. We show that 213 of 10,000 candidate models are consistent with the control experimental dataset. Ionic properties across the model population cover a wide range of values, and particular combinations of ionic properties determine shape, amplitude, and rate dependence of specific action potentials. Finally, we demonstrate that the calibrated model population quantitatively predicts effects caused by four concentrations of a potassium channel blocker.
Keywords: cardiac electrophysiology, computational biology, mathematical modeling, systems biology, drug
Abstract
Cellular and ionic causes of variability in the electrophysiological activity of hearts from individuals of the same species are unknown. However, improved understanding of this variability is key to enable prediction of the response of specific hearts to disease and therapies. Limitations of current mathematical modeling and experimental techniques hamper our ability to provide insight into variability. Here, we describe a methodology to unravel the ionic determinants of intersubject variability exhibited in experimental recordings, based on the construction and calibration of populations of models. We illustrate the methodology through its application to rabbit Purkinje preparations, because of their importance in arrhythmias and safety pharmacology assessment. We consider a set of equations describing the biophysical processes underlying rabbit Purkinje electrophysiology, and we construct a population of over 10,000 models by randomly assigning specific parameter values corresponding to ionic current conductances and kinetics. We calibrate the model population by closely comparing simulation output and experimental recordings at three pacing frequencies. We show that 213 of the 10,000 candidate models are fully consistent with the experimental dataset. Ionic properties in the 213 models cover a wide range of values, including differences up to ±100% in several conductances. Partial correlation analysis shows that particular combinations of ionic properties determine the precise shape, amplitude, and rate dependence of specific action potentials. Finally, we demonstrate that the population of models calibrated using data obtained under physiological conditions quantitatively predicts the action potential duration prolongation caused by exposure to four concentrations of the potassium channel blocker dofetilide.
Biological variability is exhibited at all levels in all organs of living organisms. It manifests itself as differences in physiological function between individuals of the same species and often more drastically by significant differences in the outcome of their exposure to pathological conditions. Thus, healthy cardiac cells of the same species and location exhibit a qualitatively similar response to a stimulus, i.e., the action potential (AP). However, significant quantitative intersubject differences exist in AP morphology and duration, which may explain the different individual response of each of the cells (and patients) to disease or drug action.
The variability underlying the physiological and pathological responses of different individuals has often been ignored in experimental and theoretical research, ultimately hampering the extrapolation of results to a population level. Experimentalists often average the results obtained in different preparations to reduce experimental error, therefore also averaging out the effects of intersubject variation and resulting in an important loss of information. This averaging of experimental data is inherited by theoretical research, and, consequently, models are often developed for a “typical” behavior within a particular population (1). Therefore, whereas all experimentally measured APs are different even within a homogeneous population, a single AP model is obtained from the data, again losing all information regarding intersubject variability.
In this paper, we tightly couple experimental measurements and mathematical modeling to construct and calibrate a population of cardiac electrophysiology cell models representative of physiological variability, which we then use to investigate the causes of experimentally measured variability in physiological conditions and following drug response. Our research builds on previous studies by us and others (2–4) showing the importance of mathematical methods such as model populations and sensitivity analysis in investigating the ionic determinants of intersubject variability in biological properties. Previous studies have described the construction of populations of cardiac cell models, building on the work by Marder et al. in neuroscience (5). Sarkar et al. (3) constructed populations of around 300 cardiac models by varying ionic properties in an arbitrary range, but no experimental calibration of the model population was conducted nor was the predictive capacity of the model population evaluated. Davies et al. (4) adjusted model parameters in the Hund and Rudy canine model (6) to obtain 19 different models, which were fit to specific AP recordings at 1 Hz. Given the reduced number of models and data (e.g., single frequency) considered in the study, it is unlikely that the models obtained are unique or provide coverage representative of the full experimental range.
Here, we describe the construction and calibration of a population of cell models that is able to represent the variability exhibited in specific experimental recordings under physiological conditions and to predict intersubject variability in response to potassium channel block. We base our investigations on rabbit Purkinje electrophysiology, because of the importance of Purkinje fibers in lethal arrhythmias (7) and in drug testing in preclinical safety pharmacology (8). We hypothesize that intersubject variability in experimentally measured APs is primarily caused by quantitative differences in the properties of ionic currents, rather than by qualitative differences in the biophysical processes underlying the currents. The equations proposed in our previous rabbit Purkinje AP Corrias–Giles–Rodriguez (CGR) model (9) are considered as the model structure to generate over 10,000 candidate models, all sharing the same equations (i.e., the same ionic biophysical processes) as in the original CGR model, but with different parameter values for the ionic properties, randomly selected within a wide range. The cell model population is then calibrated using a set of cellular biomarkers extracted from experimental AP recordings at three pacing frequencies to capture key rate-dependent AP properties. The calibrated model population is then used to identify the ionic mechanisms determining intersubject variability in each biomarker, yielding information about the relative importance of ionic currents in the generation of the AP at each pacing frequency. Finally, we demonstrate the capacity of the model population to predict variability in the response of rabbit Purkinje fibers to drug action (using an independent dataset) and to determine the underlying ionic mechanisms. We specifically show that the calibrated cell model population quantitatively predicts the prolongation of AP duration (APD) caused by exposure to four concentrations of dofetilide, a blocker of the rapid component of the delayed rectifier potassium current  . We chose
  block as the intervention to evaluate the predictive power of our population of models because
  block is the main assay required in safety pharmacology assessment, because of its importance in long QT-related arrhythmias (8). The flexibility of our methodology to construct and calibrate populations of models means it can be easily applied to other areas of biology.
Results
Construction and Calibration of the Model Population.
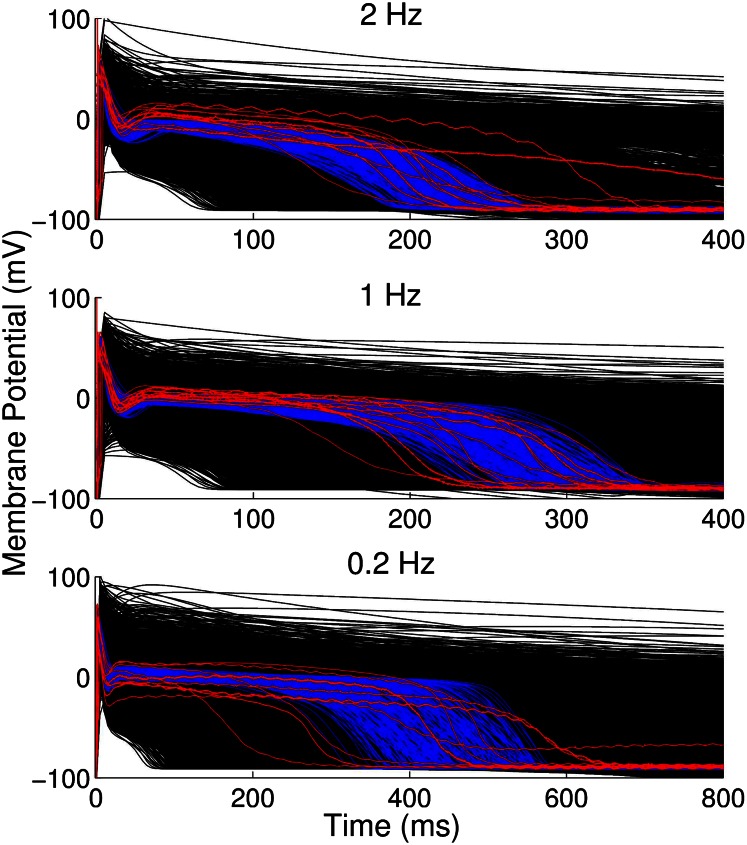
We generated a large initial population of 10,000 models with randomly varied parameter sets. This initial population was calibrated to retain only those models that were fully consistent with the experimentally observed ranges of six biomarkers at frequencies of 2, 1, and 0.2 Hz. The calibration process reduced the population to 213 accepted models. Fig. 1 shows the time course of different APs obtained experimentally (n = 12; red traces), all models considered in the initial sample (n = 10,000; black traces), and those accepted into the population because they were in range with experiments (n = 213; blue traces).
Fig. 1.
APs obtained from experimental recordings (red; n = 12), simulations using the models found to be within experimental range (blue; n = 213), and all models considered (black; n = 10,000) at 0.2-, 1-, and 2-Hz pacing frequencies. Plots extend to 400 ms for 2 and 1 Hz and to 800 ms for 0.2 Hz. Each experimental trace shows a representative AP from experiments on isolated female rabbit Purkinje fibers.
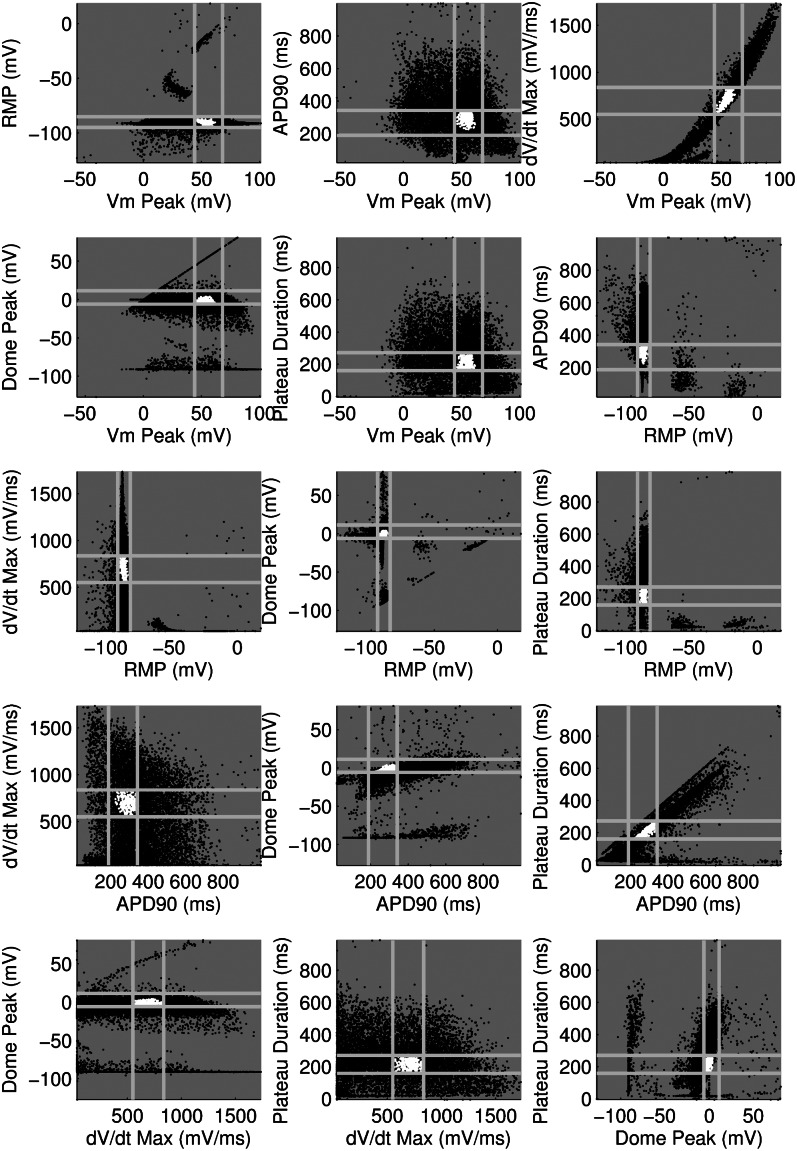
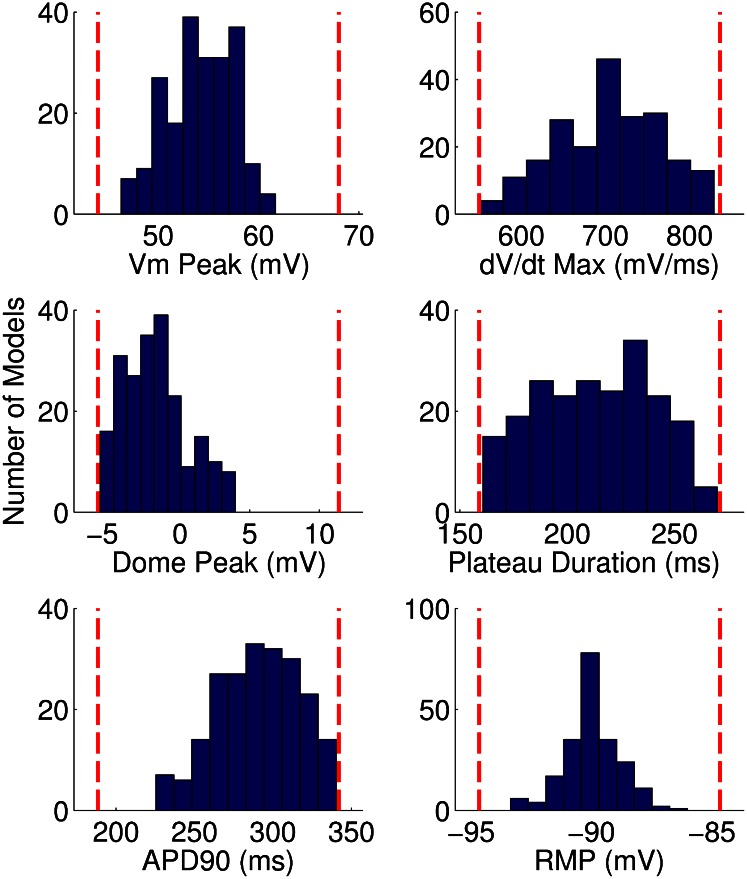
Fig. 2 further illustrates the calibration process and depicts the biomarker values obtained from each of the 10,000 models during simulated pacing at 1 Hz. We show values from models in the calibrated population as white dots, values from models rejected from the population as black dots, and the experimental ranges for each biomarker as gray lines. To visualize the distribution of models across the range of allowed biomarker values, we plot the histograms of the distribution of values of each biomarker at 1 Hz across the population, as shown in Fig. 3. We find that our calibrated population of models yields biomarker values covering the majority of the experimental range for each biomarker.
Fig. 2.
Scatter plots showing biomarker values for all models when stimulated at 1-Hz pacing frequency. Light gray lines indicate experimental minimum/maximum ranges for each biomarker. White dots correspond to biomarker values for models accepted into the population and, therefore, within experimental range; black dots correspond to rejected models outside of experimental range for at least one biomarker at one or more pacing frequencies. Each plot shows results for a pair of biomarkers.
Fig. 3.
Histograms of the distribution of biomarker values across the population of models for 1-Hz pacing. Dashed lines indicate the experimental range used to calibrate the population of models for each biomarker at this pacing frequency.
Ionic Properties Do Not Exhibit Specific Correlations Within the Model Population.
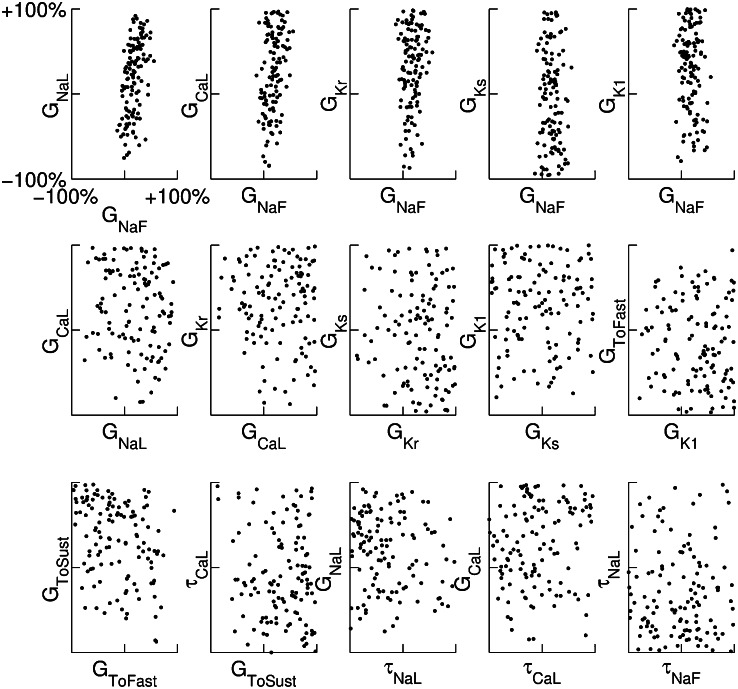
Because many ionic currents are known to act together in different phases of the AP, we investigated whether there were correlations between parameters values in the models finally accepted into the population. The parameter sets of the initial 10,000 models were randomly generated and uncorrelated, so any correlations we found would be attributable to the calibration process. Fig. 4 illustrates the distribution of parameter values for the 213 models accepted into the population. These results show that the majority of accepted parameter values span close to the entire range of sampled values (up to ±100% of their values from the original parameter set of the base model). This is with the exception of  (the conductance of the fast sodium current), the allowed values of which are within a narrow subset of the sampled range. This could be attributable to the fast sodium current’s role in determining both the velocity and peak value of the AP upstroke. We also find that the parameter values of models accepted in the calibrated population do not exhibit any obvious pair-wise correlations with other parameters. For most parameters (excluding
  ), the values of these parameters that were found in accepted models were spread across at least 83% of the total sampled range. For
  , the spread was 34% of the sampled range. We do find that for some parameters, the distribution of their values across the calibrated population of models is nonuniform. Specifically, parameter values for the parameters
  ,
,  ,
,  , and
, and  are more often in the top half of the sampled range, whereas for
  , parameter values are more often in the bottom half of the range. The remaining parameters appear to be distributed without bias across the whole of the covered range. Overall, we find that for almost any parameter value within our sampled range there is a parameter set that includes it and that will produce a valid model. With the exception of the fast sodium current’s role in initial depolarization, no current appears to have a unique and irreplaceable role in creating the AP.
Fig. 4.
Scatter plots illustrating the distribution of ionic properties for accepted models in the population. Each panel shows results for a pair of ionic properties (including  ,
,  ,
,  ,
,  ,
,  ,
,  ,
,  ,
,  ,
,  ,
,  , and
, and ). The scale in all graphs includes ±100% variation with respect to the original value. A representative sample of possible pairings is shown.
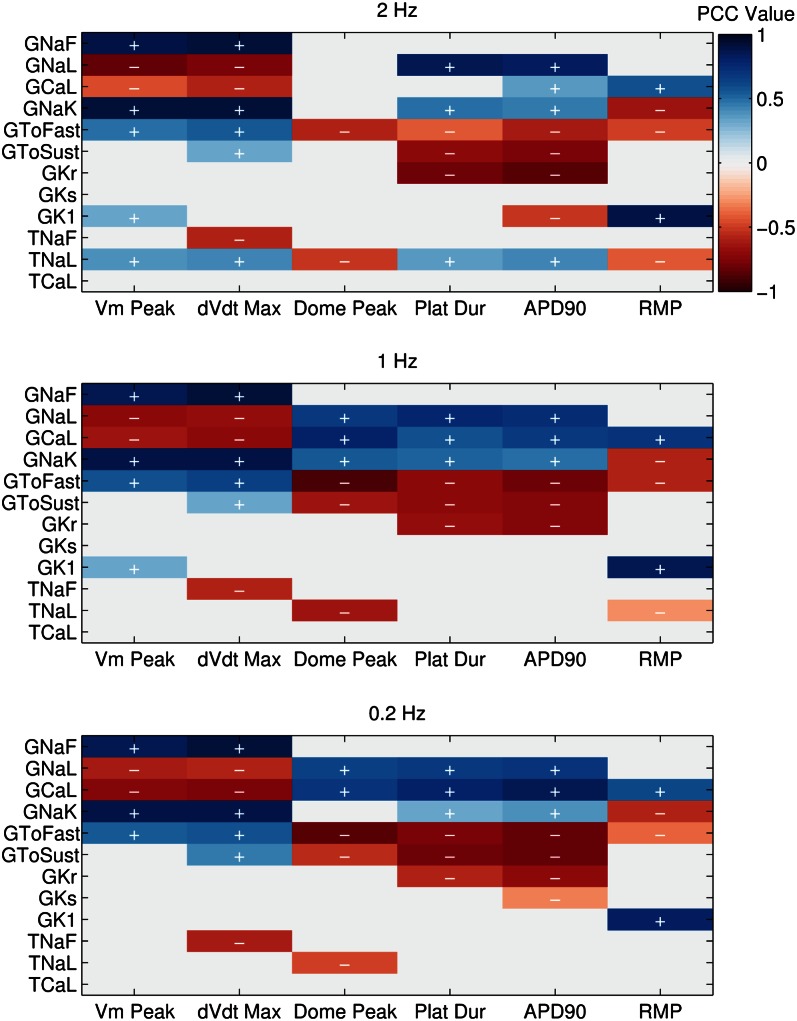
We wanted to identify significant correlations between parameter and biomarker values while controlling for the effects of the remaining parameters. Therefore, we used partial correlation, which identifies correlations between variables after taking into account the contributions of one or more additional variables (10) (see Materials and Methods for details). We took each of the parameters that were varied during the construction of the population of models and looked for correlations between each model parameter and any of the biomarkers used. The results of this analysis at each pacing frequency are shown in Fig. 5. For each biomarker, multiple parameters show significant partial correlation.  correlates strongly and positively with peak membrane potential (Vm Peak) and peak upstroke velocity (dV/dt Max), biomarkers that quantify the initial upstroke of the AP.
  has strong negative correlations with plateau duration and
  , both measures of APD.
  correlates primarily with resting membrane potential (RMP). The conductances for important plateau phase currents,
  ,
,  ,
,  , and
, and  , all have significant correlations with most of the measured biomarkers at all pacing frequencies. This is consistent with our findings that a broad range of parameter values can produce models that are consistent with our data, because multiple parameters influence each measured biomarker. Individual parameter values are still important for determining the exact balance of currents and, therefore, the specific AP properties of each model.
Fig. 5.
Correlation plots showing significant PCCs between each parameter that was varied in the population and each biomarker. Coefficient values are represented using the included color bar. For each parameter–biomarker pair, the effects on the biomarker attributable to the unselected parameters are removed as part of the partial correlation method. PCCs are shown for each frequency used in our simulations (2, 1, and 0.2 Hz). Parameter–biomarker pairs with higher coefficient values displayed stronger partial correlation with each other, whereas pairs with a coefficient of 0 did not show statistically significant partial correlation (P < 10−5).  and
and  , positive and negative correlation, respectively.
Model Population Quantitatively Predicts Concentration-Dependent APD Prolongation Caused by Four Concentrations of Dofetilide.
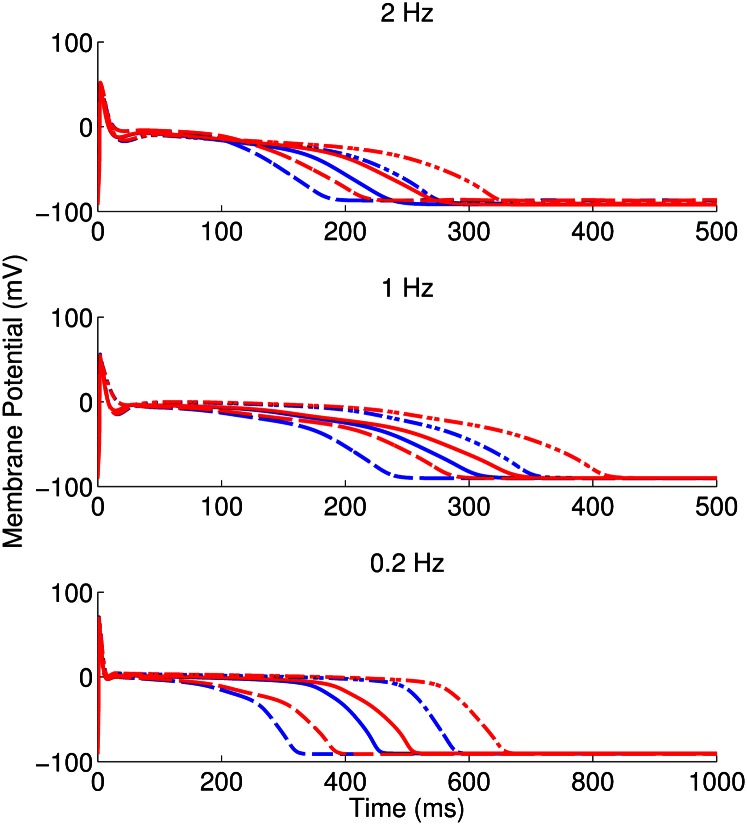
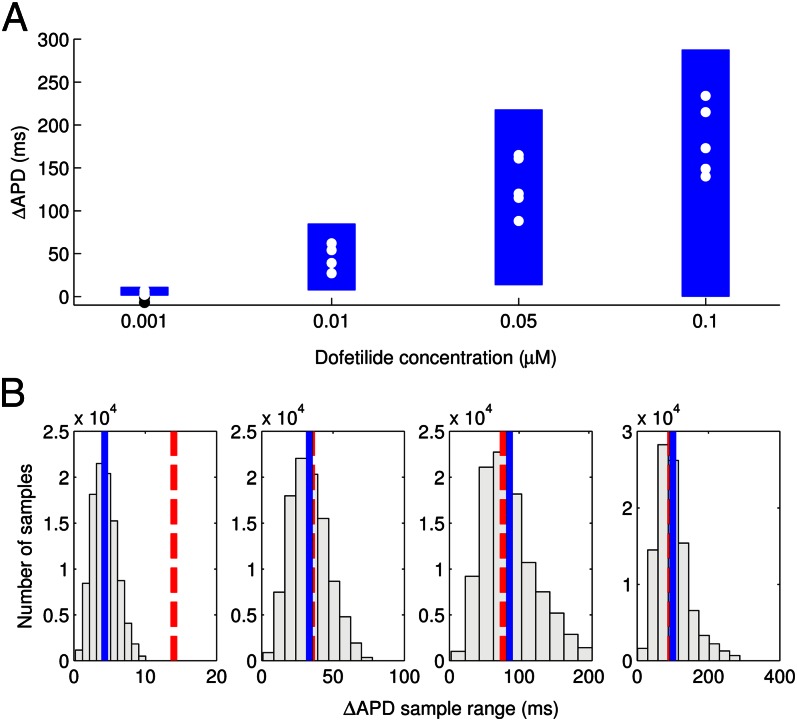
Following the calibration and analysis of the model population, we evaluated whether the rabbit Purkinje model population could be used to predict electrophysiological response to drug block and to investigate the underlying mechanisms that determine this response for individual preparations. The predictive capacity of the calibrated model population was evaluated using an independent dataset not used for model calibration. Simulations and experiments were independently conducted for dofetilide at concentrations of 0.001, 0.01, 0.05, and 0.1 μM, using identical protocols as described in Materials and Methods. Fig. 6 shows example APs simulated for control (blue traces) and following block of IKr caused by application of a 0.01 μM concentration of dofetilide (red traces).  block caused by dofetilide induces both APD prolongation and increased APD variability, in agreement with previous studies (11). Fig. 7A shows ranges of simulated ΔAPD values (ΔAPD =
  with
with  inhibition −
  under control conditions, where APD90 is APD at 90% repolarization) obtained using the models in the calibrated population, with experimental values from five preparations shown as dots. The sixth dofetilide preparation in our dataset is excluded from comparison. This is because this experiment displayed much higher APD values at all concentrations (
 of 1,851 ms at 1-Hz pacing at maximum concentration; the other five experiments were 414
  75 ms at the same concentration). The predicted range of ΔAPD caused by dofetilide fully covers the range of the experimental data for each of the four concentrations.
Fig. 6.
Simulated AP traces obtained for three representative models accepted in the population in control conditions (blue) and following application of 0.01 μM concentration of dofetilide (red) at 2-, 1-, and 0.2-Hz pacing frequencies. This is the concentration closest to the experimentally determined IC50 (therapeutic dose) for dofetilide (0.0124 μM). Plots extend to 500 ms for 2 and 1 Hz and 1,000 ms for 0.2 Hz. Line style indicates which of the control and dofetilide traces correspond to each model.
Fig. 7.
(A) Ranges of  prolongation (ΔAPD) caused by four concentrations of dofetilide using the models in the calibrated population. Dots indicate values of ΔAPD independently obtained in five experiments using rabbit Purkinje fiber preparations. (B) Histograms of dofetilide-induced ΔAPD range across sets of 5 models randomly sampled from the calibrated population. A total of 100,000 different sets of five models were used. The range of ΔAPD was calculated as maximum value of ΔAPD − minimum value of ΔAPD, for each set of five models. For each dofetilide concentration, the mean value of the ΔAPD range across the 100,000 samples of five models is shown by a solid blue line, and the ΔAPD range from our experimental data is shown by the dashed red line.
However, for the two higher concentrations, the lower end of the predicted range of ΔAPD is significantly less than the smallest values of ΔAPD seen in the data. This could be because the larger number of models relative to experiments gives the models fuller coverage of the range of possible prolongation values than the experiments. To further investigate this point, we compared the variability in ΔAPD values by analyzing the ranges of ΔAPD seen in subpopulations of five models sampled from the total population of models, thereby matching the number of models to the number of experiments in our dataset. To perform this comparison, 100,000 random samples of five models were made and the range of ΔAPD values for each concentration of dofetilide in each subpopulation was computed. Fig. 7B shows the distribution and mean value of these ΔAPD ranges from the models compared with the ΔAPD range seen in the experimental data. These results show that the mean range of ΔAPD values seen in the subpopulation samples agrees well with experimental recordings at the three higher drug concentrations. At the lowest concentration, simulations slightly deviate from experiments, but this is mostly attributable to the lack of effect of the drug at this low concentration. This means that some experiments have negative ΔAPD values attributable to other sources of variability. Overall, these results suggest that the large number of models in the population, relative to the number of experiments, could explain the difference between predicted and experimental ΔAPD ranges. Repeating the sampling process several times with different sets of 100,000 random five model samples results in similar mean values and histograms, indicating our results are independent of the particular samples chosen.
Baseline IKr Conductance Is the Main Determinant of APD Prolongation Caused by Dofetilide.
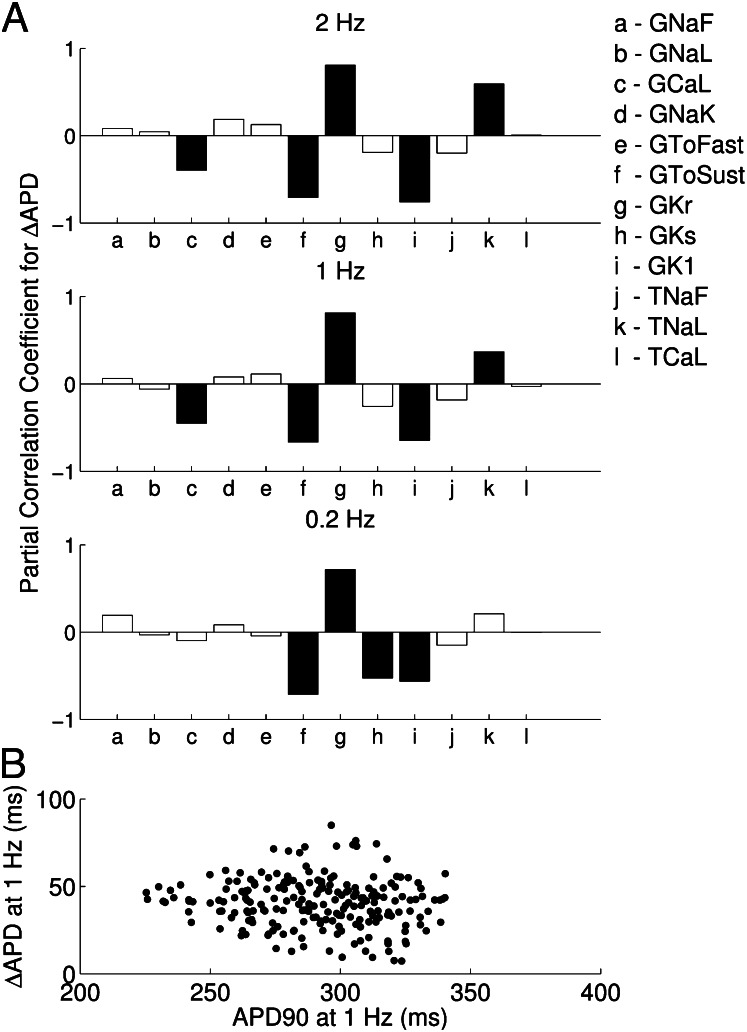
We wanted to understand how differences in the underlying ionic properties of rabbit Purkinje cells from different individual rabbits could affect their AP response to  block. To investigate this, we used partial correlation coefficients (PCCs) to quantify correlations between the parameter values and ΔAPD values of each model in the population, as shown in Fig. 8A. We found that at all pacing frequencies there was a strong positive correlation between
  and ΔAPD. This
  /ΔAPD correlation obtained with our experimentally calibrated model population is consistent with results shown in the study by Sarkar and Sobie (12). Rabbit Purkinje cells with a larger
  are more dependent on the
  current for repolarization and so will have a greater increase in
  following
  block than cells with a smaller
  . Other parameters with a significant level of correlation with ΔAPD caused by dofetilide include the sustained transient outward potassium conductance
  and the inward rectifier potassium conductance
  . The L-type calcium conductance
  and late sodium time constant
  are correlated with ΔAPD at the two higher pacing frequencies (2 and 1 Hz), whereas
  shows significant correlation at 0.2 Hz only. We find that
  is positively correlated with
  but negatively correlated with ΔAPD, whereas
  is negatively correlated with
  but positively correlated with ΔAPD, which is consistent with the study by Sarkar and Sobie (12). There is also no observed correlation between control values of
  and the amount of APD prolongation following block, as demonstrated in Fig. 8B, in agreement with previous clinical and computational studies (12, 13).
Fig. 8.
(A) PCCs for APD prolongation (ΔAPD) caused by  block from a 0.01 μM dofetilide concentration, at each of the three pacing frequencies. ΔAPD was correlated against each of the 12 parameters that were varied to create the population of models, each time controlling for the other 11 parameters as part of the partial correlation process. Three models with outlying values of ΔAPD at 0.2 Hz (ΔAPD = 318, 364, and 395 ms, compared with the rest of the model population’s sample mean of 69 ms ± 26 ms) were excluded from the analysis as they dominate the other models when calculating the PCCs at that frequency. Solid bars denote significant correlations with P < 10−5, and empty bars indicate correlations with P > 10−5. (B) Scatter plot of control
  values of each accepted model at 1 Hz against ΔAPD attributable to
  block from 0.01 μM concentration of dofetilide.
Discussion
In this study, we have built a population of cardiac cell models that reproduces and predicts the variability exhibited in AP measurements from rabbit Purkinje fibers under physiological conditions and following potassium channel block. We calibrated a large number of models derived from randomly generated parameter sets against the range of variability observed in experimental AP recordings and discarded those models with AP behavior outside of the experimental range. This produced a population of models with a wide range of underlying ionic current properties that all produced realistic electrophysiological output in simulated physiological conditions. We analyzed the variation in underlying parameters and established links between variation in the underlying ionic currents and variation in properties of the AP. We have demonstrated that our model population quantitatively predicts the range of variability in APD prolongation measured experimentally following block of IKr by four concentrations of dofetilide.
Previous modeling studies of variability in cardiac cellular electrophysiology have focused on variability in a single current (2), sensitivity analyses that finely sample the local parameter space close to the original parameter set of the model (3), and replicating AP traces from individual cells (4). In contrast, we have developed an efficient methodology that can be used to simulate the range of AP variability seen in a dataset, while varying the underlying parameter sets across a wide range of values, comparatively far from the model’s original parameter set. In neuroscience, modeling studies have been carried out that use a similar methodology as ours to capture the full variability of a dataset in a population of models (5, 14–16). However, to our knowledge, these populations have not been used to predict the behavior of an independent dataset and link that behavior to underlying ionic mechanisms. Grashow et al. have performed experimental studies of the effects of variability on two-cell neuronal circuits to investigate how variability affects the way these circuits behave (17, 18). By controlling the values of two conductances, the authors show that similar circuit behavior can be produced in circuits with different intrinsic membrane properties. They found that the responses of two-cell circuits to two neuromodulatory drugs were generally reliable across a wide range of controllable parameter values, despite variability in the underlying circuits. However, for some circuits, certain parameter sets within their sampled parameter space behaved qualitatively differently to the majority. This is similar to our findings that a wide range of parameter combinations can produce very similar types of behavior.
Our methodology aims to incorporate the variability between individuals of the same species into traditional models of biological systems, such as the electrophysiological activity of a cardiac cell. We do not look at properties of isolated models in the population or attempt to classify single models as models of particular individuals. Instead, we look at the behavior of the whole population, particularly how variation in underlying parameters is related to variation in biomarkers, in this case the AP. All of the models in our population have been tested and shown to be within the observed range of AP variability. However, different combinations of ionic parameters produce different behaviors within that range and also determine the response to nonphysiological conditions such as drug-induced block of ionic currents. The ability of the population of models to link underlying mechanisms with variation in both physiological and pathological conditions is a powerful feature of the methodology that we hope can be further exploited in future studies.
We have found that a wide range of different combinations of ionic parameter values can produce model behaviors that are within the bounds of experimental variability. One question that arises from this result is whether the size of this range is attributable to the relatively limited set of conditions that we use to calibrate the population of models, compared with the number of possible conditions that a real cardiac cell could experience. Other studies (4, 19–21) suggest that in cases where a specific set of model outputs are required, the allowed parameter range for producing them can be highly constrained, as long as enough nonredundant outputs are considered. Examples of these outputs could be the mean values of different electrophysiological properties or of the same property under a range of experimental conditions, such as different pacing frequencies, with each value derived from averaging over many experiments. Our work, along with that of Marder et al. (e.g., ref. 15), suggests that in situations where a model must reproduce a class of behavior (such as a realistic rabbit Purkinje AP in control conditions at 1-Hz pacing) with flexibility on the exact values of the measured outputs, a wide range of parameter sets can produce behavior within the required range. This is consistent with the idea that underlying conductances can vary considerably and still produce a viable AP but that the exact values of those conductances determine the exact properties of the AP.
However, although the wide range of allowed parameter values could be a characteristic of the biological system [as in the work of Grashow et al. (17, 18)], part of this effect could be attributable to other factors. To better represent physiological variation in ionic properties, the population may require additional constraints, such as using a wider variety of experimental conditions for the calibration process (e.g., including drug-block experiments), and additional biomarkers that probe other important electrophysiological properties beyond the steady-state AP, such as intracellular calcium behavior or repolarization dynamics (21).
A further important benefit of modeling the effects of variability is that we are able to make quantitative predictions of the effect of an intervention such as drug application, based on the range of responses that we observe across the population of models. Our study of dofetilide-induced APD prolongation is an example of this, which can be extended to other pharmacological interventions or disease conditions. We found that the range of APD prolongation across the population of models is consistent with experimental data at multiple drug concentrations that were not used to calibrate the population of models. Traditional cell models using a single parameter set can only make qualitative predictions in such cases (e.g., predicting that APD prolongation would increase as drug concentration increased). Using a population of models allows quantitative prediction of the range of responses to an intervention to be made, and these predictions can be tested experimentally as shown here.
Another potential application for the population of models approach is to generate typical models to summarize the behavior of an experimental dataset. In this study, all models in the population of models are viewed as equal. However, for some applications, it may be useful to determine which models in the population best represent typical or averaged experimental behavior. This could be achieved by classifying or ranking the models to determine which produce behavior close to mean experimental behavior and which better represent the behavior of outlier experiments. Determining which model(s) in the population would be best used for these purposes is another possible way the population of models methodology could be exploited in the future.
The results in this study are based on a dataset from a relatively small number of individuals, as is often the case in cardiac electrophysiology, and a single drug-block experiment. This small sample size and lack of multiple noncontrol condition experiments limits our ability to draw statistical conclusions from our work and to test the predictive power of our population of models in multiple scenarios. Further studies should focus on applying the methodology to ensure the predictive capacity of the population of models for a range of drug-block and disease conditions (22). The flexibility of the approach that we propose ensures its application in other areas of biology to improve our understanding of variability in biological systems.
Materials and Methods
Experimental Dataset.
Our dataset consisted of microelectrode recordings of isolated Purkinje fiber preparations obtained as described previously [Lu et al. (23)], from 12 different Purkinje fibers paced at three pacing frequencies (2, 1, and 0.2 Hz). In the experiments, preparations were paced at 1 Hz for 60 min to stabilize them and then paced at 1 Hz over four intervals of 15 min each. At the beginning of all intervals except the first (control) interval, increasing concentrations of either an active testing compound (dofetilide, at concentrations of 0.001, 0.01, 0.05, and 0.1 μM; n = 6 Purkinje fibers) or vehicle (H2O) were added. Following these intervals, the preparations were paced for 5 min at 0.2 Hz, followed by pacing for 5 min at 2 Hz, while still perfused at the last concentration. All biomarker values used for the calibration process were determined from vehicle studies (only H2O applied to preparation during pacing).
Rabbit Purkinje Cell Model.
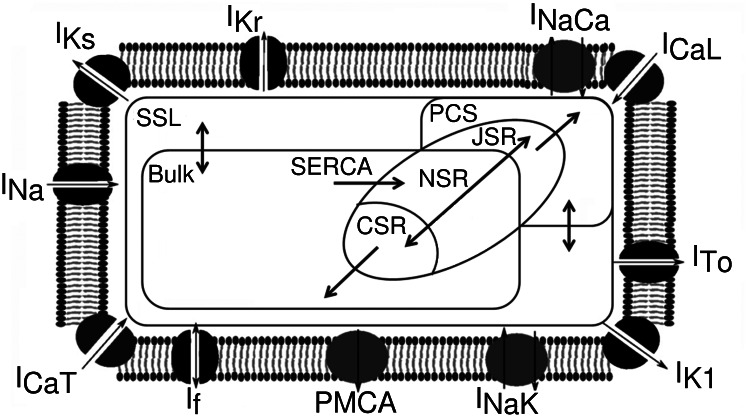
The model used in this study is a modified version of the CGR model (9), adapted to use the more detailed intracellular calcium-handling system from the Pan-Rudy Dynamic (PRd) cell model (24). Fig. 9 shows a schematic of the model. The modified CGR model contains the following major currents:  and
and  , the fast and late components of the sodium current;
  and
and  , the L-type and T-type calcium currents;
  , the inward rectifier potassium current;
  and
and  , the fast and sustained components of the transient outward potassium current;
  and
and  , the rapid and slow components of the delayed rectifier potassium current;
  , the funny current;
  , the sodium-calcium exchange current; and
  , the sodium-potassium pump current. An additional current, the stimulus current
  is included and represents external electrical stimulus of the cell to trigger excitation. This current can be applied at different rates to simulate different rates of pacing and investigate rate-dependent behavior. Different pacing rates elicit different behaviors from the model because of the dynamics of the time- and voltage-dependent activation and inactivation gates that are modeled for appropriate ionic currents. The modified intracellular calcium subsystem tracks intracellular calcium concentrations in six separate compartments: the bulk cytoplasm, which represents the interior of the cell and the majority of its volume; the subsarcolemma (SSL), which represents the majority of the peripheral volume of the cell where the majority of noncalcium channels are located; the peripheral coupling subspace (PCS), which represents the remainder of the cell periphery where the majority of calcium carrying channels are located and where calcium emission from the sarcoplasmic reticulum (SR) occurs; and the junctional (JSR), network (NSR), and corbular (CSR) compartments of the SR, where calcium is stored. The network SR is where calcium is taken up into the SR by the sarco/endoplasmic reticulum Ca2+-ATPase, the junctional SR can release calcium into the cell periphery and the corbular SR can release calcium into the bulk volume of the cell.
Fig. 9.
Schematic for the rabbit Purkinje cell model used in our study. Ionic currents included in the model and the calcium handling subsystem are shown. Arrows within the cell represent calcium transport between compartments. PMCA, plasma membrane Ca2+-ATPase; SERCA, sarco/endoplasmic reticulum Ca2+-ATPase.
We adopted the calcium subsystem and  formulations used in the PRd model (all other ionic membrane currents used the CGR model formulation). The equations for the relevant processes incorporated into our model are given in the data supplement of ref. 24. Specifically, the equations from the sections on the sodium–calcium exchanger and SR
  fluxes, as well as the equations describing the ionic concentrations for [Ca2+]PCS, [Ca2+]SSL, [Ca2+]i, [Ca2+]JSR, [Ca2+]NSR, and [Ca2+]CSR, and the calcium/calmodulin-dependent protein kinase from the PRd model were used. Additionally, we used the PRd model’s parameter values for the fractions of the cell volume taken up by each compartment, although the total volume of the cell was taken to be the published value in the CGR model. Two other changes were made to the CGR model to make its baseline results better match experimental data. First, the extracellular potassium concentration [K+]o was altered from 5.4 to 4.0 mM to reflect experimental conditions. Second, the formulation of the inactivation gate time constant for the fast sodium current was changed from a constant 2.0 ms to the voltage-sensitive equation:
 |
to obtain a peak voltage within experimental range. C++ code for the model is available for download at https://chaste.cs.ox.ac.uk/trac/wiki/PaperTutorials/PNAS_PopulationOfModels.
Construction of the Population of Rabbit Purkinje Models.
To begin constructing the population of models we generated 10,000 parameter sets using Latin hypercube sampling (LHS) (25) as described below. Each parameter set initially contained 11 parameters: eight channel conductances for the currents fast sodium, late sodium, L-type calcium, rapid delayed rectifier potassium, slow delayed rectifier potassium, inward rectifier potassium, and the fast and sustained components of the transient outward potassium current; and three channel time constants for fast sodium, late sodium, and L-type calcium. These parameters were chosen because they have the strongest influence on biomarker values, based on a sensitivity analysis conducted on the CGR model, in line with results shown by Corrias et al. (9). The parameter sets generated by LHS were used to replace the 11 relevant parameter values in the base model to create 10,000 different versions of the model with the same equations but varied parameter values. Because of its importance in AP-rate dependence, we varied the sodium–potassium pump conductance at five values from 1/10th to twice its initial value.
Sampling Method.
Building populations of models requires the generation of a large numbers of parameter sets for the initial population, sampled from a high-dimensional parameter space. Sampling every possible combination of parameter values in the space, for all but the lowest resolutions, is computationally infeasible given the complexity of most cardiac cell models. Therefore, we use the Latin hypercube sampling method (25), which generates parameter sets over a large number of parameters efficiently and without bias. To use the LHS method, we specify an upper and lower bound on the range of values to sample each parameter from and subdivide that range into N intervals. N parameter sets are then chosen randomly but with the constraint that each parameter set can only contain parameter values from intervals that have not been used in any other parameter set. The number of samples taken (N) is specified by the user and so does not scale with the number of parameters sampled. Therefore, a large number of parameters can be varied in total, allowing a more complex parameter space to be explored. Parameters that are varied are sampled over a range from just above 0 to twice the published value of that parameter in the original CGR model. The published values of parameters in the CGR model represent mean values taken from the literature. These values typically have a reported SE on the mean of much less than the actual mean value, and this has been incorporated into previous studies of variability (2, 3). However, this error represents uncertainty in the mean value, not the total range of variation observed in experiments. Therefore, we vary parameters over a larger range than has been used previously, and this range is large enough to represent observed variability.
Biomarkers.
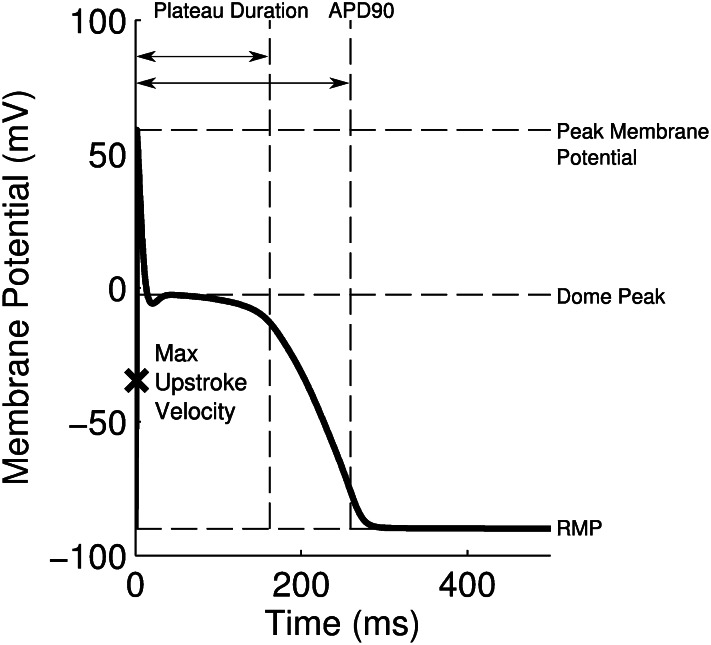
We used six biomarkers to quantify the major features of the rabbit Purkinje AP. Four of these were biomarkers commonly used in cardiac electrophysiology: dV/dt Max, Vm Peak, APD , and RMP. Because of the characteristic spike and dome configuration of the rabbit Purkinje AP, we introduced two additional biomarkers: dome peak, which measures the Vm Peak of the dome of the AP; and plateau duration, which measures the duration of the AP up to the end of the plateau phase. The plateau duration biomarker is calculated from where the voltage/time gradient during the repolarization phase falls below a threshold value. We used −350 mV/s because we found this gave us a good estimation of the duration of the AP up to and including the plateau phase but excluding the majority of repolarization. We used this biomarker as traditional methods of measuring this period (e.g., APD
 or APD
 ) can be affected by the dome part of the AP and underestimate the true duration. Fig. 10 illustrates the calculation of each biomarker using an example AP, from one of the models in the calibrated population.
Fig. 10.
Representation of each biomarker measured in this study, calculated from a simulation at 1 Hz using a model from the population of models. The maximum upstroke velocity was calculated as the maximum value of the gradient of the membrane potential against time recorded before the point where the Vm Peak occurs.
Model Calibration Process.
Our model-calibration process determines whether a model should be added to the population or not based on comparison with experimental data. The choice of comparison method for this process is constrained by the availability of experimental data. Marder et al. used a confidence interval of twice the SD around mean values to determine the bounds on allowed output variability (15). However, the limited number of preparations typically used in cardiac electrophysiology and safety pharmacology assays prevents an appropriate characterization of biomarker variability in this statistical sense. We, therefore, chose to use the upper and lower values of each biomarker as observed in our experimental data to guarantee our estimates of variability were within biological range for each of the three pacing frequencies. At each frequency and for each preparation, biomarker values were calculated by taking their median from a continuous train of at least 100 APs at steady-state conditions. For each biomarker, at each frequency, the maximum and minimum values of that biomarker found across all preparations were used to set the range of acceptable biomarker values for model calibration.
Simulation Protocols.
Simulations were carried out using CVODE, an adaptive time step ordinary differential equation (ODE) solver, implemented within CHASTE (26), an open source software framework for modeling in computational biology. Each model was initially left in quiescent state for 1,000 s to allow relaxation from initial conditions (because these were the same for every model), and then paced for 1,000 s at 2, 1, or 0.2 Hz at 2 diastolic threshold, to mimic experimental protocols. The final AP was recorded at a time resolution of 0.01 ms and was used to calculate biomarker values for that model at that frequency. We modeled the action of dofetilide as a single-pore
  inhibitor (27) with a Hill coefficient of 1 and an IC50 of 0.0124 μM, as obtained experimentally from dose–response curves.
Statistical Methods.
To determine correlations between the properties of individual ionic currents and properties of the whole AP, we used partial correlation. We chose to use partial correlation over other correlation measures because partial correlation controls for the effects of one or more additional variables when looking for correlations between two quantities, which is important given that our models are generated by varying multiple parameters simultaneously. Partial correlation is a method to find correlations between two variables, after accounting for the linear effects of one or more additional variables (10). The PCC between variables x and y, given the set of N additional variables  , is found by first calculating linear regression models of x and y against
  :
:
 |
The PCC between x and y is then defined as the correlation coefficient between the residuals  and
and :
:
 |
Acknowledgments
This study was supported by a Medical Research Council Industry Partnership award and Research Grant from Janssen Pharmaceutica NV. O.J.B. is supported by an Engineering and Physical Sciences Research Council-funded Systems Biology Doctoral Training Centre studentship, B.R. holds a Medical Research Council Career Development Award, and the contribution to this work by A.B.-O. was supported by Award KUK-C1-013-04 from the King Abdullah University of Science and Technology.
Footnotes
The authors declare no conflict of interest.
This article is a PNAS Direct Submission.
References
- 1.Carusi A, Burrage K, Rodríguez B. Bridging experiments, models and simulations: An integrative approach to validation in computational cardiac electrophysiology. Am J Physiol Heart Circ Physiol. 2012;303(2):H144–H155. doi: 10.1152/ajpheart.01151.2011. [DOI] [PubMed] [Google Scholar]
- 2.Romero L, Pueyo E, Fink M, Rodríguez B. Impact of ionic current variability on human ventricular cellular electrophysiology. Am J Physiol Heart Circ Physiol. 2009;297(4):H1436–H1445. doi: 10.1152/ajpheart.00263.2009. [DOI] [PubMed] [Google Scholar]
- 3.Sarkar AX, Christini DJ, Sobie EA. Exploiting mathematical models to illuminate electrophysiological variability between individuals. J Physiol. 2012;590(Pt 11):2555–2567. doi: 10.1113/jphysiol.2011.223313. [DOI] [PMC free article] [PubMed] [Google Scholar]
- 4.Davies MR, et al. An in silico canine cardiac midmyocardial action potential duration model as a tool for early drug safety assessment. Am J Physiol Heart Circ Physiol. 2012;302(7):H1466–H1480. doi: 10.1152/ajpheart.00808.2011. [DOI] [PubMed] [Google Scholar]
- 5.Marder E, Taylor AL. Multiple models to capture the variability in biological neurons and networks. Nat Neurosci. 2011;14(2):133–138. doi: 10.1038/nn.2735. [DOI] [PMC free article] [PubMed] [Google Scholar]
- 6.Hund TJ, Rudy Y. Rate dependence and regulation of action potential and calcium transient in a canine cardiac ventricular cell model. Circulation. 2004;110(20):3168–3174. doi: 10.1161/01.CIR.0000147231.69595.D3. [DOI] [PMC free article] [PubMed] [Google Scholar]
- 7.Maruyama M, et al. Diastolic intracellular calcium-membrane voltage coupling gain and postshock arrhythmias: Role of purkinje fibers and triggered activity. Circ Res. 2010;106(2):399–408. doi: 10.1161/CIRCRESAHA.109.211292. [DOI] [PMC free article] [PubMed] [Google Scholar]
- 8.The European Medicines Agency Safety Pharmacology Studies for Human Pharmaceuticals 2005. ICH Topic S 7 A: Safety Pharmacology Studies for Human Pharmaceuticals (European Medicines Agency, London). Available at www.ema.europa.eu/docs/en_GB/document_library/Scientific_guideline/2009/09/WC500002831.pdf.
- 9.Corrias A, Giles W, Rodriguez B. Ionic mechanisms of electrophysiological properties and repolarization abnormalities in rabbit Purkinje fibers. Am J Physiol Heart Circ Physiol. 2011;300(5):H1806–H1813. doi: 10.1152/ajpheart.01170.2010. [DOI] [PubMed] [Google Scholar]
- 10.Marino S, Hogue IB, Ray CJ, Kirschner DE. A methodology for performing global uncertainty and sensitivity analysis in systems biology. J Theor Biol. 2008;254(1):178–196. doi: 10.1016/j.jtbi.2008.04.011. [DOI] [PMC free article] [PubMed] [Google Scholar]
- 11.Pueyo E, et al. A multiscale investigation of repolarization variability and its role in cardiac arrhythmogenesis. Biophys J. 2011;101(12):2892–2902. doi: 10.1016/j.bpj.2011.09.060. [DOI] [PMC free article] [PubMed] [Google Scholar]
- 12.Sarkar AX, Sobie EA. Quantification of repolarization reserve to understand interpatient variability in the response to proarrhythmic drugs: A computational analysis. Heart Rhythm. 2011;8(11):1749–1755. doi: 10.1016/j.hrthm.2011.05.023. [DOI] [PMC free article] [PubMed] [Google Scholar]
- 13.Kannankeril PJ, Norris KJ, Carter S, Roden DM. Factors affecting the degree of QT prolongation with drug challenge in a large cohort of normal volunteers. Heart Rhythm. 2011;8(10):1530–1534. doi: 10.1016/j.hrthm.2011.03.042. [DOI] [PMC free article] [PubMed] [Google Scholar]
- 14.Prinz AA, Billimoria CP, Marder E. Alternative to hand-tuning conductance-based models: Construction and analysis of databases of model neurons. J Neurophysiol. 2003;90(6):3998–4015. doi: 10.1152/jn.00641.2003. [DOI] [PubMed] [Google Scholar]
- 15.Prinz AA, Bucher D, Marder E. Similar network activity from disparate circuit parameters. Nat Neurosci. 2004;7(12):1345–1352. doi: 10.1038/nn1352. [DOI] [PubMed] [Google Scholar]
- 16.Taylor AL, Goaillard JM, Marder E. How multiple conductances determine electrophysiological properties in a multicompartment model. J Neurosci. 2009;29(17):5573–5586. doi: 10.1523/JNEUROSCI.4438-08.2009. [DOI] [PMC free article] [PubMed] [Google Scholar]
- 17.Grashow R, Brookings T, Marder E. Reliable neuromodulation from circuits with variable underlying structure. Proc Natl Acad Sci USA. 2009;106(28):11742–11746. doi: 10.1073/pnas.0905614106. [DOI] [PMC free article] [PubMed] [Google Scholar]
- 18.Grashow R, Brookings T, Marder E. Compensation for variable intrinsic neuronal excitability by circuit-synaptic interactions. J Neurosci. 2010;30(27):9145–9156. doi: 10.1523/JNEUROSCI.0980-10.2010. [DOI] [PMC free article] [PubMed] [Google Scholar]
- 19.Syed Z, Vigmond E, Nattel S, Leon LJ. Atrial cell action potential parameter fitting using genetic algorithms. Med Biol Eng Comput. 2005;43(5):561–571. doi: 10.1007/BF02351029. [DOI] [PubMed] [Google Scholar]
- 20.Sarkar AX, Sobie EA. Regression analysis for constraining free parameters in electrophysiological models of cardiac cells. PLOS Comput Biol. 2010;6(9):e1000914. doi: 10.1371/journal.pcbi.1000914. [DOI] [PMC free article] [PubMed] [Google Scholar]
- 21.Zaniboni M. 3D current-voltage-time surfaces unveil critical repolarization differences underlying similar cardiac action potentials: A model study. Math Biosci. 2011;233(2):98–110. doi: 10.1016/j.mbs.2011.06.008. [DOI] [PubMed] [Google Scholar]
- 22.Walmsley J, et al. mRNA expression levels in failing human hearts predict cellular electrophysiological remodeling: A population-based simulation study. PLoS ONE. 2013;8(2):e56359. doi: 10.1371/journal.pone.0056359. [DOI] [PMC free article] [PubMed] [Google Scholar]
- 23.Lu HR, Vlaminckx E, Van De Water A, Gallacher DJ. Both beta-adrenergic receptor stimulation and cardiac tissue type have important roles in elucidating the functional effects of I(Ks) channel blockers in vitro. J Pharmacol Toxicol Methods. 2005;51(2):81–90. doi: 10.1016/j.vascn.2004.10.004. [DOI] [PubMed] [Google Scholar]
- 24.Li P, Rudy Y. A model of canine purkinje cell electrophysiology and Ca(2+) cycling: Rate dependence, triggered activity, and comparison to ventricular myocytes. Circ Res. 2011;109(1):71–79. doi: 10.1161/CIRCRESAHA.111.246512. [DOI] [PMC free article] [PubMed] [Google Scholar]
- 25.McKay MD, Beckman RJ, Conover WJ. A comparison of three methods for selecting values of input variables in the analysis of output from a computer code. Technometrics. 1979;21(2):239–245. [Google Scholar]
- 26.Pitt-Francis J, et al. Chaste: A test-driven approach to software development for biological modelling. Comput Phys Commun. 2009;180(12):2452–2471. [Google Scholar]
- 27.Brennan T, Fink M, Rodriguez B. Multiscale modelling of drug-induced effects on cardiac electrophysiological activity. Eur J Pharm Sci. 2009;36(1):62–77. doi: 10.1016/j.ejps.2008.09.013. [DOI] [PubMed] [Google Scholar]


