

Abstract
Functional near-infrared spectroscopy (fNIRS) is a non-invasive and portable neuroimaging technique. The method uses non-ionizing laser light in the range of red to near-infrared to detect changes in cerebral blood oxygenation. In this study, we used fNIRS to investigate cortical hemodynamic changes in the temporo-parietal and frontal regions during caloric vestibular stimulation. Caloric stimulation has previously been investigated using functional magnetic resonance imaging (fMRI) and positron emission tomography (PET), which serves as a validation of the fNIRS imaging modality toward the measurement of vestibular related brain regions. To date, only a single study has used fNIRS during caloric irrigations, which observed blood volume changes in the temporal-parietal area in healthy younger subjects. In this current study, fNIRS was used to measure cortical vestibular activation in 10 right-handed younger subjects (5 male and 5 female, age 25+/−6 years) and 10 right-handed older subjects (6 male and 4 female, age 74 +/−5 years). We investigated both warm (44°C) and cool (30°C) unilateral caloric vestibular stimulation. Consistent with previous reports, we found that warm (44°C) caloric irrigation caused a bilateral activation. In addition, we found that cool (30°C) caloric irrigation caused contralateral activation of the temporo-parietal area. This study is the first to investigate age effects of the caloric stimulation on brain activity. We found that the older subjects had stronger bilateral effects than the younger subjects. Our results confirm previous fMRI and PET studies that showed cortical activation during caloric vestibular irrigation is dependent on side of irrigation, and temperature of irrigation. Furthermore, our results demonstrate that fNIRS is a viable technique in measuring cortical effects during vestibular tasks.
Keywords: Caloric vestibular irrigation, Functional near-infrared spectroscopy
Introduction
Dizziness can be caused by a variety of factors originating from one or more underlying problems with the vestibular (balance) portion of the inner ear, connections or processing within the brain or other medical problems such as blood pressure, the side effect of medications, or psychological problems. Several vestibular tests have been developed to assess the underlying clinical cause of symptoms of dizziness and include rotational testing (Furman and Kamerer 1989; Wall and Black 1983; Wall and Furman 1989), dynamic posturography (Nashner et al. 1989; Nashner and Peters 1990), galvanic stimulation (Balter et al. 2004; Skurczynski and Ernst 1989), and video-nystagmography including caloric testing (Longridge and Leatherdale 1980; Milojevic 1965). Caloric stimulation, in particular, is a well-established clinical test of unilateral vestibular function.
Caloric stimulation assesses the patient’s vestibular response to the induction of thermal convection currents in the inner ear. The caloric test involves irrigating with tempered fluids (usually water or air) into the ear canal. Depending on the temperature of the fluid, this induces a clockwise (warm fluid) or counter-clockwise (cool fluid) convection current in the lateral semicircular canal, which results in a feeling of dizziness to the patient and provokes the vestibulo-ocular reflex (nystagmus). Unlike other physical vestibular tests, such as rotational acceleration or head positioning, caloric stimulation can be used to independently stimulate the left or right peripheral vestibular system. Thus, caloric stimulation can be used to assess unilateral vestibular problems in the clinic. Caloric stimulation can also be used to elicit brain responses individually to the left and right peripheral vestibular system.
The objective of this study was to investigate the ability of a novel portable functional brain imaging technique called functional near-infrared spectroscopy (fNIRS) to measure cortical brain activity during caloric vestibular testing in young and older subjects. To date, only a single small (N=5; healthy volunteers) study by Iida et al, (Iida et al. 2009) has been done using fNIRS to image the brain during caloric stimulation. In the Iida et al, study fNIRS signals were recorded in the temporo-parietal region of the brain during unilateral warm (44°C) and cool (30°C) caloric irrigations and blood volume (total-hemoglobin) changes in these regions were reported. In addition, brain imaging by functional magnetic resonance imaging (fMRI) (Fasold et al. 2002) and positron emission tomography (PET) (Bottini et al. 1994; Dieterich et al. 2003; Emri et al. 2003; Naito et al. 2003) have been previously used to study brain activation during similar caloric stimulation tasks (reviewed in (Dieterich and Brandt 2008)). Thus, in this study, we have sought to assess the utility of fNIRS to reproduce these previous PET and fMRI studies in the younger population. Having validated this method in younger subjects, we additionally sought to investigate the effects of aging through testing in an older population.
Although brain activation can be measured during caloric stimulation with fMRI and PET, in general, the use of these modalities is very limited in vestibular tasks because of the requirement for the patient to remain motionless in the supine position for such images. In contrast, fNIRS is a smaller, portable, imaging modality that can be used in a wider variety of experimental situations including walking (Miyai et al. 2001; Suzuki et al. 2008), vestibular stimulation (Iida et al. 2009), and upright balance (Karim et al. 2011; Mihara et al. 2008). Therefore, the demonstration of the ability to use fNIRS to assess the cortical areas of the brain known to be involved in vestibular function and sensory-integration would allow this method to be more widely used in the investigation of the role of the brain in vestibular function.
Functional near-infrared spectroscopy
Functional near-infrared spectroscopy (fNIRS) is a non-invasive brain imaging technique, which uses low-levels (<0.2W/cm2) of light to record changes in blood oxygenation in the brain. The low absorption properties of biological tissue to light wavelengths between 650–900 nm allow light to penetrate through centimeters of tissue (Cope et al. 1988). From optical sensors placed upon the scalp, near-infrared light can measure changes in optical absorption due to hemoglobin from approximately the outer 5–8 mm of cortex of the brain (Wang et al. 1995). For brain imaging studies, fNIRS signals are recorded from sensors placed on the scalp and measured through flexible fiber optic cables connected to the NIRS instrument. At each position, two or more colors of light are used to resolve the changes in oxy- and deoxy-hemoglobin from the modified Beer-Lambert law (Cope et al. 1988). By positioning these fiber optic cables at different spatial locations on the head, this brain activity can be localized to underlying brain regions with a lateral spatial resolution of a few centimeters (see (Boas et al. 2004) for review). Since fNIRS uses portable, low-cost instrumentation, with sensors that can be worn during upright movement, this technology is well suited for vestibular testing in humans. Functional NIRS has been previously used in several studies of gait, posture, and vestibular function (Karim et al. 2011; Mihara et al. 2008; Miyai et al. 2001; Suzuki et al. 2008).
Functional contrast for fNIRS brain imaging is based on regional changes in cerebral blood flow and oxygen metabolism associated with changes in neural activity in the brain. This phenomenon is the basis of fNIRS, as well as other functional neuroimaging techniques including functional MRI. The resulting change in regional blood oxygenation is called the BOLD (blood oxygen level dependent) effect. The BOLD effect results in changes in the spectral absorption properties of the brain due to increased oxy-hemoglobin (and decreased deoxy-hemoglobin). In turn, this changes the amount of light detected by the NIRS sensors lying above this region of the brain. Previous work has demonstrated good temporal (R2=0.98; (Huppert et al. 2006a)) and spatial (R2=0.83; (Huppert et al. 2006b)) correlations between fNIRS and fMRI activations during motor tasks from concurrent multimodal recordings (reviewed in (Steinbrink et al. 2006)).
Brain imaging of vestibular function
Over the last fifteen years, several central and cortical brain regions have been identified by fMRI and PET studies to play a role in the vestibular network (reviewed in (Dieterich and Brandt 2008)). In early studies in non-human primates, areas of the parieto-insular vestibular cortex (PIVC), the visual temporal sylvian area (VTS) in the retroinsular cortex, the superior termporal gyrus (STG), the inferior parietal lobule (IPL), the anterior cingulate, the hippocampus, and the supplemental motor area were identified as part of the multi-sensory vestibular network (Guldin and Grusser 1996). Later studies in humans confirmed the existence of analogous areas of the brain within the temporo-insular and temporo-parietal cortices (Dieterich et al. 2003). Activation of particular areas of the posterior insula and retroinsular regions (analogous to the PIVC and VTS areas in the monkey), STG, and IPL has been observed by fMRI and PET during caloric irrigations (Dieterich and Brandt 2008). Additional areas of the pre- and postcentral gyrus, anterior insula, inferior frontal gyrus, anterior cingulate gyrus, precuneus, and the hippocampus have also been identified in human studies. In a study by Iida et al, fNIRS signals were recorded in the temporo-parietal region of the brain in five healthy volunteers during unilateral warm (44°C) and cool (30°C) caloric irrigations (Iida et al. 2009). During warm stimulation, they observed increased bilateral blood volume (total-hemoglobin) changes with larger changes on the hemisphere ipsilateral to the side of stimulation. During cool-water stimulation, they observed bilateral decreases in total-hemoglobin that also showed a dominant decrease on the ipsilateral side of stimulation. In these previous PET and fMRI studies, brain activity to caloric stimulation was also shown to depend on the handedness of the subject, the side of the stimulated ear, the temperature of caloric irrigation, and the direction of the nystagmus (Dieterich et al. 2003; Naito et al. 2003). Previous studies in PET have shown an effect on cortical responses related to handedness of subjects and side of stimulated ear during caloric stimulation (Dieterich et al. 2003).
In addition, it has been shown that caloric stimulation-induced vestibulo-ocular responses change with age. Degradation of the peripheral vestibular system with advanced age is well established (Rosenhall and Rubin 1975; Ross et al. 1976). Karlsen et al found that older subjects (over 65 years old) had decreased slow component velocities, nystagmus durations, nystagmus frequencies, and nystagmus amplitudes (Karlsen et al. 1981). Further, caloric responses have been found to increase in middle age, peak between 50–70 years, then decrease with advancing age (Bruner and Norris 1971; Mulch and Petermann 1979). Despite these well-characterized differences in nystagmus responses, to-date, only one study has been done to investigate the differences in brain responses to caloric stimulation in older subjects which found that there were aging effects in magnetoencephalography (MEG) measurements after cold (5°C) irrigation in the right ear as compared to a younger subject population (Kandori et al. 2003). Kandori et al indirectly inferred caloric-induced brain differences using a secondary auditory stimulus in the MEG before and after caloric irrigation to probe the brain response. To our knowledge, no study had directly examined differences in brain activity with age during caloric stimulation.
Based on these previous results from fMRI and PET studies, we hypothesized that the brain regions involved in the multisensory vestibular network, namely the temporo-parietal regions, supramarginal gyrus (SMG), and STG could be imaged using fNIRS. Although deeper areas of insula, thalamus, anterior cingulate and putamen would also be found to be activated during caloric activation, these areas are too deep inside the brain for fNIRS measurements, which are limited to about the first 5–8 mm of the cortical surface. Figure 1 summarizes the cortical regions that have been identified from previous fMRI and PET studies, which are expected to be accessible to fNIRS imaging.
Figure 1.
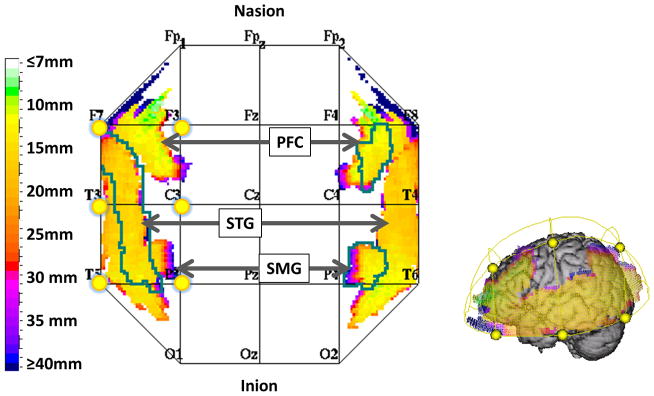
Brain regions that are known to be involved in the response to unilateral caloric vestibular stimulation are shown above (images were generated using the T2T java applet (Deppe et al. 2003)). Regions such as the superior temporal gyrus (STG), prefrontal cortex (PFC), and supramarginal gyrus (SMG) are all accessible to fNIRS as indicated by the color bar that indicates depth. These regions have been projected to the cortical surface of the Colin-27 brain. Yellow dots indicate the region of the bilateral fNIRS probe used in this study.
Methods
Subject population
Functional NIRS data from two groups of subjects was recorded in this study: young (N=10, 5M/5F, age 25+/−6 y/o) and older (N=10, 6M/4F, age 74+/−5 y/o). All study participants were right-handed (self-reported) subjects with no reported vestibular health issues. All subjects were screened for a self-reported history of neurologic or otologic disease. This study was approved by the University of Pittsburgh Internal Review Board and all subjects provided written informed consent.
Caloric testing
All caloric testing was conducted using the Brookler-Grams closed loop caloric irrigator. Testing combined unilateral left/right ear stimulation with warm (44°C) or cool (30°C) water irrigations yielding four test conditions. Caloric stimulation was applied for 45 seconds for each condition during NIRS recordings. Two additional negative control (sham) conditions were used during which the irrigation balloon was placed in the ear canal with no temperature stimulation. This task controlled for potential direct sensory responses caused by the irrigation balloon itself. Since the irrigation balloon is restricted to the ear canal, which was about 4–6cm away from the lowest fNIRS sensor, it is very unlikely that optical absorption or scattering changes due to the water or inflation of the balloon would have any direct effect on the optical measurement, however, we did not explicitly investigate this assumption. The nystagmus response to caloric irrigation was recorded using Visual ENG infrared goggles (Micromedical Technologies V5.00). The nystagmus response was calculated from the degrees per second of eye rotation for the slow component of each nystagmus beat. The slow component of the nystagmus was further used in the analysis of the fNIRS data as a regressor in the temporal (general linear) statistical model.
Caloric stimulation and fNIRS recordings were performed concurrently in a clinical exam room dedicated to caloric vestibular testing within the University of Pittsburgh Medical Center’s Eye and Ear Institute. Because the fNIRS instrument is portable, no modifications were made to the standard clinical testing room. During the exams, each subject completed all six separate trials: two negative control tasks, warm caloric irrigations and cool caloric irrigation, which was repeated in each ear. The caloric and negative control tasks were alternated between the left and right ears and the order was counter-balanced across subjects. Warm water caloric irrigation was always done prior to cool irrigation. Prior to each trial, baseline NIRS data were collected, and continued to be collected while the irrigation balloon was inserted in the ear canal. Each trial had 45 seconds of caloric stimulation. After 20 seconds following caloric irrigation cessation, fixation was done for 5 seconds to dampen the nystagmus response. The fixation was then stopped for an additional 55 seconds, and then done again for 10–15 seconds or until the nystagmus response was fully suppressed. Total time for each trial was approximately 210 seconds. The first trial was always a negative control trial where the irrigation balloon was inserted in the ear with no thermal stimulation. Trials 2 and 3 were the warm water caloric trials; trials 4 and 5 were the cool water caloric trials; trial 6 was the final control trial.
During both the baseline period and caloric irrigations, subjects were told to count backward from 100 by 2’s, to ensure a robust nystagmus response. This task was also repeated during the negative control tasks. During clinical caloric testing, this (or similar) simple alerting tasks are required to prevent drowsiness and prevent reduction of the nystagmus response (Jacobson et al. 1997). This counting task was performed throughout the entire scan (e.g. during both the baseline and the caloric task), which allows the direct effect of the counting task on the fNIRS signals to be canceled by analysis.
NIRS data collection
A 32-channel continuous wave fNIRS instrument (Figure 2, left) was used (CW6 Real-time system; TechEn Inc, Milford MA), as detailed in previous work (A. F. Abdelnour and Huppert 2009). A total of 8 source and 16 detector channels were used for this study because of limitations in setup time and greater sensitivity of large NIRS head caps to motion artifacts during subject movement. Thirty source-detector combinations at each wavelength were recorded, based on nearest-neighbor measurement geometry with a source-detector spacing of 3.2 cm (Figure 2, bottom and top right). This instrument uses two light wavelengths at 690 nm (12 mW) and 830 nm (8 mW) to provide sensitivity to both oxy- and deoxy-hemoglobin changes in the brain. This light was delivered via fiber optic cables to a grid of source positions, called optodes, distributed over the head within a neoprene cap. The cap was placed on the subject’s head so as to position the fNIRS probe properly across the prefrontal and temporal cortices of the left and right hemisphere and then anchored in place to prevent slippage during subject movement. Ten-meter long fiber optic cables transmitted data from the subject to the instrument, which was located inside the testing room. FNIRS data were sampled at 4Hz using custom data acquisition software (A. F. Abdelnour and Huppert 2009).
Figure 2.

The fNIRS CW6 (Left) instrument delivers and receives laser light using flexible fiber optics to the surface of the head using light sources and detectors, respectively. The fNIRS probe (bottom right, only one side shown) is created using nearest-neighbor source-detector geometry. The approximate location of the fNIRS bilateral probe (top right) is shown with sources (green) and detectors (blue) as well as source-detector combinations (red dotted line). Yellow dots correspond to those from figure 1. The region shown is approximately the temporal gyrus.
Analysis of fNIRS data
Analysis of fNIRS data was based on a spatial-temporal version of the general linear model (Ye et al. 2009). This approach is similar to the standard model used for the analysis of fMRI data via a canonical general linear model (e.g. statistical parametric mapping; SPM; (Friston 2007)). The general linear model was based on the onset and duration (45 seconds) of the actual caloric irrigation, which was convolved with the gamma-variant impulse response function for SPM (Ye et al. 2009). The experimentally measured slow component velocity of the nystagmus response was used as an additional temporal regressor in the general linear model. A series of discrete cosine transform terms (0–1/120 Hz) were used as nuisance regressors to remove slow drift. Restricted maximum likelihood with a first-order autoregressive noise term was used to estimate the noise statistics (pre-whitening) and the linear model was solved using the Gauss-Markov equation (see (Friston 2007)). Temporal analysis was performed on a per subject basis and the estimated weight coefficients and error models were then used for image reconstruction (F. Abdelnour et al. 2009; F. Abdelnour et al. 2010) and random-effects group-level analysis (A. F. Abdelnour and Huppert 2011).
Prior to collection of the fNIRS data, a three-dimensional camera (Polhemus; Colchester, VT) was used to mark the location of the optical sensors relative to the nasion, inion, the top of the head, and ear-lobe fiducial locations. This registration information was then used to register the location of the optical sensors to an anatomical MRI head Colin27 atlas (Holmes et al. 1998) using an affine registration algorithm (A. F. Abdelnour and Huppert 2011).
Based on the registration of the optical sensors to the atlas head, a finite-element model of light diffusion (Dehghani et al. 2008) was used to build the optical forward model describing the sensitivity of the probe to the underlying regions of the brain (F. Abdelnour et al. 2009). The forward model based on the placement of the fNIRS probe for each subject was used to estimate images of brain activity using the regularized inverse model (F. Abdelnour et al. 2010). The fNIRS image reconstruction model was based on the cortical-surface model described in Abdelnour and Huppert (F. Abdelnour et al. 2009), which used wavelets to model the surface of the cortex of the brain. Group-level random-effects analysis across the subjects was performed to estimate brain activity for the young and older groups (A. F. Abdelnour and Huppert 2011).
Results
Temporal dynamics of the caloric-induced response
Functional NIRS signals were recorded from 10 younger (N=10) and 10 older (N=10) participants. Figure 3 shows the group average of the fNIRS temporal response for both the older and younger groups from the average of the measurement channels over the superior temporal gyrus. Following the caloric irrigation, oxy-hemoglobin concentration increases and deoxy-hemoglobin decreases, which is consistent with the typical hyperemic blood oxygen level dependent response observed in other fNIRS and fMRI studies.
Figure 3.

Group level (older, N=10, and younger, N=10, groups) fNIRS responses averaged over measurement channels that covered the superior temporal gyrus on the left hemisphere (LH) and right hemisphere (RH) side of the head. The average ocular slow component of the nystagmus is shown in black (arbitrary units; scaled to fit in each window) and oxy-, deoxy-, and total- hemoglobin are shown in red, blue, and green, respectively. The gray arrow is the approximate time at which subjects had a short fixation done to suppress the nystagmus. The gray box region (0–45 seconds) represents the time where caloric irrigation was performed.
Most notably in our study, the temporal characteristics of the cerebral hemodynamic response were similar to that of the vestibulo-ocular response. Both the vestibulo-ocular response and hemoglobin changes in the brain begin to increase strongly only near the end of the 45-second irrigation period as shown in figure 3. These changes persist for almost two minutes after irrigation has ended. This observation also is consistent with previous fMRI studies of caloric irrigation, which found similar expectantly long durational responses (Dieterich and Brandt 2008). In contrast, the typical canonical hemodynamic response to (for example) sensory stimulation typically rises within several seconds (1–3 sec) of the onset of the stimulation and recovers to baseline around 6–10 sec after cessation. The recovery of the hemodynamic response to caloric stimulation is almost an order magnitude longer than the typical canonical response typically seen for other types of stimuli in fMRI and fNIRS studies.
As shown in the fNIRS time courses from the regions-of-interest from the left and right temporo-partial areas as shown in figure 3, we observed that the nystagmus was strongly correlated to both the block averaged oxy-hemoglobin and deoxy-hemoglobin responses. The median correlation value (Pearson linear correlation) between oxy-hemoglobin and the nystagmus for the older subjects (N=10) was R=0.31 [p<0.001] (range R=0.01–0.77). The correlation in the younger subjects (N=10) had a median value of R=0.17 [p=0.03] (range R=0.01–0.80). In a three-way ANOVA test of the z-transformed correlation values, we found that the correlation with the nystagmus did not vary across the type of caloric stimulation condition or hemisphere of the brain. The nystagmus was slightly more correlated with the fNIRS response in the elderly subjects than the younger subjects (p<0.02).
In order to further investigate the relationship between the nystagmus and fNIRS signals, during the scan, a brief 5-second subject fixation period was performed at 120-seconds after the start of irrigation (shown in figure 3 with a vertical arrow indicating the time of the fixation point). This fixation period was added to more directly probe the interaction of the nystagmus and fNIRS brain responses. It is well established that during the brief fixation, the nystagmus response will temporarily decrease and then return once fixation is removed (Alpert 1974). We had hypothesized that the fNIRS response would also decrease during fixation. However, we found that although the nystagmus drops during brief fixation, the fNIRS signal was not observed to statistically follow this pattern as shown in figure 3.
Based on the empirical finding of a strong correlation between the nystagmus and the block-averaged hemodynamic responses, a general linear model was used to analyze fNIRS signal recordings, which included the nystagmus as a regressor in addition to a box-car function spanning the 45-seconds in which the caloric irrigation was applied. We also examined a second regression model using a boxcar regressor from the end of the irrigation period to 180-seconds (final fixation period) in the general linear model in place of the nystagmus response. These two competing regression models (actual nystagmus data versus a simple boxcar regressor) yielded similar brain images and a preferred model could not be identified by an F-test of the two models. Only the results from the nystagmus regression model are shown in the following sections as motivated from a physiological viewpoint.
In the general linear model, the box-car regressor corresponding to the timing of the caloric irrigation captures the hypothesis of brain areas associated directly with the timing of the caloric irrigation (0–45s). During the 45-second irrigation period, no significant brain activity was observed to be directly related to the irrigation within the areas sampled by the fNIRS probe. It is possible that areas of the primary or secondary somatosensory cortex might be activated directly by the irrigations; however, these regions were not within the areas sampled by the fNIRS probe. This finding is consistent with the data shown in figure 3, which shows that brain activity following caloric irrigation appears to follow the time-course of the nystagmus response rather than the direct effect of the irrigations.
Brain activation during caloric vestibular stimulation
The nystagmus regressor within the general linear model allows testing for brain areas correlated to the timing of the nystagmus post irrigation. Based on the coefficients of the regression models, images of brain activation for each condition were reconstructed. The group-level reconstructed images of brain regions correlated to the nystagmus are shown in figure 4. This figure shows the measured brain activity (oxy-hemoglobin) on the cortical surface based on the image reconstruction of the fNIRS data.
Figure 4.

Measured brain activity (oxy-hemoglobin) on the cortical surface based on the image reconstruction of the fNIRS data. The color bars show where areas of activation increased (red) or decreased (blue) significantly. Purple dots represent fNIRS source positions and green dots represent fNIRS detector positions.
In both subject groups, cool stimulation produced activation in the brain on the side contralateral to the stimulated ear. Right cool stimulation consistently deactivated the right hemisphere while activating the left hemisphere in both young and older subjects. In both young and older subjects, left cool stimulation activated both hemispheres with a right hemispheric dominance. The activation on the right side of the brain was a bit more superior and extended into the parietal and supramarginal areas compared to the activation seen on the left side of the brain, which was largely confined to the superior temporal gyrus. However, because of the nature of the fNIRS image reconstruction process and registration, this difference between the locations of activation on the two sides of the brain may be an artifact of the image reconstruction process and care should be exercised in over-interpreting the spatial fNIRS images.
In contrast to cool caloric stimulation, warm stimulation in the younger and older population produced activation signals that were more bilateral. Figure 5 shows the brain activation differences between the older and younger group as maximum/minimum intensity projections of group difference after subtraction of the brain images (as shown in figure 4). The red (positive) color scale shows areas that are statistically activated (p<0.05; corrected) in the older subject group compared to the younger subjects. The blue (negative) color scale shows areas that were more active in the younger group compared to the older group.
Figure 5.

Differences in brain activation between the older and younger group as maximum/minimum intensity projections of group difference after the subtraction of the brain images. The L indicates the left hemisphere and the A indicates anterior.
For all four conditions, the older subject group had greater activations (or fewer deactivations) than the younger subject group in the left hemisphere. The younger subject group had greater activations in the right hemisphere during the warm stimulation conditions. During the warm caloric stimulation, the older subjects had less activation on the right side of the brain and more activation on the left side of the brain during left or right ear stimulations. During cool caloric stimulation, the older subject group had greater activation, particularly on the side ipsilateral to the stimulated ear.
A summary of the results of the fNIRS brain imaging shown in figures 4 and 5 is provided in table 1. Based on the image reconstruction maps, a k-means cluster analysis was performed using the threshold of p<0.05 (corrected) to generate table 1. Based on this cluster analysis, an asymmetry index was defined using the formula ASI ≡ (Cright − Cleft)/(|Cright|+|Cleft|) where Cright and Cleft is the activation response in the right and left corresponding cluster regions respectively. An ANOVA test between the two groups of individual subjects showed that asymmetry index for the left cold stimulation (p=0.027), left warm stimulation (p=0.037) and right warm stimulation (p=0.06; near-significant trend) showed that these responses were more symmetric (closer to zero) in the elderly group. The asymmetry of the right cold stimulus was not different between the two groups.
Table 1.
Results of a k-means cluster analysis using a threshold of p<0.05 (corrected) done on image reconstruction maps. The location of the cluster (in talairach coordinates), the cluster size and amplitude, as well as the p-value (probability) and asymmetry index are given. N/S indicates activations that were not significant.
| Elderly | ||||||||
|---|---|---|---|---|---|---|---|---|
| X | Y | z | Cluster size (mm^2) | Amplitude | Probability | Asymmetry Index | ||
| Left Cold | Right | −49.3 | −20.5 | 12.7 | 125.4 | 3.6 | 0.018 | 20% |
| Left | 56.0 | 14.7 | −1.9 | 69.5 | 2.4 | 0.047 | ||
| Left Warm | Right | −51.6 | −28.4 | 5.2 | 101.1 | 2.6 | 0.040 | −15% |
| Left | 57.1 | 7.6 | −6.9 | 73.1 | 3.5 | 0.020 | ||
| Right Cold | Right | −51.5 | −22.8 | 7.2 | 109.8 | −2.3 | 0.05 | −100% |
| Left | 56.1 | 11.3 | −16.8 | 52.6 | 4.1 | 0.013 | ||
| Right Warm | Right | −48.8 | −24.9 | 8.4 | 146.4 | 8.2 | 0.002 | 115% |
| Left | 57.5 | 7.8 | −5.4 | 83.2 | 6.1 | 0.004 | ||
|
| ||||||||
| Young | ||||||||
| Left Cold | Right | −47.8 | −24.7 | 10.5 | 143.2 | 4.1 | 0.013 | 100% |
| Left | 56.0 | 14.8 | −9.0 | 51.0 | −0.6 | N/S | ||
| Left Warm | Right | −47.9 | −27.4 | 8.0 | 138.5 | 5.7 | 0.005 | 24% |
| Left | 55.2 | 12.7 | −7.5 | 82.6 | 3.5 | 0.019 | ||
| Right Cold | Right | −48.8 | −17.5 | 9.5 | 119.6 | −1.3 | N/S | −100% |
| Left | 58.9 | 2.0 | −9.2 | 54.6 | 3.0 | 0.028 | ||
| Right Warm | Right | −48.6 | −21.7 | 7.7 | 156.6 | 9.7 | 0.001 | 44% |
| Left | 59.0 | 1.5 | −6.4 | 60.1 | 3.8 | 0.016 | ||
Figure 6 shows a graphical summary of the results of this study based on table 1 that shows the side stimulated, the type of stimulation, the expected vestibulo-ocular response (nystagmus), amplitude of the brain activation (based on amplitude from table 1), and a quantification of bilaterality (ASI) as previously defined.
Figure 6.

A graphical summary of the activations in the temporal region (left STG and right STG) found in this study. A red/blue ear indicates warm/cool caloric stimulation, respectively; on that side of the ear (e.g. red right ear means warm stimulation in the right ear). The direction of the slow component of the nystagmus (VOR) is shown by an arrow. A plus indicates activation and a minus indicates deactivation. The relative size of the plus/minus indicates the magnitude of the activation/deactivation. The asymmetry index, ASI, (% right hemisphere) is provided.
Discussion
Using fNIRS, we found that there is a significant change in hemoglobin concentrations in the temporo-parietal area around the superior temporal gyrus (STG) and supramarginal gyrus (SMG) following caloric stimulation. These findings are consistent with prior expectations of the role of these structures in vestibular processing based on previous fNIRS, fMRI and PET data. These results confirm the feasibility of using fNIRS to record vestibular signals from the cortex and support some of the earlier findings from a similar fNIRS study by Iida et al (Iida et al. 2009). Since fNIRS is more portable than other neuroimaging methods, these findings point to several future studies that can now take advantage of this technology in characterizing the role of the cortex in human vestibular interactions. Because the depth sensitivity of fNIRS limits the method to the outer cortex of the brain, we propose that fNIRS should be used to compliment full-brain imaging methods like fMRI or PET to provide a better understanding of cortical and subcortical vestibular structures.
Although several groups have looked at caloric stimulation in fMRI, PET, and fNIRS, to our knowledge this is the first brain imaging study to measure the direct effect of caloric vestibular stimulation in a healthy older population where effects of warm/cool and left/right side irrigation were investigated. In both young and older populations, cool water irrigation produced a dominant activation contralateral to the stimulated ear. The cool water response was almost completely asymmetric with the exception of the left cool stimulation in the elderly group. In contrast, warm caloric stimulation produced more bilateral activations than the cool stimulus, with generally more activation on the right hemisphere. Although warm stimulation was more bilateral than cool in both populations, we found that the warm stimulus responses in the older participants were more symmetrical than the younger population (p<0.05 for both left and right stimulation), which may be due to cortical dedifferentiation and possibly related to a compensatory cortical mechanism related to aging. This is consistent with models such as the neurocompensation hypothesis proposed by Reuter-Lorenz et al. which suggest that greater bilateral activation occurs in older subjects as compared to younger subjects (P. A. Reuter-Lorenz and Lustig 2005). Evidence of this compensation has been observed in a number of cognitive, premotor, and motor studies in the elderly (reviewed in (P.A. Reuter-Lorenz and Cappell 2008)).
Temporal dynamics of the caloric-induced brain response
We found that the timing of the fNIRS measured hemodynamic responses in the brain was significantly longer than would have been predicted by the typical canonical response to the 45-second caloric irrigation alone. As was shown in figure 3, although the caloric irrigation lasted only 45 seconds, the fNIRS brain responses to all of the stimulus conditions continued for almost 2-minutes. This is consistent with previous reports that the vascular response in fMRI also has a similar elongated response (Dieterich and Brandt 2008), which is not directly the effect of the caloric irrigation, but rather tied to the production of convention currents in the inner ear, which gives rise to the nystagmus and feelings of dizziness. This finding suggests that the changes in brain activity (hemoglobin) recorded in the cortex are not the direct result of the sensation of the caloric irrigation or an artifact of the device itself, but rather are related either directly or indirectly to the underlying physiological vestibulo-ocular response. In our data, we found that these hemodynamic changes were strongly correlated to the time-course of the ocular nystagmus response to the caloric irrigations. This correlation did not vary between brain hemispheres or stimulus conditions, but was slightly (p<0.02) more correlated in the older subject group.
In order to further examine the relationship between the nystagmus and the fNIRS response, we had introduced a brief visual fixation period, which caused the nystagmus to transiently decrease and then recover. We found that the fNIRS vascular responses do not appear to show the same effect of brief fixation as seen in the nystagmus response. This further suggests that the observed brain signals may be the result of an underlying upstream process in the brain that also causes the nystagmus response but are not a direct effect of the nystagmus itself and should be investigated further in future studies.
Brain activation patterns
In both subject groups, we found that warm caloric vestibular stimulation of the right ear caused bilateral activation (increase in blood flow) in the superior temporal gyrus (STG) and strong activation in the inferior parietal lobe (IPL) in the right hemisphere, as seen in figure 4. This strong unilateral activation in the right hemisphere of the IPL has also been previously shown by Dieterich et al (Dieterich et al. 2003). In addition, we found that warm caloric irrigation of the right ear in young, right-handed participants causes strong activation in the right hemisphere (i.e. ipsilateral to the side stimulated) versus in the left ear that caused an overall bilateral response. Strong activation occurred on the right IPL with right ear stimulation, while strong activation occurred on the left STG with left ear stimulation. Previously, Dieterich et al found that warm left ear stimulation caused a strong left STG (BA 41) activation and left IPL (BA 40) activation (Dieterich et al. 2003). In addition, they found a small amount of frontal activation in the left inferior frontal gyrus/precentral gyrus (BA 44/6). In our study, we found deactivation in a similar region of the inferior frontal cortex. This disagreement may be due to differences in the functional contrast or spatial resolutions between the imaging modalities used between these two studies (e.g. fNIRS versus PET).
In both subject groups, we found that cool irrigation of the right ear caused left-sided activation and right hemisphere deactivations, while irrigation in the left ear activated the right hemisphere. The similar fNIRS study by Iida et al. (Iida et al. 2009) was one of the only other studies to use cool stimulation as 30°C. They found that using cool irrigation caused decreased cerebral total-hemoglobin in both ears and especially on the side ipsilateral to the ear stimulated. In our study, we found that cool irrigation of young, right-handed participants caused activation contralateral and deactivation ipsilateral to the side of the stimulated ear, which is in partial agreement with the Iida et al study. Our finding of decreases in oxy- and total-hemoglobin in the ipsilateral ear is similar to the Iida et al study. However, we report a dominant increase in oxy- and total-hemoglobin in the contralateral hemisphere that was not observed previously. Nevertheless, this observation of the contralateral increase in activity during cool stimulation is consistent with several other neuroimaging studies using fMRI and PET that have looked at brain responses to very cold water at 0–4°C or cold nitrogen at 5–7°C stimulation. In one such study by Bottini et al. (Bottini et al. 1994), they showed that iced water irrigation of the left ear caused activation in the right IPL while in the right ear there was activation in the left IPL (i.e. activation contralateral to the stimulated side) which is somewhat consistent with our current findings. Another study by Suzuki et al. showed that irrigation with cold (4°C) water in the right ear showed bilateral STG activation and right IPL activation, while irrigation in the left ear caused activation that was generally more significant on the right versus left hemisphere in the STG and IPL (Suzuki et al. 2001). Similarly, a study by Fasold et al reported that irrigation with nitrogen at 5–7°C showed that regardless of the side stimulated, there was strong right hemisphere dominance in all subjects (Fasold et al. 2002). However, since it is known that such very cold irrigation produces significant nausea, the interpretation of these very cold stimulating studies is likely to be additionally confounded by nociceptive-associated activation and increased attendant nausea. Therefore, the cool (30°c) water used in this current study cannot be directly related to the cold (4°c) water used in these other previous studies.
Limitations of this current study
In this study, we found differences in the brain responses between the older and younger aged subjects. A current limitation of this study is that we cannot rule out the possibility that these differences might be due to systematic differences in the anatomy of the head between the two groups (e.g. the effect of brain atrophy in the older group). Previous work by Custo et al. demonstrated that registration based on an atlas is sufficient for modeling light paths through the head of healthy, normal subjects (Custo et al. 2006). However, systemic differences in anatomy between our two age groups as well as structure of the brain may introduce additional errors. In addition, previous modeling studies have also found that there even exist differences in the sensitivity of fNIRS in the left versus right hemisphere of a single subject (Perdue et al. 2012). In this study, there are two distinct populations, young and older, which may introduce additional errors when comparing across these subject populations. In future studies, individual structural information from MRI could be used to address these issues.
A further limitation of this current study is the potential artifactual effect of the caloric stimulator device on the fNIRS measurements since measurements made close to the ear could be affected by changes in optical absorption or scattering due to the device in the ear canal. To our knowledge, the direct effect of thermal stimulation on the optical properties of tissue has not been investigated. From the Monte Carlo modeling of the optical forward solutions used in this work, we found that sensitivity to the area around the ear canal was substantially less (3–4 orders of magnitude) than the number of photons reaching the region-of-interest in the brain (e.g. STG) for the sensors nearest the ear canal. Although this linear model suggests that very little signal is coming directly from the area around the ear canal, we cannot rule out the possibility of non-linear effects due to the potential scattering or absorption changes arising from the expansion of the caloric balloon inside the ear canal.
Utility of fNIRS for Vestibular Testing
Functional NIRS is a non-invasive neuroimaging technique. In contrast to fMRI, fNIRS uses flexible fiber optic cables mounted onto a head cap with no restrictions to subject position or the requirement for the participant to remain motionless. In previous studies, fNIRS has been used to measure brain signals during walking and gait (Miyai et al. 2001; Suzuki et al. 2008), balance (Karim et al. 2011), and posturography testing (Mihara et al. 2008). Although fNIRS has been previously used by Iida et al (Iida et al. 2009) in a study of caloric stimulation, the reported results of that paper were not completely consistent with other PET and fMRI results, but did report that total hemoglobin increased with warm (44°C) caloric stimulation and decreased with cool (30°C) caloric stimulation. It is possible that this discrepancy was the result of handedness of the subjects, which was not reported in their paper. It is known from previous caloric and imaging studies, that handedness has a strong influence on laterality of the brain signal during caloric stimulation. In addition, this paper looked specifically at total-hemoglobin changes, whereas the fMRI signal is more closely related to deoxy-hemoglobin (Huppert et al. 2006b; Huppert et al. 2006a). Our results showed large oxy- and deoxy-hemoglobin changes.
Summary
The fNIRS signals in this study were consistent with the previous studies of neuroimaging during warm and cool caloric stimulation. FNIRS is a portable and relatively inexpensive imaging modality that can be used to study cortical effects during a task.
Highlights.
Functional near-infrared spectroscopy (fNIRS) measures functional activity.
FNIRS was used in young and older subjects during vestibular caloric irrigation.
Warm irrigation shows bilateral activity; dominance ipsilateral to side stimulated.
Cool irrigation shows unilateral activity contralateral to the side stimulated.
Elderly subjects show greater bilateral effects.
Acknowledgments
This work was supported by a pilot grant awarded under the Pittsburgh Pepper Center for aging and mobility and the National Institutes of Health Institute on Aging (P30AG024827).
Footnotes
Publisher's Disclaimer: This is a PDF file of an unedited manuscript that has been accepted for publication. As a service to our customers we are providing this early version of the manuscript. The manuscript will undergo copyediting, typesetting, and review of the resulting proof before it is published in its final citable form. Please note that during the production process errorsmaybe discovered which could affect the content, and all legal disclaimers that apply to the journal pertain.
References
- Abdelnour AF, Huppert T. Real-time imaging of human brain function by near-infrared spectroscopy using an adaptive general linear model. Neuroimage. 2009;46(1):133–43. doi: 10.1016/j.neuroimage.2009.01.033. [DOI] [PMC free article] [PubMed] [Google Scholar]
- Abdelnour AF, Huppert TJ. A random-effects model for group-level analysis of diffuse optical brain imaging. Biomedical Optics Expres. 2011;2(1):1–25. doi: 10.1364/BOE.2.000001. [DOI] [PMC free article] [PubMed] [Google Scholar]
- Abdelnour F, Schmidt B, Huppert TJ. Topographic localization of brain activation in diffuse optical imaging using spherical wavelets. Phys Med Biol. 2009;54(20):6383–413. doi: 10.1088/0031-9155/54/20/023. [DOI] [PMC free article] [PubMed] [Google Scholar]
- Abdelnour F, Genovese C, Huppert T. Hierarchical Bayesian regularization of reconstructions for diffuse optical tomography using multiple priors. Biomedical optics express. 2010;1(4):1084–103. doi: 10.1364/BOE.1.001084. [DOI] [PMC free article] [PubMed] [Google Scholar]
- Alpert JN. Failure of fixation suppression: a pathologic effect of vision on caloric nystagmus. Neurology. 1974;24(9):891–6. doi: 10.1212/wnl.24.9.891. [DOI] [PubMed] [Google Scholar]
- Balter SG, et al. Background on methods of stimulation in galvanic-induced body sway in young healthy adults. Acta oto-laryngologica. 2004;124(3):262–71. doi: 10.1080/00016480310015245. [DOI] [PubMed] [Google Scholar]
- Boas DA, Dale AM, Franceschini MA. Diffuse optical imaging of brain activation: approaches to optimizing image sensitivity, resolution, and accuracy. Neuroimage. 2004;23(Suppl 1):S275–88. doi: 10.1016/j.neuroimage.2004.07.011. [DOI] [PubMed] [Google Scholar]
- Bottini G, et al. Identification of the central vestibular projections in man: a positron emission tomography activation study. Experimental brain research. Experimentelle Hirnforschung. Experimentation cerebrale. 1994;99 (1):164–9. doi: 10.1007/BF00241421. [DOI] [PubMed] [Google Scholar]
- Bruner A, Norris TW. Age-related changes in caloric nystagmus. Acta oto-laryngologica. Supplementum. 1971;282:1–24. [PubMed] [Google Scholar]
- Cope M, et al. Methods of quantitating cerebral near infrared spectroscopy data. Adv Exp Med Biol. 1988;222:183–9. doi: 10.1007/978-1-4615-9510-6_21. [DOI] [PubMed] [Google Scholar]
- Custo A, et al. Effective scattering coefficient of the cerebral spinal fluid in adult head models for diffuse optical imaging. Appl Opt. 2006;45(19):4747–55. doi: 10.1364/ao.45.004747. [DOI] [PubMed] [Google Scholar]
- Dehghani H, et al. Near infrared optical tomography using NIRFAST: Algorithm for numerical model and image reconstruction. Commun Numer Methods Eng. 2008;25(6):711–32. doi: 10.1002/cnm.1162. [DOI] [PMC free article] [PubMed] [Google Scholar]
- Deppe M, Steinsträter O, Knecht S. The T2T-Database Java Applet. Neuroimage. 2003;19:S48. [Google Scholar]
- Dieterich M, Brandt T. Functional brain imaging of peripheral and central vestibular disorders. Brain. 2008;131(Pt 10):2538–52. doi: 10.1093/brain/awn042. [DOI] [PubMed] [Google Scholar]
- Dieterich M, et al. Dominance for vestibular cortical function in the non-dominant hemisphere. Cereb Cortex. 2003;13(9):994–1007. doi: 10.1093/cercor/13.9.994. [DOI] [PubMed] [Google Scholar]
- Emri M, et al. Cortical projection of peripheral vestibular signaling. Journal of neurophysiology. 2003;89(5):2639–46. doi: 10.1152/jn.00599.2002. [DOI] [PubMed] [Google Scholar]
- Fasold O, et al. Human vestibular cortex as identified with caloric stimulation in functional magnetic resonance imaging. Neuroimage. 2002;17(3):1384–93. doi: 10.1006/nimg.2002.1241. [DOI] [PubMed] [Google Scholar]
- Friston KJ. Statistical parametric mapping : the analysis of functional brain images. London: Academic; 2007. p. 647. [Google Scholar]
- Furman JM, Kamerer DB. Rotational responses in patients with bilateral caloric reduction. Acta oto-laryngologica. 1989;108(5–6):355–61. doi: 10.3109/00016488909125539. [DOI] [PubMed] [Google Scholar]
- Guldin W, Grusser OJ. The anatomy of the vestibular cortices of primates. Le Cortex vestibulaire. Boulogne: Ipsen; 1996. [Google Scholar]
- Holmes CJ, et al. Enhancement of MR images using registration for signal averaging. J Comput Assist Tomogr. 1998;22(2):324–33. doi: 10.1097/00004728-199803000-00032. [DOI] [PubMed] [Google Scholar]
- Huppert TJ, et al. A temporal comparison of BOLD, ASL, and NIRS hemodynamic responses to motor stimuli in adult humans. Neuroimage. 2006a;29(2):368–82. doi: 10.1016/j.neuroimage.2005.08.065. [DOI] [PMC free article] [PubMed] [Google Scholar]
- Huppert TJ, et al. Quantitative spatial comparison of diffuse optical imaging with blood oxygen level-dependent and arterial spin labeling-based functional magnetic resonance imaging. J Biomed Opt. 2006b;11(6):064018. doi: 10.1117/1.2400910. [DOI] [PMC free article] [PubMed] [Google Scholar]
- Iida M, Haida M, Igarashi M. Vertigo and cerebral hemoglobin changes during unilateral caloric stimulation: a near-infrared spectroscopy study. Annals of the New York Academy of Sciences. 2009;1164:386–9. doi: 10.1111/j.1749-6632.2009.03869.x. [DOI] [PubMed] [Google Scholar]
- Jacobson Gary P, Newman Craig W, Kartush Jack M. Handbook of balance function testing. San Diego, Calif: Singular Pub. Group; 1997. p. xii.p. 439. [Google Scholar]
- Kandori A, et al. Magneto-encephalographic measurement of neural activity during period of vertigo induced by cold caloric stimulation. Neuroscience research. 2003;46(3):281–8. doi: 10.1016/s0168-0102(03)00092-0. [DOI] [PubMed] [Google Scholar]
- Karim H, et al. Functional near-infrared spectroscopy (fNIRS) of brain function during active balancing using a video game system. Gait & posture. 2011 doi: 10.1016/j.gaitpost.2011.10.007. [DOI] [PMC free article] [PubMed] [Google Scholar]
- Karlsen EA, Hassanein RM, Goetzinger CP. The effects of age, sex, hearing loss and water temperature on caloric nystagmus. The Laryngoscope. 1981;91(4):620–7. doi: 10.1288/00005537-198104000-00017. [DOI] [PubMed] [Google Scholar]
- Longridge NS, Leatherdale A. Caloric screening tests. The Journal of otolaryngology. 1980;9(6):478–81. [PubMed] [Google Scholar]
- Mihara M, et al. Role of the prefrontal cortex in human balance control. Neuroimage. 2008;43(2):329–36. doi: 10.1016/j.neuroimage.2008.07.029. [DOI] [PubMed] [Google Scholar]
- Milojevic B. Vestibular caloric testing and cupulometry. Journal of the Iowa Medical Society. 1965;55(5):249–52. [PubMed] [Google Scholar]
- Miyai I, et al. Cortical mapping of gait in humans: a near-infrared spectroscopic topography study. Neuroimage. 2001;14(5):1186–92. doi: 10.1006/nimg.2001.0905. [DOI] [PubMed] [Google Scholar]
- Mulch G, Petermann W. Influence of age on results of vestibular function tests. Review of literature and presentation of caloric test results. The Annals of otology, rhinology & laryngology. Supplement. 1979;88 (2 Pt 2 Suppl 56):1–17. doi: 10.1177/00034894790880s201. [DOI] [PubMed] [Google Scholar]
- Naito Y, et al. Cortical correlates of vestibulo-ocular reflex modulation: a PET study. Brain : a journal of neurology. 2003;126(Pt 7):1562–78. doi: 10.1093/brain/awg165. [DOI] [PubMed] [Google Scholar]
- Nashner LM, Peters JF. Dynamic posturography in the diagnosis and management of dizziness and balance disorders. Neurologic clinics. 1990;8(2):331–49. [PubMed] [Google Scholar]
- Nashner LM, et al. Organization of posture controls: an analysis of sensory and mechanical constraints. Progress in brain research. 1989:411–8. doi: 10.1016/s0079-6123(08)62237-2. discussion 395–7. [DOI] [PubMed] [Google Scholar]
- Perdue KL, Fang Q, Diamond SG. Quantitative assessment of diffuse optical tomography sensitivity to the cerebral cortex using a whole-head probe. Phys Med Biol. 2012;57(10):2857–72. doi: 10.1088/0031-9155/57/10/2857. [DOI] [PMC free article] [PubMed] [Google Scholar]
- Reuter-Lorenz PA, Lustig C. Brain aging: reorganizing discoveries about the aging mind. Curr Opin Neurobiol. 2005;15(2):245–51. doi: 10.1016/j.conb.2005.03.016. [DOI] [PubMed] [Google Scholar]
- Reuter-Lorenz PA, Cappell KA. Neurocognitive Aging and the Compensation Hypothesis. Current Directions in Psychological Science. 2008;17:177–82. [Google Scholar]
- Rosenhall U, Rubin W. Degenerative changes in the human vestibular sensory epithelia. Acta oto-laryngologica. 1975;79(1–2):67–80. doi: 10.3109/00016487509124657. [DOI] [PubMed] [Google Scholar]
- Ross MD, et al. Observations on normal and degenerating human otoconia. The Annals of otology, rhinology, and laryngology. 1976;85(3 pt 1):310–26. doi: 10.1177/000348947608500302. [DOI] [PubMed] [Google Scholar]
- Skurczynski W, Ernst A. Galvanic testing in neuro-otological diagnostics. Acta oto-laryngologica. Supplementum. 1989;468:341–2. doi: 10.3109/00016488909139073. [DOI] [PubMed] [Google Scholar]
- Steinbrink J, et al. Illuminating the BOLD signal: combined fMRI-fNIRS studies. Magn Reson Imaging. 2006;24(4):495–505. doi: 10.1016/j.mri.2005.12.034. [DOI] [PubMed] [Google Scholar]
- Suzuki M, et al. Activities in the frontal cortex and gait performance are modulated by preparation. An fNIRS study’. Neuroimage. 2008;39 (2):600–7. doi: 10.1016/j.neuroimage.2007.08.044. [DOI] [PubMed] [Google Scholar]
- Suzuki M, et al. Cortical and subcortical vestibular response to caloric stimulation detected by functional magnetic resonance imaging. Brain Res Cogn Brain Res. 2001;12(3):441–9. doi: 10.1016/s0926-6410(01)00080-5. [DOI] [PubMed] [Google Scholar]
- Wall C, 3rd, Black FO. Postural stability and rotational tests: their effectiveness for screening dizzy patients. Acta oto-laryngologica. 1983;95(3–4):235–46. doi: 10.3109/00016488309130940. [DOI] [PubMed] [Google Scholar]
- Wall C, 3rd, Furman JM. Eyes open versus eyes closed: effect on human rotational responses. The Annals of otology, rhinology, and laryngology. 1989;98(8 Pt 1):625–9. doi: 10.1177/000348948909800811. [DOI] [PubMed] [Google Scholar]
- Wang L, Jacques SL, Zheng L. MCML--Monte Carlo modeling of light transport in multi-layered tissues. Comput Methods Programs Biomed. 1995;47(2):131–46. doi: 10.1016/0169-2607(95)01640-f. [DOI] [PubMed] [Google Scholar]
- Ye JC, et al. NIRS-SPM: statistical parametric mapping for near-infrared spectroscopy. Neuroimage. 2009;44(2):428–47. doi: 10.1016/j.neuroimage.2008.08.036. [DOI] [PubMed] [Google Scholar]