

Abstract
Nuclear factor- (erythroid-derived 2) like 2 (NFE2L2, NRF2) is a key transcriptional activator of the antioxidant response pathway and is closely related to erythroid transcription factor NFE2. Under oxidative stress, NRF2 heterodimerizes with small Maf proteins and binds cis-acting enhancer sequences found near oxidative stress response genes. Using the dietary isothiocyanate sulforaphane (SFN) to activate NRF2, chromatin immunoprecipitation sequencing (ChIP-seq) identified several hundred novel NRF2-mediated targets beyond its role in oxidative stress. Activated NRF2 bound the antioxidant response element (ARE) in promoters of several known and novel target genes involved in iron homeostasis and heme metabolism, including known targets FTL and FTH1, as well as novel binding in the globin locus control region. Five novel NRF2 target genes were chosen for followup: AMBP, ABCB6, FECH, HRG-1 (SLC48A1), and TBXAS1. SFN-induced gene expression in erythroid K562 and lymphoid cells were compared for each target gene. NRF2 silencing showed reduced expression in lymphoid, lung, and hepatic cells. Furthermore, stable knockdown of NRF2 negative regulator KEAP1 in K562 cells resulted in increased NQO1, AMBP, and TBXAS1 expression. NFE2 binding sites in K562 cells revealed similar binding profiles as lymphoid NRF2 sites in all potential NRF2 candidates supporting a role for NRF2 in heme metabolism and erythropoiesis.
1. Introduction
NRF2 (encoded by nuclear factor-erythroid p45-related factor 2, NFE2L2) is the master regulator of antioxidant and phase II detoxification genes that collectively resist cellular damage due to electrophilic and oxidative stress [1, 2]. Oxidative stress can be caused by an imbalance between the production of reactive oxygen and the system's ability to detoxify reactive intermediates or repair any damage. Under nonstressed conditions, NRF2, a member of the cap“n”collar family of basic leucine zipper transcription factors, is repressed in the cytosol by Kelch-like ECH-associated protein 1 (KEAP1) [3–6]. In the event of oxidative stress or other stimuli, NRF2 dissociates from KEAP1, translocates into the nucleus, forms heterodimers with small Maf and other bZIP proteins, and binds the NRF2 antioxidant response element (ARE; TGActcaGC) in promoter regions of downstream detoxifying enzymes. Known examples of NRF2 gene targets include hemeoxygenase-1 (HMOX1), NAD(P)H: quinone oxidoreductase-1 (NQO1), glutamate-cysteine ligase (GCL), and glutathione S-transferase (GST) [7–10]. Several studies have indicated that NRF2 potentially regulates genes in other pathways such as protein transport, phosphorylation, cell cycle, and growth [11–15]. In addition, chromatin immunoprecipitation (ChIP) deep sequencing of DNA (ChIP-seq) performed in mouse embryonic fibroblasts [16] and human lymphoblastoid cells [17] revealed several hundred novel NRF2-mediated genes that are involved in cellular processes other than oxidative stress such as adipogenesis [17]. In our study, NRF2 was activated in lymphoblastoid cell lines with sulforaphane treatment, a dietary isothiocyanate that acts as a phase II enzyme inducer through the NRF2 pathway [12]. We identified 849 NRF2 occupied peaks, 242 of which were considered high confidence with 96% of those containing one or more AREs [17]. Putative and novel NRF2-regulated genes were characterized by integrating bioinformatics, expression microarray, additional independent ChIP real-time quantitative polymerase chain reaction (qPCR), and NRF2 short interfering RNA (siRNA) silencing in multiple cell lines for selection of potential candidates for followup. Pathway analysis revealed genes involved in apoptosis, immune response, retinoid signaling, heme metabolism, and iron homeostatis. The potential role of NRF2 in heme metabolism and iron homeostatis was intriguing since NRF2 is structurally related to nuclear factor-erythroid derived 2 (NFE2), a transcription factor that is essential for erythroid differentiation and is specifically expressed in hematopoietic progenitors and lineages [18]. NFE2 dimerization partners overlap with NRF2 such as small Maf proteins, and NFE2 and NRF2 bind the same AP1-like core motif consensus sequence [17, 19]. In addition, we reported previously [17] that 112 of 242 (~46%) high confidence peaks colocated with ENCODE erythroleukemic cell line K562 NFE2 bound regions, [20] further supporting a possible role of NRF2 in heme metabolism and erythropoiesis.
Mature erythrocytes or red blood cells (RBCs) are packed with hemoglobin (Hb) which transport oxygen from the lungs to peripheral cells and tissues. Made of four subunits as a tetramer, adult Hb consists of two alpha-globin and two beta-globin chains, each chain consisting of an iron-containing heme group that can bind one oxygen molecule [21–23]. During RBC hemolysis in both normal and disease conditions, Hb can escape resulting in free heme and iron [24, 25]. Excess heme and iron have the ability to damage lipids, proteins, and DNA through oxidation and the production of reactive oxygen species (ROS) which can create a positive hemolytic feedback loop [23]. In addition to the well-studied NRF2 target gene HMOX1, which plays a large role in the heme degradation pathway, several known NRF2-regulated genes are involved in iron homeostasis, such as ferritin (FTH1 and FTL). In our ChIP-seq study and in the ENCODE ChIP database, the promoter regions of these genes showed high confidence NRF2-bound peaks with NFE2 peak overlap in K562 cells [17, 26, 27]. Moreover, we saw novel NRF2/NFE2 colocated binding site occupation in the globin locus control region near the β-locus for epsilon globin (HBE1) and gamma globin (HBG) indicating that NRF2 may be involved in erythroid differentiation (Figure 2(b)).
Figure 2.
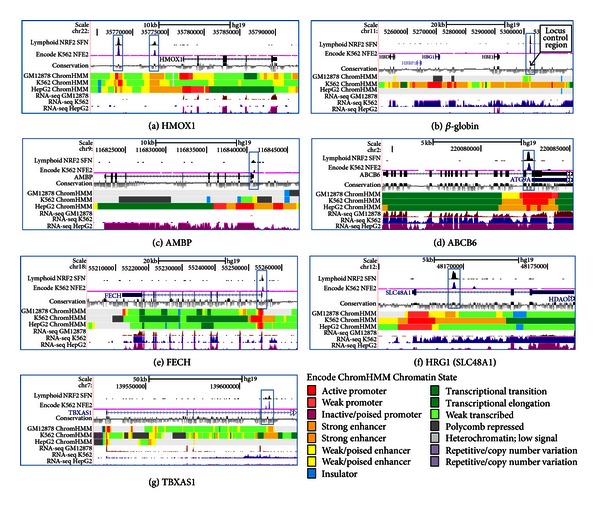
SFN-induced lymphoblastoid NRF2 ChIP-seq, ENCODE chromatin state annotation (ChromHMM), conservation, and ENCODE K562 NFE2 ChIP-seq tracks of NRF2-regulated known and novel target genes. ChromHMM legend shows 15 chromatin state annotations representing the relationship between chromatin state, function, and gene expression. Blue boxes display NRF2, NFE2, and conservation peaks. (a) Known NRF2-regulated HMOX1. (b–g) Novel NRF2-bound peak regions colocated with highly conserved ARE sequences and NFE2 ChIP-seq peaks in the (b) β-globin locus, (c) AMBP, (d) ABCB6, (e) FECH, (f) HRG1 (SLC48A1), and (g) TBXAS1 genes.
In order to further assess the relationship between NRF2 and NFE2 in erythroid cells, we selected five novel NRF2 candidate target genes identified by overlap between NRF2 ChIP-seq in lymphoid cells and NFE2 ChIP-seq in K562 cells. These genes are known to be involved in heme metabolism and iron homeostasis, and we evaluated their protein and expression levels under a variety of conditions. Candidate NRF2 target genes included α 1-microglobulin/bikunin precursor (AMBP), ATP-binding cassette (ABC) transporter 6 (ABCB6), ferrochelatase (FECH), solute carrier family 48, member 1 (SLC48A1) more commonly known in the literature as heme responsive gene 1 (HRG1), and thromboxane A synthase (TBXAS1). Using our SFN-induced NRF2 ChIP-seq results, we compared ENCODE NFE2 binding peaks, chromatin state (ChromHMM), RNA-seq data, and conservation tracks in order to assess each potential NRF2-regulated candidate. In addition, we activated NRF2 by sulforaphane treatment in K562 cells and compared candidate gene expression in cells of lymphoid or erythroid origin treated with SFN or with NRF2/KEAP1 gene silencing. Candidate genes were also assessed by protein analysis in K562 SFN treated cells as well as in two different stable KEAP1-silenced cell lines.
2. Materials and Methods
2.1. Cell Culture
Human lymphoblastoid cells (LCLs; Coriell) were grown in RPMI with 15% fetal bovine serum (FBS; Gemini) and 1X antibiotics/antimycotics (Life Technologies) in 5% CO2 at 37°C. Following ATCC recommendations, airway epithelial BEAS-2B (ATCC CRL-9609) and erythroleukemic K562 (ATCC CCL-243) cells were cultured in 10% FBS with 1X antibiotics/antimycotics. HepG2 cells (ATCC HB-8065) were grown in MEM plus 10% FBS, 2.5 mM L-glutamine (Life Technologies), and 1X antibiotics/antimycotics, and A549 cells (ATCC CCL-185) were cultured in Ham's F12K supplemented with 10% FBS and 1X antibiotics/antimycotics. Cells were treated with 0.1% DMSO or 10 μM sulforaphane (SFN) for either 8 (NRF2 siRNA experiments) or 24 hours at 37°C before isolating RNA.
2.2. Chromatin Immunoprecipitation (ChIP) and ChIP-Seq
ChIP, sequencing results, and data analysis were previously described [17].
2.3. Real-Time Quantitative Polymerase Chain Reaction (qPCR)
RNA was isolated from cells using Qiagen's RNeasy kit per manufacturer's instructions including the on-column DNA digestion step. Quantification of RNA via Qubit (Invitrogen) was followed by cDNA synthesis using the SuperScript First-Strand Synthesis System (Invitrogen). Target amplification was performed in at least triplicate using Applied Biosystems (ABI) primer/probe mixes or custom designed SYBR primers and Universal PCR Master Mix (ABI). Initial fluorescence (Ro value) was calculated using a method of Peirson et al. [28]. Several primers have been previously described [17]. In addition, TaqMan gene expression assays were used for HRG1 (SLC48A1; Hs00215236), BACT (Hs99999903), and 18S (Hs99999901). Custom exon junction spanning SYBR primers were designed forβ-globin (Fwd5′-GGTGGTCTACCCTTGGACCC-3′, Rev5′-GATACTTGTGGGCCAGGGCA-3′), NFE2 specific primers (Fwd5′-CAGAGCAGGAACAGGGTGAT-3′, Rev5′-TGGAGGTCCAAGGTATGGAG-3′), and TBXAS1 (Fwd5′-CTCCTCTACTGGGTGCAAGC-3′, Rev5′-ATAGCCAGCGATGAGGAAGA-3′). All measurements were reported as target values normalized to BACT or 18S as average values ± standard error of the mean.
2.4. NRF2 Gene Silencing (NRF2KD)
NRF2 was silenced transiently in BEAS-2B, HepG2, and A549 cells with a reverse transfection protocol using Ambion siRNAs. Nonspecific scramble control (control; AM4643) and three NRF2 siRNA (ID no. 115764) were tested for NRF2 knockdown by transient transfection using Xtreme Gene (Roche) for BEAS-2B or Lipofectamine 2000 (Invitrogen) reagent for HepG2 and A549 cells following manufacturer's instructions as previously described [17]; ID no. 115764 silencing was most effective and used for further analysis.
2.5. shRNA KEAP1 Knockdown (KEAP1KD)
Mission shRNA lentiviral particles (Sigma) were used to stably silence KEAP1 (SHVRS-NM_012289) in K562 cells following the manufacturer's protocol. Briefly, K562 cells (105 cells/well) were plated in six-well plates the day before transduction. Cells were transduced with either five different shRNA clones targeting KEAP1 or a scrambled non-target control (Scr, SHC002V) in several multiplicity of infections (MOI) to get maximum transduction efficiency in the presence of hexadimethrine bromide (8 μg/mL) and incubated overnight. Cells containing viral-particles were replaced with fresh complete media the next day and allowed to grow overnight. To select the shRNAi transduced cells, media were removed and replaced with complete media containing 2 μg/mL puromycin (Invitrogen). Puromycin-resistant cells containing transduced clones were grown for several passages and tested for KEAP1 expression by qPCR to determine maximum silencing efficiency (data not shown). The most effective clone (C1) was then selected and maintained in complete media supplemented with puromycin to perform downstream qPCR experiments.
2.6. Western Blot
K562 cells were grown in 150 mm dishes and treated with 0.1% DMSO or 10 μM SFN for 5 hours. In addition, K562 shRNA KEAP1-silenced cells from two different clones (C1 and C2) as well as the non-target shRNA control (Control) were grown and collected for protein. Total protein was isolated by incubating cell pellets in RIPA buffer (Thermo Scientific) with 1X protease inhibitors (Roche) for 2 hours on ice, spun at 13,000 rpm (4°C, 30 min), and the protein extracts were quantified by Bradford assay (Bio-Rad). We electrophoresed 30 μg of total protein along with several protein marker ladders (Thermo Scientific) on a 4%–20% gradient Mini-PROTEAN TGX Precast Gel (Bio-Rad) and then transferred onto a 0.45 μM nitrocellulose Hybond-C membrane (GE Healthcare). The membrane was blocked with 5% milk and 1X TBST (Sigma; 2 hours, 4°C) and then probed with either 1 : 200 anti-NQO1 mouse monoclonal (Santa Cruz Biotechnologies, sc-16464), 1 : 200 anti-ABCB6 mouse monoclonal (Santa Cruz, sc-365930), 1 : 200 anti-Ferrochelatase mouse monoclonal (Santa Cruz, sc-377277), 1 : 200 anti-SLC48A1 rabbit polyclonal (Santa Cruz, sc-101957), or 1 : 5000 anti-βactin mouse monoclonal (Sigma-Aldrich, A5316), in 5% milk in TBST (overnight, 4°C). After washing, secondary antibody incubations occurred with HRP-conjugated anti-rabbit, anti-mouse, or anti-goat (1 : 2500; Bio-Rad, 170–5046 and 170–5047; Santa Cruz sc-2020, respectively) in TBST with 5% milk (1 hour, room temp). After the final washes, membrane was incubated for one minute in ECL solution (GE Healthcare) and exposed to film. All membranes were incubated with β-actin as a loading control.
3. Results
3.1. SFN Induces NRF2 but not NFE2 in Erythroid Cells
In order to establish whether NRF2 mRNA was inducible by SFN in erythroid cells, K562 and lymphoid GM12878 cells were treated with 10 μM SFN for 24 hours, total RNA was extracted, and qPCR was carried out to measure NRF2, the NRF2 target gene NQO1, and NFE2. Figure 1(a) shows that NRF2 expression was induced by treatment in both lines, and NQO1 displayed significant 6-fold (K562) and 8.3-fold (GM12878) increases over the respective untreated control (Figure 1(b)). Interestingly, we saw no SFN-induced NFE2 expression changes in K562 cells and, as expected, little to no NFE2 expression in lymphoid cells (Figure 1(c)). NFE2 is known to be exclusively expressed in hematopoietic progenitors and lineages [18]. Although SFN did not induce NFE2 expression in undifferentiated K562 cells, studies have used dimethyl sulfoxide (DMSO) in murine erythroleukemia (MEL) cells to significantly increase NF-E2 activity which resulted in erythroid differentiation [29]. Testing SFN or other NRF2 inducers in differentiated erythroid cells would provide additional insight into the inducibility of NFE2.
Figure 1.
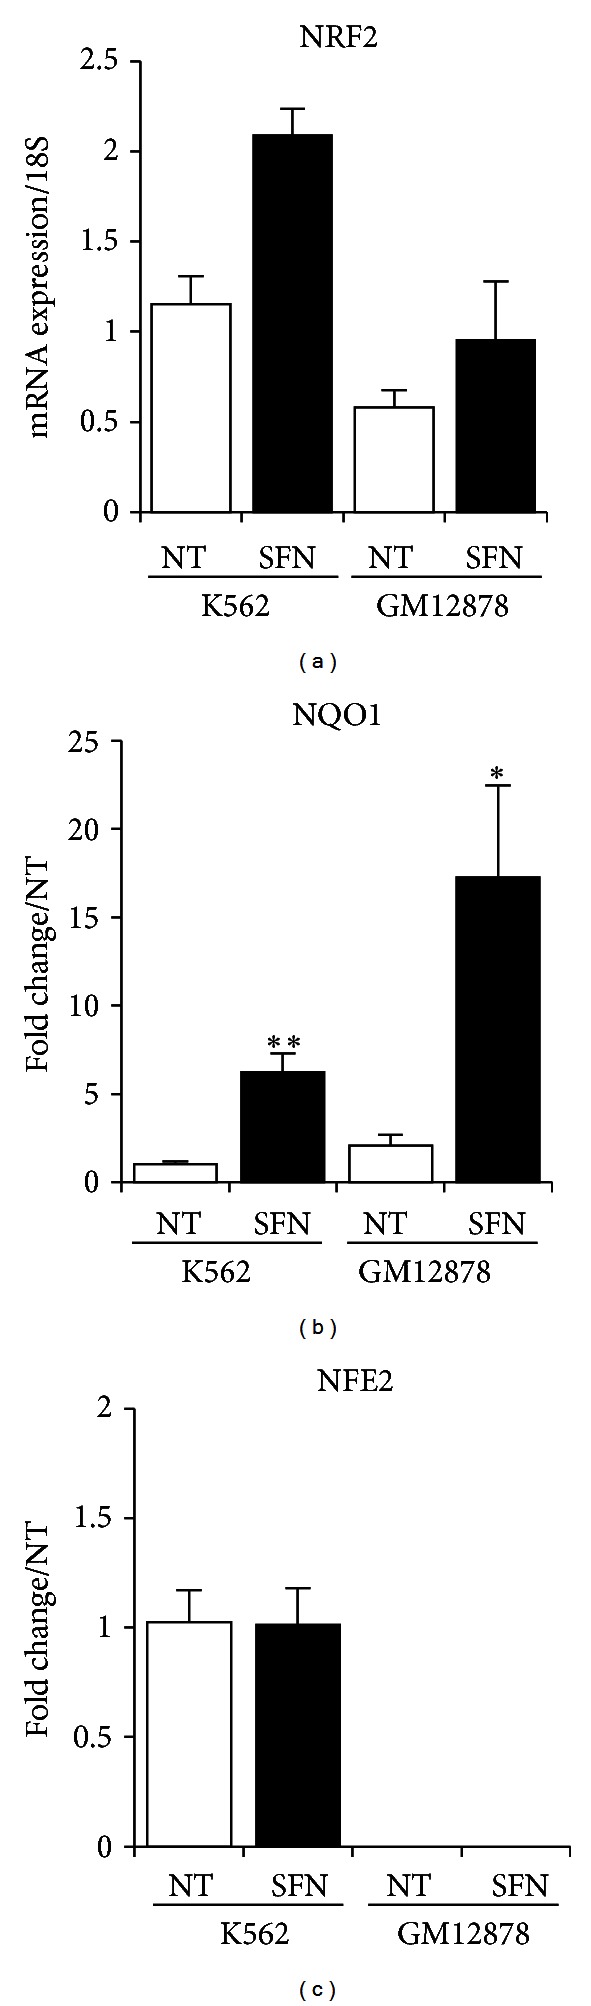
NRF2, NQO1, and NFE2 gene expression in K562 and lymphoid GM121878 cells. (a) NRF2 mRNA from K562 and GM12878 cells treated for 24 hours with 10 μM SFN increased compared to control. (b) Known NRF2-regulated gene NQO1 expression significantly increased in both K562 and GM12878 SFN-treated cells. (c) NFE2-specific gene expression indicated that NFE2 was specific to erythroleukemic K562 cells but not inducible upon SFN treatment. Values were normalized to 18S, and fold change (FC) over nontreated (NT) cells was calculated for (b) and (c). Bars display the average of 3 independent experiments ± SEM; *P < 0.05, **P < 0.01.
3.2. Lymphoid NRF2 ChIP-seq Peak Regions Colocate with ENCODE K562 NFE2 ChIP-seq Peaks
We examined SFN-induced NRF2 binding locations in the HMOX1 gene using our lymphoid NRF2 ChIP-seq and ENCODE data tracks displayed in UCSC genome browser (Figure 2(a)). In addition to SFN-induced lymphoid NRF2 and untreated K562 NFE2 ChIP-seq tracks, we display ENCODE/Broad tracks showing chromatin state segmentation using the Hidden Markov Model (ChromHMM), RNA-seq profiles, as well as an evolutionary conservation track using the Genomic Evolutionary Rate Profile (GERP) [30] (Figure 2). ChromHMM profiles for GM12878 (lymphoid), K562 (erythroid), and HepG2 (hepatic) are based on the 15 chromatin state annotations determined by multiple histone ChIP-seq experiments and indicate the relationship between chromatin state, DNA function (e.g., active promoter, enhancer, repressed), and gene expression [27]. All three cells lines displayed open active promoters (red), strong enhancers (orange) under the 5′ distal binding peak, a strong enhancer at the more proximal peak, and active transcription (green/lt green) in the gene body. The HMOX1 genomic region revealed two occupied sites with colocated ChIP-seq peaks (blue boxes) for lymphoid NRF2 and erythroid NFE2, strongly suggesting that these related transcription factors share identical binding sites and binding motifs (Figure 2(a)). In addition, the conservation track showed strong conservation and the response element displays perfect human/rodent homology. RNA-seq tracks indicated slightly more expression in HepG2 cells as reflected by the transcription association state (green) compared to the weak transcription (light green) seen in both the ChromHHM GM12878 and K562 track. Display of the lymphoid NRF2 occupancy and ENCODE tracks allowed a comprehensive visual assessment of known and novel NRF2-occupied regions.
3.3. NRF2 Binds the Globin Locus
It has been well established that NFE2 is essential in regulating the beta-globin (β-globin) locus control region resulting in activation of β-globin gene expression and erythroid differentiation [18, 31, 32]. In erythroleukemic NFE2-null CB3 cells, erythroid differentiation results in low adult globin gene expression [33]. Additionally, a majority of p45 NFE2 knockout mice die from hemorrhage with surviving adults displaying a mild anemia, including lower hemoglobin levels [18, 34] and sensitivity to oxidative stress [35]. Interestingly, Nrf2-deficient mice from various backgrounds also display a hemolytic anemia phenotype [9, 36]. We observed binding of NRF2 in the highly conserved globin locus control region in lymphoblast cells, a novel finding (Figure 2(b)). SFN-induced NRF2 occupancy in lymphoid cells and NFE2 in K562 cells were colocated (blue box) in a region adjacent to fetal (HBG1) and embryonic (HBE1) globin. Among lymphoid, erythroid, and hepatic cells, vast differences were seen in chromatin states and RNA-seq expression. Specifically, GM12878 and HepG2 cells were completely devoid of expression and displayed repressive heterochromatin (grey) and insulator (CTCF, blue) regions while the K562 ChromHMM track indicated enhancers (orange) with some active promoter (red) and poised (yellow) enhancer regions. High occupancy of this globin control region enhancer by NRF2 in lymphoid cells that did not express NFE2 suggested a possible role for NRF2 in erythroid cells. NRF2 activation and inducible binding has been suggested as a mechanism to increase expression of fetal γ-globin genes [37], and therefore NRF2 is being assessed as a potential therapeutic target for modifying sickle cell disease, in which the adult β-globin protein is mutant and undergoes hemolysis [37, 38].
3.4. Validation Methods for Candidate Genes
Based on our previous lymphoid NRF2 ChIP-seq data [17], five potential NRF2-regulated genes involved in heme metabolism and iron homeostasis were selected and evaluated in erythroid K562 cells. In order to determine the impact of NRF2 binding in these novel hematopoietic genes, NRF2's cytosolic repressor KEAP1 was stably silenced in K562 cells using shRNA (see Section 2). Inhibiting expression of NRF2's repressor increases the amount of NRF2 available to translocate into the nucleus and increase induction of downstream targets. Figure 3(a) displayed KEAP1 gene expression levels in vehicle control and in KEAP1 knockdown (KEAP1KD) K562 cells. We effectively silenced KEAP1 expression 82.7% compared to control K562 cells in three independent experiments. In order to determine the impact of silencing KEAP1 in erythroid cells, we ran qPCR, as well as western blot, for the NRF2-mediated gene NQO1. Figure 3(b) indicated that NQO1 expression in K562 KEAP1KD cells increased 3.2-fold over control. In addition, Figure 3(c) western analysis of K562 KEAP1 silencing revealed an increase in NQO1 protein from two different KEAP1-silenced clone cells lines indicating that NRF2 downstream gene targets were induced in KEAP1-silenced cells allowing us to examine NRF2-mediated regulation of hematopoietic gene targets in erythroid cells.
Figure 3.
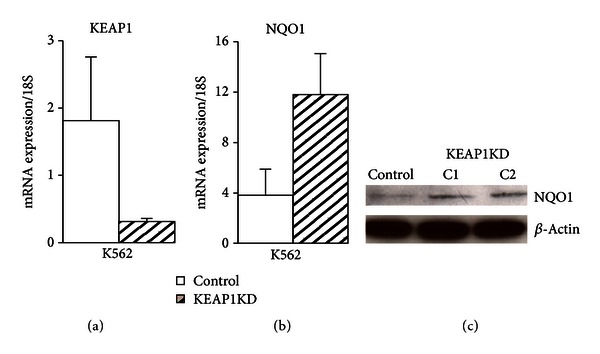
Stable silencing of KEAP1 (KEAP1KD) in K562 cells. (a) KEAP1KD cells showed an 82.7% decrease in KEAP1 gene expression compared to scrambled control. (b) Basal levels of NRF2-mediated target NQO1 increased 3.2-fold in KEAP1KD cells. Values were normalized to 18S and bars represent an average of 3 independent experiments ± SEM. (c) Total protein from KEAP1KD C1 and C2 cells showed an increase in NQO1 compared to control. A NQO1 band at 31 kDA was confirmed by protein ladders, and the membrane was reprobed with β-actin as a loading control.
3.5. AMBP
AMBP is a gene that encodes two different proteins, α 1-microglobulin (A1M) and bikunin upon peptide cleavage in hepatocytes, which are then secreted into the plasma [39, 40]. A1M is a 26 kDA glycoprotein belonging to the Lipocalin family with immunoregulatory characteristics and is involved in heme catabolism [41]. Bikunin is a Kunitz-type serine protease inhibitor of the inter-α-inhibitor family and a structural component of the extracellular matrix [23, 42]. A1M acts as a reductase and radical scavenger, binding heme in plasma, extravascular fluids, and cells protecting the cell from oxidative damage caused by hemoglobin and heme. [23, 43, 44]. In K562 cells, it has been shown to prevent intracellular oxidation and the upregulation of HMOX1 induced by heme, hydrogen peroxide, and hydroxyl radicals [23]. Figure 2(c) displays colocating peaks in SFN-treated lymphoid and K562 cells for NRF2 and NFE2, respectively (blue box). It was interesting that NRF2 and NFE2 displayed occupancy in the AMBP promoter despite the presence of repressive chromatin (grey) and insulator (blue) regions in ChromHMM profiles for lymphoid and erythroid cells. In contrast, HepG2 chromatin indicated open active promoters (red), enhancers (orange), and active transcription (green) which was supported by the RNA-seq data for this region of the AMBP gene. In order to confirm that NRF2 was regulating AMBP gene transcription, we transiently silenced NRF2 in airway (BEAS-2B and A549) and liver (HepG2) cell lines. These lines are common in vitro models used to examine cellular response to oxidative stress exposure. The level of SFN-treated, NRF2-silenced (NRF2KD) AMBP mRNA was significantly reduced when compared to the SFN-treated control by 78.6% (BEAS-2B), 33.9% (A549), and 74.9% (HepG2), indicating that AMBP transcription was regulated by NRF2 (Figure 4(a)). Next we compared AMBP gene expression in untreated and SFN-treated K562 and lymphoblastoid GM12878 cell lines. K562 cells showed a modest 2-fold AMBP induction compared to the 56-fold increase over no treatment in GM12878 cells, indicating that SFN was a stronger inducer of AMBP in lymphoid cells (Figure 4(b)). Additionally, we created stable silencing of NRF2's cytosolic repressor KEAP1 in erythroid K562 cells and assessed them for AMBP inducibility. A 2.75-fold increase over control indicated NRF2 may be binding and affecting the regulation of AMBP (Figure 4(c)). Other findings [23] suggest that AMBP may be an antioxidant that binds and degrades heme in erythroid lines, and the present study suggests that this function may be under the regulation of NRF2.
Figure 4.
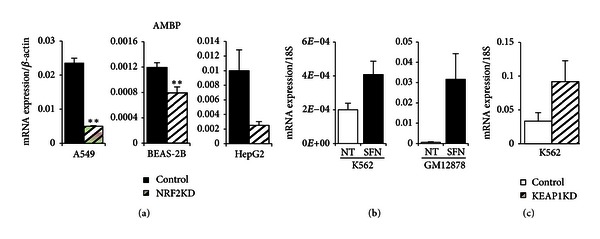
AMBP mRNA gene expression in NRF2KD, K562, GM12878, and K562 KEAP1KD cell lines. (a) NRF2 silencing in A549, BEAS-2B, and HepG2 cells treated for 8 hours with 10 μM SFN showed significant decrease in AMBP expression suggesting regulation by NRF2. (b) AMBP expression levels increased in K562 and lymphoid GM12878 cells treated with 10 μM SFN for 24 hours. (c) Basal levels of AMBP increased in K562 KEAP1KD cells indicating NRF2 regulation of AMBP. Gene expression values were normalized to BACT or 18S. Bars represent an average of 3–6 independent experiments ± SEM; *P < 0.05, **P < 0.01.
3.6. ABCB6
Lymphoid NRF2 binding was seen in ABCB6, a putative NRF2 target gene first identified in microarray analysis of human small airway epithelium cells from healthy smokers [45]. ABCB6 is a porphyrin transporter located at the outer mitochondrial membrane in RBCs and has been suggested to translocate CPgenIII from the cytoplasm to the mitochondria, an important step in the sixth enzymatic reaction in the heme biosynthesis pathway [46]. It is highly expressed during erythroid differentiation and controls the translocation of heme and heme precursors between the cytoplasm and mitochondria [25, 44]. The ABCB6 gene has also been shown to encode the Lan blood group antigen which causes severe hemolytic transfusion reactions [47]. In K562 cells, exogenous expression of ABCB6 resulted in cell surface detection of Lan antigen [46, 48]. It has recently been located not only on the plasma membrane on RBCs but also at the plasma membrane of HepG2 hepatocellular carcinoma (HCC) cells which may play a role in drug resistance in HCC and other cancer cells [47]. NRF2 occupancy was colocated with NFE2 peaks (Figure 2(d), blue box) in the ABCB6 gene with almost perfect human to mouse homology of the ARE sequence. ChromHHM tracks under the peaks displayed active open promoters (red) and active transcription (green), as supported by RNA-seq data, in lymphoid GM12878, erythroid K562, and hepatic HepG2 cell lines. In NRF2-silenced BEAS-2B, A549, and HepG2 cells, SFN-induced ABCB6 expression was significantly reduced by 68.2%, 68.1%, and 71.7% of control mRNA (Figure 5(a)). Comparing ABCB6 expression in K562 and GM12878 cells treated with SFN for 24 hours showed no SFN-induced changes in K562 cells and a 5.8-fold increase over control in GM12878 cells (Figure 5(b)). Interestingly, five-hour SFN treatment of K562 cells increased ABCB6 protein compared to untreated cells. Silencing KEAP1 in K562 cells did not have a significant effect on ABCB6 mRNA expression, although K562 cells had a very high baseline expression level in untreated and non-target shRNA conditions (Figures 5(b) and 5(c)).
Figure 5.
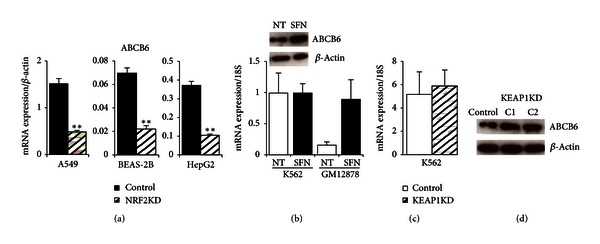
Gene expression and protein analysis of ABCB6 in NRF2KD, K562, GM12878, and K562 KEAP1KD cells. (a) Significant ABCB6 decrease in NRF2-silenced A549, BEAS-2B, and HepG2 cells treated for 8 hours with 10 μM SFN. (b) ABCB6 was not induced by 24 hours of 10 μM SFN treatment in K562 cells but responded to chemical treatment in lymphoid GM12878 cells. Protein levels of ABCB6 show an increase after treatment of K562 cells with 10 μM SFN for 5 hours compared to respective controls. (c) Similar to (b), high baseline levels of ABCB6 mRNA did not change significantly in K562 KEAP1KD cells. Gene expression values were normalized to BACT or 18S. Bars represent an average of 3–6 independent experiments ± SEM; *P < 0.05, **P < 0.01. (d) KEAP1KD C1 and C2 total protein show increased levels of ABCB6. Protein markers confirmed an ABCB6 band at 79 kDA, and the membrane was reprobed with β-actin as a loading control.
Examining ABCB6 protein levels in K562 KEAP1KD from two different silenced cell lines and their respective controls, we observed that both C1 and C2 clones showed an increase in ABCB6 compared to the control (Figure 5(d)). Thus, ABCB6 responded to SFN treatment, and ABCB6 protein appears higher in the KEAP1KD cells. In summary, NRF2 may be regulating ABCB6 in lymphoid cells as well as in erythroid cells. Using a different model system, such as primary differentiating hematopoietic cells, would present an additional method to examine the impact of NRF2 binding in the ABCB6 gene.
3.7. FECH
Ferrochelatase (FECH) is an enzyme localized in the mitochondria where it is responsible for the last step of heme biosynthesis, catalyzing the insertion of the ferrous form of iron to protoporphyrin IX [25, 49]. It was proposed that FECH interacts with mitoferrin-1 (MFRN1), a mitochondrial iron uptake protein that is upregulated during erythroid differentiation [50]. In addition, recent studies suggested that FECH forms a macromolecular complex with MFRN1 and ABCB10 during erythroid differentiation [50–52]. FECH gene expression level has been associated with erythropoietic protoporphyria (EPP) in humans [53]. In human trials following dietary ingestion of SFN, NRF2-mediated genes such as NQO1 and HMOX1 displayed induced gene expression (200%–300% increase in epithelial tissues) [54]. Therefore, it was of interest to further examine FECH as an NRF2 regulated gene. NRF2 and NFE2 ChIP-seq peaks colocated (blue box) in the conserved ARE consensus sequence of the FECH gene (Figure 2(e)). Chromatin status indicated open promoters (red) with relatively weak transcription (lt. green) in GM12878 and HepG2 compared to stronger transcription levels (green) of FECH in the K562 cells. FECH mRNA levels were relatively low in A549 and BEAS-2B cells (Figure 6(a)). However, FECH mRNA expression was ~100-fold higher in HepG2 cells compared with A549 or BEAS-2B cells, and it was induced 3-fold by SFN in LCLs (Figure 6(b)). NRF2 silencing reduced SFN-induced levels of FECH expression significantly by 42.2% (A549), 29.3% (BEAS-2B) and 61.9% (HepG2) compared to cell line specific controls (Figure 6(a)). However, FECH expression in K562 cells did not change with SFN treatment (either at mRNA or protein level) but increased 3.1-fold in lymphoid cells (Figure 6(b)). The very high baseline level of FECH expression in K562 may preclude inducibility, even if NRF2 is upregulated as in K562 KEAP1KD cells (Figure 6(c)). FECH protein levels did not change in the K562 KEAP1KD clones (Figure 6(d)). Previously, studies have shown that FECH is highly upregulated during erythroid differentiation [50] and in hemin-stimulated differentiating K562 cells [55]. A model system that examined NRF2 mediation of FECH expression under differentiation conditions may allow further insight into this relationship.
Figure 6.
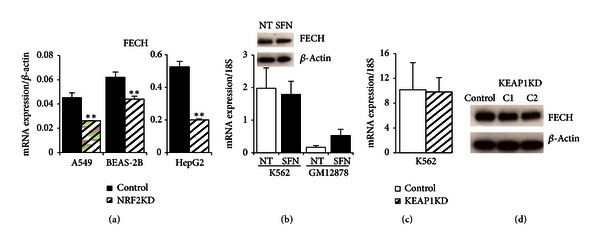
NRF2-silenced cell lines, erythroid, lymphoid, and KEAP1-silenced protein and mRNA expression of FECH. (a) FECH was significantly decreased in SFN-induced NRF2-silenced mRNA from airway and hepatic cell lines. (b) K562 cells did not respond to chemical treatment at mRNA (10 μM SFN, 24 hours) or protein level (5 hours with 10 μM SFN), unlike the SFN-mediated increase of FECH in lymphoid GM12878 cells. (c) K562 KEAP1KD FECH mRNA was unchanged compared to control. Gene expression values were normalized to BACT or 18S. Bars represent an average of 3–6 independent experiments ± SEM; *P < 0.05, **P < 0.01. (d) FECH protein did not increase in K562 KEAP1-silenced cells. Protein markers confirmed FECH monomers at ~40 kDA, and the membrane was reprobed with β-actin as a loading control.
3.8. HRG1 (SLC48A1)
Initially discovered in C. elegans, heme responsive gene 1 (HRG1) was the first heme importer identified and is the only member of the solute carrier 48 (SLC48) family [48, 49, 56]. Located in the plasma and lysosomal membrane, HRG1 transports heme from the lysosome into the cytoplasm and is essential for normal development [25]. In addition, knockdown of HRG1 in zebrafish resulted in severe anemia and hydrocephaly [48]. As with the other genes we examined, NRF2 and NFE2 co-occupied the same HRG1 genomic region (blue box) in lymphoblastoid and K562 cells suggesting that they may have an overlapping regulatory role in the expression of HRG1 (Figure 2(f)). Comparisons of ChromHMM and RNA-seq tracks for the three cell lines indicate that HRG1 was highly expressed in K562 cells and shows an active promoter (red), strong enhancer (orange), and transcriptional elongation (green) chromatin states (Figure 2(f)). Unlike K562 cells, expression of HRG1 in GM12878 was very low, and this was consistent with observed ChromHMM states of weak promoters (light red), weak poised enhancers (yellow), and a large insulator region (blue; Figure 2(f)). The expression of HRG1 was reduced in all three cell lines in which NRF2 was silenced transiently but was most strongly reduced in HepG2 (52.5%) suggesting cell-type specific regulation of HRG1 by NRF2 (Figure 7(a)). Upregulation of mRNA expression of HRG1 was observed both in response to SFN treatment (6.5-fold induction) and genetic activation in K562 (1.8-fold induction) (Figures 7(b) and 7(c)). Protein levels for HRG1 showed small increases for both chemical and genetic NRF2 activations (Figures 7(b) and 7(d)).
Figure 7.
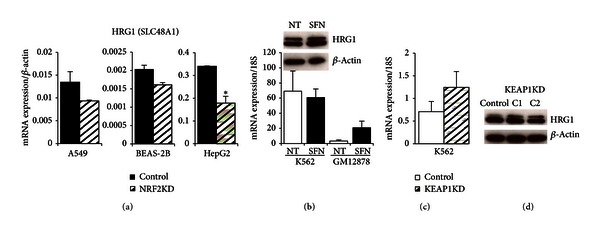
HRG1 (SLC48A1) gene expression and protein analysis in NRF2KD, K562, GM12878, and K562 KEAP1KD cells. (a) Transient silencing of NRF2 in three cell lines (A549, BEAS-2B, and HepG2) reduced expression of HRG1. Most significant HRG1 reduction was observed in HepG2 followed by A549. (b) Chemical activation of NRF2 using SFN (10 μM, 24 hours) induced HRG1 expression in GM12878, but high HRG1 baseline levels remained unchanged in SFN-induced K562 cells. K562 cells treated with 5 hours of 10 μM SFN showed an increase in HRG1 protein indicating a response to chemical activation at the shorter timepoint. (c) Genetic activation of NRF2 by stably silencing its negative regulator KEAP1 induced HRG1 in K562 cells at mRNA and protein level. (d) Two different shRNA clones showed an increase in HRG1 as compared to non-target shRNA control. mRNA values were normalized to BACT or 18S. Bars represent an average of 3–6 independent experiments ± SEM; *P < 0.05, **P < 0.01. A 30 kDA HRG1 band was confirmed by protein markers, and the membrane was stripped and reprobed with β-actin as a loading control.
3.9. TBXAS1
TBXAS1 (cytochrome P450, family 5, subfamily A, Cyp5A1) is considered a member of the cytochrome P450 enzyme family based on sequence homology but is functionally very different from this group of monooxygenases and quite different from the other candidate genes. TBXAS1 resides in the endoplasmic reticulum membrane and functions as a catalyzer for the conversion of prostaglandin H2 to thromboxane A2, which is a potent vasoconstrictor, bronchoconstrictor, and inducer of platelet aggregation [57, 58]. In addition to its role in several pathophysiological processes including hemostasis, recent research suggested a role for TBXAS1 in several cancers as well as preeclampsia [59–61]. Because of its biological significance and its occupancy by NRF2 in lymphoblastoid cell lines, we further explored NRF2-dependent expression. Occupied binding sites were seen in NRF2 and NFE2 ChIP-seq experiments in GM12878 and K562 cells, respectively, indicating potential regulation by these transcription factors (Figure 2(g), blue box). Large differences in ChromHMM tracks were seen among the three cell lines reflecting the RNA-seq expression patterns shown (Figure 2(g)). HepG2 cells showed a repressed state while GM12878 and K562 cells showed strong enhancers (orange) under NRF2 and NFE2 binding sites. K562 cells, however, showed increased transcription (green) compared to lt green (weak transcription) and grey (repression) states in GM12878 cells resulting in higher expression of the TBXAS1 gene in K562 cells. Unlike the expression pattern of HRG1, both chemical and genetic activations of NRF2 led to the upregulation of TBXAS1 in K562 cells (Figures 8(a)–8(c)). The genetic activation of NRF2 in K562 cells by silencing KEAP1 resulted in a 3.9-fold induction of TBXAS1 compared to 2.2-fold induction with SFN treatment (Figures 8(b) and 8(c)). Transient silencing of NRF2 in all three cell lines reduced the expression of TBXAS1 with varying degree (35%–87%) suggesting that TBXAS1 was a potential direct target of NRF2 (Figure 8(a)). In aggregate, for each of these candidate genes we see evidence of NRF2 occupancy in enhancer regions that is colocated with NFE2 occupancy in K562 cells, as well as NRF2-dependent gene expression in one or more of the experimental systems tested.
Figure 8.
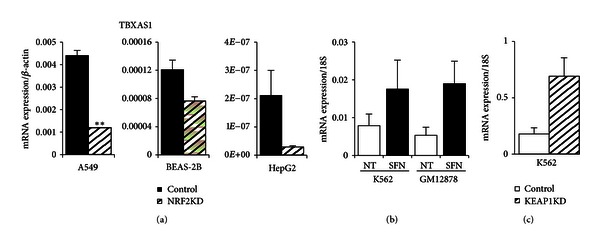
TBXAS1 gene expression in airway, hepatic, erythroid, and lymphoid cell lines. (a) NRF2 silencing in three cell lines (A549, BEAS-2B, and HepG2) treated for 8 hours with 10 μM SFN. TBXAS1 expression was reduced most significantly in A549 followed by HepG2 cells. (b) Chemical activation (10 μM SFN for 24 hours) of NRF2 in K562 and GM12878 cells led to robust induction of TBXAS1. (c) Genetic activation of NRF2 by KEAP1 silencing led to a potent TBXAS1 activation in erythroid K562 cells. Values were normalized to BACT or 18S. Bars represent an average of 3–6 independent experiments ± SEM; *P < 0.05, **P < 0.01.
4. Discussion
It is well known that NRF2 mediates the regulation of several genes involved in iron metabolism (FTL, FTH1) and the heme metabolic pathway (HMOX1) [10, 17]. NRF2 also plays a critical role in the survival of RBCs by regulating intracellular ROS levels when selenoproteins, enzymes with antioxidant properties, are depleted [9]. Here, we selected five novel NRF2- regulated hematopoietic genes based on NRF2 ChIP-seq in lymphoid cells and investigated their NRF2-dependent regulation using silencing techniques and activation treatments. In order to address NRF2-mediated expression of these hematopoietic genes in an erythroid line, K562 cells were treated with SFN to activate NRF2 and compared with lymphoid cells. Gene expression of candidate NRF2-mediated targets increased upon SFN treatment in lymphoid cells consistent with SFN-induced NRF2 occupancy detected by ChIP-seq. In addition, AMBP and TBXAS1 expression were increased both upon chemical induction by SFN and in KEAP1-silenced K562 cells. ABCB6, FECH, and HRG1 expression showed high baseline values in K562 and were not inducible by SFN at the 24 hr SFN timepoint. However, both ABCB6 and HRG1 protein levels increased in a five-hour SFN exposure as well as in the KEAP1-silenced condition. ABCB6 expression was not induced in SFN-treated A549 or BEAS2-B cells but did increase in HepG2 cells (data not shown). In addition, NRF2 silencing in untreated cells showed a reduction (50%–73%) in all three cells lines [17] suggesting NRF2 regulation at both a basal and inducible level for ABCB6. FECH expression showed a similar pattern with 24-hour SFN treatment, but A549 and BEAS-2B did not change with NRF2 silencing in untreated cells [17], unlike all three silenced SFN-treated cell lines (Figure 6(a)) suggesting the possibility of cell type-specific regulation of FECH by NRF2. HRG1 expression patterns were unchanged in all three untreated NRF2-silenced cell lines compared to control, yet SFN treatment varied among the cell lines (data not shown) suggesting the possibility of inducible regulation by NRF2. Using primary erythroid differentiating cells may be a better model to investigate NRF2 regulation of ABCB6, FECH, and HRG1 since all three genes are developmentally essential and are highly upregulated during erythroid differentiation [25, 49, 62].
One novel finding was lymphoid SFN-induced NRF2 peaks colocating at the same ARE consensus sequence as erythroid NFE2 in all of the hematopoietic candidates as well as the β-globin control region locus. Lymphoid cells do not express NFE2 suggesting a possible interaction between NRF2 and NFE2 or a response to oxidative stress in erythroid cells at NFE2 enhancer sites. NRF2 and NFE2 bind the same consensus sequence and heterodimerize the same small Maf proteins (MafF, MafG, MafK), possibly allowing either transcription factor to regulate the hematopoietic genes depending on cellular context, differentiation state, or redox homeostasis. In differentiating MEL cells, for example, MafK, a corepressor and binding partner of Bach1, shifted dimerization partners to become a coactivator with Nfe2 and bind at the β-globin locus control region [63]. Studies suggest that BACH1 heterodimerizes the same small Maf and other bZIP proteins as NRF2 and NFE2, indicating an interactive competition for small Maf proteins [64]. A study by Sun et al. [65] using multiple ChIP assays in preadipocyte mouse 3T3 cells demonstrated that increasing heme levels caused displacement of Bach1 from MafK heterodimers at the Hmox1 enhancer, allowing Nrf2 to heterodimerize with MafK in the same response element. Therefore, NRF2 may be responding to cellular stress in erythroid cells by heterodimerizing with Maf proteins and binding NFE2 enhancer sites in the promoters of genes that can modify the response to oxidative damage.
NRF2 mediation of heme metabolism and iron homeostatis genes in response to oxidative stress would be beneficial to cell survival. In K562 cells, for example, AMBP is induced by heme, hemoglobin, and ROS, and this change is accompanied by upregulation of HMOX1 leading to prevention of intracellular oxidative damage [23]. Under conditions of phenylhydrazine-induced stress, ABCB6 was found to be essential to survival in ABCB6 knock-out mice as the sole ATP-dependent porphyrin importer [62], and it seems likely that NRF2-dependent upregulation of porphyrin transport under oxidative stress conditions would be protective as well. Similarly, upregulation of FECH under oxidative stress conditions would increase production of functional heme and to support higher levels of oxygen transport. HRG1 was proposed to be responsible for transporting endocytosed heme out of the phagosome and into the cytosol for subsequential degradation by HMOX1 [66], and coordinated regulation of these two genes seems likely. While TBXAS1 is functionally quite different from the other candidates, changes in TBXAS1 expression in lung cancer cell lines have been associated with increased ROS production and induction of apoptosis, a finding that was negated when treated with antioxidant treatment [60]. Taken together, NRF2 mediation of heme metabolic and hemostatic genes AMBP, ABCB6, FECH, HRG1, and TBXAS1 provides additional insight into the vast functional diversity of NRF2 transcriptional control.
Conflict of Interests
The authors declare no conflict of interests.
Authors' Contribution
Michelle R. Campbell and Mehmet Karaca contributed equally to this work.
Disclosure
As stated in NIH Publishing Agreement “Author's contribution to the Work was done as part of the Author's official duties as a NIH employee and is a Work of the United States Government. Therefore, copyright may not be established in the United States.”
Acknowledgments
Authors would like to thank Drs. Ngome L. Makia and Sailesh Surapureddi of NIEHS for helpful suggestions, discussion and review. This work was supported by the Intramural Research Program of the National Institute of Environmental Health Sciences, National Institutes of Health (Z01-ES-100475-11).
References
- 1.Itoh K, Chiba T, Takahashi S, et al. An Nrf2/small Maf heterodimer mediates the induction of phase II detoxifying enzyme genes through antioxidant response elements. Biochemical and Biophysical Research Communications. 1997;236(2):313–322. doi: 10.1006/bbrc.1997.6943. [DOI] [PubMed] [Google Scholar]
- 2.Hayes JD, McMahon M. Molecular basis for the contribution of the antioxidant responsive element to cancer chemoprevention. Cancer Letters. 2001;174(2):103–113. doi: 10.1016/s0304-3835(01)00695-4. [DOI] [PubMed] [Google Scholar]
- 3.Cullinan SB, Gordan JD, Jin J, Harper JW, Diehl JA. The Keap1-BTB protein is an adaptor that bridges Nrf2 to a Cul3-based E3 ligase: oxidative stress sensing by a Cul3-Keap1 ligase. Molecular and Cellular Biology. 2004;24(19):8477–8486. doi: 10.1128/MCB.24.19.8477-8486.2004. [DOI] [PMC free article] [PubMed] [Google Scholar]
- 4.Itoh K, Wakabayashi N, Katoh Y, et al. Keap1 represses nuclear activation of antioxidant responsive elements by Nrf2 through binding to the amino-terminal Neh2 domain. Genes and Development. 1999;13(1):76–86. doi: 10.1101/gad.13.1.76. [DOI] [PMC free article] [PubMed] [Google Scholar]
- 5.Kobayashi A, Kang MI, Okawa H, et al. Oxidative stress sensor Keap1 functions as an adaptor for Cul3-based E3 ligase to regulate proteasomal degradation of Nrf2. Molecular and Cellular Biology. 2004;24(16):7130–7139. doi: 10.1128/MCB.24.16.7130-7139.2004. [DOI] [PMC free article] [PubMed] [Google Scholar]
- 6.Zhang DD, Lo SC, Cross JV, Templeton DJ, Hannink M. Keap1 is a redox-regulated substrate adaptor protein for a Cul3-dependent ubiquitin ligase complex. Molecular and Cellular Biology. 2004;24(24):10941–10953. doi: 10.1128/MCB.24.24.10941-10953.2004. [DOI] [PMC free article] [PubMed] [Google Scholar]
- 7.Rushmore TH, Morton MR, Pickett CB. The antioxidant responsive element: activation by oxidative stress and identification of the DNA consensus sequence required for functional activity. Journal of Biological Chemistry. 1991;266(18):11632–11639. [PubMed] [Google Scholar]
- 8.Kensler TW, Wakabayashi N, Biswal S. Cell survival responses to environmental stresses via the Keap1-Nrf2-ARE pathway. Annual Review of Pharmacology and Toxicology. 2007;47:89–116. doi: 10.1146/annurev.pharmtox.46.120604.141046. [DOI] [PubMed] [Google Scholar]
- 9.Kawatani Y, Suzuki T, Shimizu R, Kelly VP, Yamamoto M. Nrf2 and selenoproteins are essential for maintaining oxidative homeostasis in erythrocytes and protecting against hemolytic anemia. Blood. 2011;117(3):986–996. doi: 10.1182/blood-2010-05-285817. [DOI] [PubMed] [Google Scholar]
- 10.Iwasaki K, MacKenzie EL, Hailemariam K, Sakamoto K, Tsuji Y. Hemin-mediated regulation of an antioxidant-responsive element of the human ferritin H gene and role of ref-1 during erythroid differentiation of K562 cells. Molecular and Cellular Biology. 2006;26(7):2845–2856. doi: 10.1128/MCB.26.7.2845-2856.2006. [DOI] [PMC free article] [PubMed] [Google Scholar]
- 11.Barve A, Tin OK, Nair S, et al. Pharmacokinetics, pharmacodynamics and drug metabolism: pharmacogenomic profile of soy isoflavone concentrate in the prostate of Nrf2 deficient and wild-type mice. Journal of Pharmaceutical Sciences. 2008;97(10):4528–4545. doi: 10.1002/jps.21311. [DOI] [PubMed] [Google Scholar]
- 12.Hu R, Xu C, Shen G, et al. Gene expression profiles induced by cancer chemopreventive isothiocyanate sulforaphane in the liver of C57BL/6J mice and C57BL/6J/Nrf2−/− mice. Cancer Letters. 2006;243(2):170–192. doi: 10.1016/j.canlet.2005.11.050. [DOI] [PubMed] [Google Scholar]
- 13.Nair S, Xu C, Shen G, et al. Pharmacogenomics of phenolic antioxidant butylated hydroxyanisole (BHA) in the small intestine and liver of Nrf2 knockout and C57BL/6J mice. Pharmaceutical Research. 2006;23(11):2621–2637. doi: 10.1007/s11095-006-9099-x. [DOI] [PubMed] [Google Scholar]
- 14.Shen G, Xu C, Hu R, et al. Comparison of (-)-epigallocatechin-3-gallate elicited liver and small intestine gene expression profiles between C57BL/6J Mice and C57BL/6J/Nrf2−/− mice. Pharmaceutical Research. 2005;22(11):1805–1820. doi: 10.1007/s11095-005-7546-8. [DOI] [PubMed] [Google Scholar]
- 15.Wakabayashi N, Slocum SL, Skoko JJ, Shin S, Kensler TW. When NRF2 talks, who’s listening? Antioxidants and Redox Signaling. 2010;13(11):1649–1663. doi: 10.1089/ars.2010.3216. [DOI] [PMC free article] [PubMed] [Google Scholar]
- 16.Malhotra D, Portales-Casamar E, Singh A, et al. Global mapping of binding sites for Nrf2 identifies novel targets in cell survival response through chip-seq profiling and network analysis. Nucleic Acids Research. 2010;38(17):5718–5734. doi: 10.1093/nar/gkq212. [DOI] [PMC free article] [PubMed] [Google Scholar]
- 17.Chorley BN, Campbell MR, Wang X, et al. Identification of novel NRF2-regulated genes by ChIP-Seq: influence on retinoid X receptor alpha. Nucleic Acids Research. 2012;40(15):7416–7429. doi: 10.1093/nar/gks409. [DOI] [PMC free article] [PubMed] [Google Scholar]
- 18.Gasiorek JJ, Nouhi Z, Blank V. Abnormal differentiation of erythroid precursors in p45 NF-E2−/− mice. Experimental Hematology. 2012;40(5):393–400. doi: 10.1016/j.exphem.2012.01.007. [DOI] [PubMed] [Google Scholar]
- 19.Loyd MR, Okamoto Y, Randall MS, Ney PA. Role of AP1/NFE2 binding sites in endogenous α-globin gene transcription. Blood. 2003;102(12):4223–4228. doi: 10.1182/blood-2003-02-0574. [DOI] [PubMed] [Google Scholar]
- 20.The ENCODE Project Consortium. A user’s guide to the encyclopedia of dna elements (encode) PLoS Biology. 2011;9(4) doi: 10.1371/journal.pbio.1001046.e1001046 [DOI] [PMC free article] [PubMed] [Google Scholar]
- 21.Stamatoyannopoulos G. Control of globin gene expression during development and erythroid differentiation. Experimental Hematology. 2005;33(3):259–271. doi: 10.1016/j.exphem.2004.11.007. [DOI] [PMC free article] [PubMed] [Google Scholar]
- 22.He Z, Russell JE. Expression, purification, and characterization of human hemoglobins Gower-1 (ζ2ε2), Gower-2 (α 2 ε 2), and Portland-2 (ζ 2 β 2) assembled in complex transgenic-knockout mice. Blood. 2001;97(4):1099–1105. doi: 10.1182/blood.v97.4.1099. [DOI] [PubMed] [Google Scholar]
- 23.Olsson MG, Allhorn M, Bülow L, et al. Pathological conditions involving extracellular hemoglobin: molecular mechanisms, clinical significance, and novel therapeutic opportunities for α 1-microglobulin. Antioxidants & Redox Signaling. 2012;17(5):813–846. doi: 10.1089/ars.2011.4282. [DOI] [PubMed] [Google Scholar]
- 24.Kumar S, Bandyopadhyay U. Free heme toxicity and its detoxification systems in human. Toxicology Letters. 2005;157(3):175–188. doi: 10.1016/j.toxlet.2005.03.004. [DOI] [PubMed] [Google Scholar]
- 25.Khan AA, Quigley JG. Control of intracellular heme levels: heme transporters and heme oxygenases. Biochimica et Biophysica Acta. 2011;1813(5):668–682. doi: 10.1016/j.bbamcr.2011.01.008. [DOI] [PMC free article] [PubMed] [Google Scholar]
- 26.Ernst J, Kheradpour P, Mikkelsen TS, et al. Mapping and analysis of chromatin state dynamics in nine human cell types. Nature. 2011;473(7345):43–49. doi: 10.1038/nature09906. [DOI] [PMC free article] [PubMed] [Google Scholar]
- 27.Ernst J, Kellis M. ChromHMM: automating chromatin-state discovery and characterization. Nature Methods. 2012;9(3):215–216. doi: 10.1038/nmeth.1906. [DOI] [PMC free article] [PubMed] [Google Scholar]
- 28.Peirson SN, Butler JN, Foster RG. Experimental validation of novel and conventional approaches to quantitative real-time PCR data analysis. Nucleic Acids Research. 2003;31(14, e73) doi: 10.1093/nar/gng073. [DOI] [PMC free article] [PubMed] [Google Scholar]
- 29.Nagai T, Igarashi K, Akasaka JE, et al. Regulation of NF-E2 activity in erythroleukemia cell differentiation. Journal of Biological Chemistry. 1998;273(9):5358–5365. doi: 10.1074/jbc.273.9.5358. [DOI] [PubMed] [Google Scholar]
- 30.Davydov EV, Goode DL, Sirota M, Cooper GM, Sidow A, Batzoglou S. Identifying a high fraction of the human genome to be under selective constraint using GERP++ PLoS Computational Biology. 2010;6(12) doi: 10.1371/journal.pcbi.1001025.e1001025 [DOI] [PMC free article] [PubMed] [Google Scholar]
- 31.Martin F, Van Deursen JM, Shivdasani RA, Jackson CW, Troutman AG, Ney PA. Erythroid maturation and globin gene expression in mice with combined deficiency of NF-E2 and Nrf-2. Blood. 1998;91(9):3459–3466. [PubMed] [Google Scholar]
- 32.Sawado T, Igarashi K, Groudine M. Activation of β-major globin gene transcription is associated with recruitment of NF-E2 to the β-globin LCR and gene promoter. Proceedings of the National Academy of Sciences of the United States of America. 2001;98(18):10226–10231. doi: 10.1073/pnas.181344198. [DOI] [PMC free article] [PubMed] [Google Scholar]
- 33.Moore A, Boudia MM, Lehalle D, Massrieh W, Derjuga A, Blank V. Regulation of globin gene transcription by heme in erythroleukemia cells: analysis of putative heme regulatory motifs in the p45 NF-E2 transcription factor. Antioxidants and Redox Signaling. 2006;8(1-2):68–75. doi: 10.1089/ars.2006.8.68. [DOI] [PubMed] [Google Scholar]
- 34.Shivdasani RA, Orkin SH. Erythropoiesis and globin gene expression in mice lacking the transcription factor NF-E2. Proceedings of the National Academy of Sciences of the United States of America. 1995;92(19):8690–8694. doi: 10.1073/pnas.92.19.8690. [DOI] [PMC free article] [PubMed] [Google Scholar]
- 35.Chan JY, Kwong M, Lo M, Emerson R, Kuypers FA. Reduced oxidative-stress response in red blood cells from p45NFE2-deficient mice. Blood. 2001;97(7):2151–2158. doi: 10.1182/blood.v97.7.2151. [DOI] [PubMed] [Google Scholar]
- 36.Lee JM, Chan K, Kan YW, Johnson JA. Targeted disruption of Nrf2 causes regenerative immune-mediated hemolytic anemia. Proceedings of the National Academy of Sciences of the United States of America. 2004;101(26):9751–9756. doi: 10.1073/pnas.0403620101. [DOI] [PMC free article] [PubMed] [Google Scholar]
- 37.Macari ER, Lowrey CH. Induction of human fetal hemoglobin via the NRF2 antioxidant response signaling pathway. Blood. 2011;117(22):5987–5997. doi: 10.1182/blood-2010-10-314096. [DOI] [PMC free article] [PubMed] [Google Scholar]
- 38.Sangokoya C, Telen MJ, Chi JT. microRNA miR-144 modulates oxidative stress tolerance and associates with anemia severity in sickle cell disease. Blood. 2010;116(20):4338–4348. doi: 10.1182/blood-2009-04-214817. [DOI] [PMC free article] [PubMed] [Google Scholar]
- 39.Bratt T, Olsson H, Sjoberg EM, Jergil B, Akerstrom B. Cleavage of the α1-microglobulin-bikunin precursor is localized to the Golgi apparatus of rat liver cells. Biochimica et Biophysica Acta. 1993;1157(2):147–154. doi: 10.1016/0304-4165(93)90058-g. [DOI] [PubMed] [Google Scholar]
- 40.Sánchez D, Martínez S, Lindqvist A, Åkerström B, Falkenberg C. Expression of the AMBP gene transcript and its two protein products, α1-microglobulin and bikunin, in mouse embryogenesis. Mechanisms of Development. 2002;117(1-2):293–298. doi: 10.1016/s0925-4773(02)00202-2. [DOI] [PubMed] [Google Scholar]
- 41.Siebel JF, Kosinsky RL, Åkerström B, Knipp M. Insertion of heme b into the structure of the Cys34-carbamidomethylated human lipocalin α1-microglobulin: formation of a [(heme)2(α 1-microglobulin)]3 complex. Chembiochem. 2012;13(6):879–887. doi: 10.1002/cbic.201100808. [DOI] [PubMed] [Google Scholar]
- 42.Meining W, Skerra A. The crystal structure of human α 1-microglobulin reveals a potential haem-binding site. Biochemical Journal. 2012;445(2):175–182. doi: 10.1042/BJ20120448. [DOI] [PubMed] [Google Scholar]
- 43.Olsson M, Olofsson T, Tapper H, Åkerström B. The lipocalin αa1-microglobulin protects erythroid K562 cells against oxidative damage induced by heme and reactive oxygen species. Free Radical Research. 2008;42(8):725–736. doi: 10.1080/10715760802337265. [DOI] [PubMed] [Google Scholar]
- 44.Larsen R, Gouveia Z, Soares MP, Gozzelino R. Heme cytotoxicity and the pathogenesis of immune-mediated inflammatory diseases. Frontiers in Pharmacology. 2012;3, article 77 doi: 10.3389/fphar.2012.00077. [DOI] [PMC free article] [PubMed] [Google Scholar]
- 45.Hübner RH, Schwartz JD, De BP, et al. Coordinate control of expression of Nrf2-modulated genes in the human small airway epithelium is highly responsive to cigarette smoking. Molecular Medicine. 2009;15(7-8):203–219. doi: 10.2119/molmed.2008.00130. [DOI] [PMC free article] [PubMed] [Google Scholar]
- 46.Krishnamurthy PC, Du G, Fukuda Y, et al. Identification of a mammalian mitochondrial porphyrin transporter. Nature. 2006;443(7111):586–589. doi: 10.1038/nature05125. [DOI] [PubMed] [Google Scholar]
- 47.Helias V, Saison C, Ballif BA, et al. ABCB6 is dispensable for erythropoiesis and specifies the new blood group system Langereis. Nature Genetics. 2012;44(2):170–173. doi: 10.1038/ng.1069. [DOI] [PMC free article] [PubMed] [Google Scholar]
- 48.Schultz IJ, Chen C, Paw BH, Hamza I. Iron and porphyrin trafficking in heme biogenesis. Journal of Biological Chemistry. 2010;285(35):26753–26759. doi: 10.1074/jbc.R110.119503. [DOI] [PMC free article] [PubMed] [Google Scholar]
- 49.Chung J, Chen C, Paw BH. Heme metabolism and erythropoiesis. Current Opinion in Hematology. 2012;19(3):156–162. doi: 10.1097/MOH.0b013e328351c48b. [DOI] [PMC free article] [PubMed] [Google Scholar]
- 50.Chen W, Dailey HA, Paw BH. Ferrochelatase forms an oligomeric complex with mitoferrin-1 and Abcb10 for erythroid heme biosynthesis. Blood. 2010;116(4):628–630. doi: 10.1182/blood-2009-12-259614. [DOI] [PMC free article] [PubMed] [Google Scholar]
- 51.Chen W, Paradkar PN, Li L, et al. Abcb10 physically interacts with mitoferrin-1 (Slc25a37) to enhance its stability and function in the erythroid mitochondria. Proceedings of the National Academy of Sciences of the United States of America. 2009;106(38):16263–16268. doi: 10.1073/pnas.0904519106. [DOI] [PMC free article] [PubMed] [Google Scholar]
- 52.Andrews NC. ABCs of erythroid mitochondrial iron uptake. Proceedings of the National Academy of Sciences of the United States of America. 2009;106(38):16012–16013. doi: 10.1073/pnas.0909137106. [DOI] [PMC free article] [PubMed] [Google Scholar]
- 53.Gouya L, Puy H, Robreau AM, et al. The penetrance of dominant erythropoietic protoporphyria is modulated by expression of wildtype FECH. Nature Genetics. 2002;30(1):27–28. doi: 10.1038/ng809. [DOI] [PubMed] [Google Scholar]
- 54.Riedl MA, Saxon A, Diaz-Sanchez D. Oral sulforaphane increases Phase II antioxidant enzymes in the human upper airway. Clinical Immunology. 2009;130(3):244–251. doi: 10.1016/j.clim.2008.10.007. [DOI] [PMC free article] [PubMed] [Google Scholar]
- 55.Keller MA, Addya S, Vadigepalli R, et al. Transcriptional regulatory network analysis of developing human erythroid progenitors reveals patterns of coregulation and potential transcriptional regulators. Physiological Genomics. 2006;28(1):114–128. doi: 10.1152/physiolgenomics.00055.2006. [DOI] [PubMed] [Google Scholar]
- 56.Rajagopal A, Rao AU, Amigo J, et al. Haem homeostasis is regulated by the conserved and concerted functions of HRG-1 proteins. Nature. 2008;453(7198):1127–1131. doi: 10.1038/nature06934. [DOI] [PMC free article] [PubMed] [Google Scholar]
- 57.Funk CD. Prostaglandins and leukotrienes: advances in eicosanoid biology. Science. 2001;294(5548):1871–1875. doi: 10.1126/science.294.5548.1871. [DOI] [PubMed] [Google Scholar]
- 58.Samuelsson B, Goldyne M, Granström E, Hamberg M, Hammarström S, Malmsten C. Prostaglandins and thromboxanes. Annual Review of Biochemistry. 1978;47:997–1029. doi: 10.1146/annurev.bi.47.070178.005025. [DOI] [PubMed] [Google Scholar]
- 59.Cathcart MC, Gately K, Cummins R, Kay E, O’Byrne KJ, Pidgeon GP. Examination of thromboxane synthase as a prognostic factor and therapeutic target in non-small cell lung cancer. Molecular Cancer. 2011;10, article 25 doi: 10.1186/1476-4598-10-25. [DOI] [PMC free article] [PubMed] [Google Scholar]
- 60.Leung KC, Li MY, Leung BCS, et al. Thromboxane synthase suppression induces lung cancer cell apoptosis via inhibiting NF-κB. Experimental Cell Research. 2010;316(20):3468–3477. doi: 10.1016/j.yexcr.2010.07.003. [DOI] [PubMed] [Google Scholar]
- 61.Mousa AA, Strauss JF, III, Walsh SW. Reduced methylation of the thromboxane synthase gene is correlated with its increased vascular expression in preeclampsia. Hypertension. 2012;59(6):1249–1255. doi: 10.1161/HYPERTENSIONAHA.111.188730. [DOI] [PMC free article] [PubMed] [Google Scholar]
- 62.Ulrich DL, Lynch J, Wang Y, et al. ATP-dependent mitochondrial porphyrin importer ABCB6 protects against phenylhydrazine toxicity. Journal of Biological Chemistry. 2012;287(16):12679–12690. doi: 10.1074/jbc.M111.336180. [DOI] [PMC free article] [PubMed] [Google Scholar]
- 63.Brand M, et al. Dynamic changes in transcription factor complexes during erythroid differentiation revealed by quantitative proteomics. Nature Structural & Molecular Biology. 2004;11(1):73–80. doi: 10.1038/nsmb713. [DOI] [PubMed] [Google Scholar]
- 64.Warnatz HJ, Schmidt D, Manke T, et al. The BTB and CNC homology 1 (BACH1) target genes are involved in the oxidative stress response and in control of the cell cycle. Journal of Biological Chemistry. 2011;286(26):23521–23532. doi: 10.1074/jbc.M111.220178. [DOI] [PMC free article] [PubMed] [Google Scholar]
- 65.Sun J, Brand M, Zenke Y, Tashiro S, Groudine M, Igarashi K. Heme regulates the dynamic exchange of Bach1 and NF-E2-related factors in the Maf transcription factor network. Proceedings of the National Academy of Sciences of the United States of America. 2004;101(6):1461–1466. doi: 10.1073/pnas.0308083100. [DOI] [PMC free article] [PubMed] [Google Scholar]
- 66.Delaby C, Rondeau C, Pouzet C, et al. Subcellular localization of iron and heme metabolism related proteins at early stages of erythrophagocytosis. PLoS ONE. 2012;7(7) doi: 10.1371/journal.pone.0042199.e42199 [DOI] [PMC free article] [PubMed] [Google Scholar]