Abstract
This paper reports the development of a biodosimetry device suitable for rapidly measuring expression levels of a low-density gene set that can define radiation exposure, dose and injury in a public health emergency. The platform comprises a set of 14 genes selected on the basis of their abundance and differential expression level in response to radiation from an expression profiling series measuring 41,000 transcripts. Gene expression is analyzed through direct signal amplification using a quantitative Nuclease Protection Assay (qNPA). This assay can be configured as either a high-throughput microplate assay or as a handheld detection device for individual point-of-care assays. Recently, we were able to successfully develop the qNPA platform to measure gene expression levels directly from human whole blood samples. The assay can be performed with volumes as small as 30 µL of whole blood, which is compatible with collection from a fingerstick. We analyzed in vitro irradiated blood samples with qNPA. The results revealed statistically significant discrimination between irradiated and non-irradiated samples. These results indicate that the qNPA platform combined with a gene profile based on a small number of genes is a valid test to measure biological radiation exposure. The scalability characteristics of the assay make it appropriate for population triage. This biodosimetry platform could also be used for personalized monitoring of radiotherapy treatments received by patients.
Keywords: accidents, handling, blood, dosimetry, radiological terrorism
INTRODUCTION
Today, there is a clear need for a simple, very efficient biodosimetry device that could be applied in public health situations such as the screening of potential victims of an act of radiologic terrorism, as well as in clinical situations such as monitoring the dose of radiation received by patients undergoing radiotherapy. In a public health event such as a “dirty bomb,” the possibly-exposed population would have to be tested within a few days to separate people who received no or very little radiation from the ones who need moderate to intensive medical care (e.g., bone marrow transplants). The development of a high-throughput device that could process large numbers of samples and return results in less than 24 h is a high priority need that would be hard to meet with conventional technologies (Blakely et al. 2005).
Presently, there are three biodosimetry methods that could potentially be adapted to such circumstances. The current gold standard for radiation biodosimetry is the dicentric chromosome assay (DCA) (IAEA 1986). This assay is based on the observation and counting of the abnormal fusion of two chromosomes in metaphase spreads prepared from lymphocytes. The reliability of this technique is very good, but the process is labor intensive, time consuming, and even when fully automated, takes several days to obtain the data. This time scale is not compatible with prompt treatment of heavily exposed individuals in the event of a radiological mass-exposure incident (Blakely et al. 2005; Amundson et al. 2001b). Another technique, electron paramagnetic resonance (EPR), is based on the generation of stable free radicals in response to ionizing radiation. This technique was developed in 1944 but has only recently been adapted to analyze a variety of biological samples such as fingernails, tooth enamel, and bones (Zavoiskii 1944; IAEA 2002). These samples are very stable, but the doses calculated from these samples are not always representative of dose experienced by the tissues most sensitive to radiation damage. The most recent technique to emerge is based on gene expression analysis. Changes in gene expression in the response of peripheral blood lymphocytes to radiation can reveal both whether an individual has been exposed to radiation and the magnitude of the dose of radiation received (Amundson et al. 2000, 2001a and 2001b, 2003, 2004; Dressman et al. 2007; Fornace et al. 1999 and 2002). In order to utilize this cellular response as a means to rapidly assess the radiation exposure of very large numbers of people that might possibly have been exposed to the release of radioactive materials, a very simple version of an assay indicative of changes in gene expression would need to be produced.
A recent study analyzed the expression response of lymphocytes collected from normal, healthy volunteers and subjected ex vivo to radiation doses of 0, 0.5, 2, 5, and 8 Gy (Paul and Amundson 2008). The transcriptional responses of these lymphocytes after 6 or 24 h of culture were assessed by extracting their RNA and quantitating the abundance of 41,000 different transcripts using gene expression microarrays. As this series of samples provided a baseline non-irradiated reading which could be used to normalize all of the other readings, it was possible to demonstrate that expression levels could readily distinguish non-irradiated from irradiated samples, and similarly, samples with relatively low exposure (i.e., 0.5 or 2 Gy) from samples with relatively high exposure (i.e., 5 or 8 Gy). From these experiments, a gene expression signature has been established and can be used to predict radiation exposure dose without the need of a pre-exposure sample that would be difficult to get in a radiation-releasing event (Paul and Amundson 2008).
The present study focuses on developing a diagnostic platform to measure dose-dependent gene expression from a fingerstick of blood. A set of 14 genes was chosen from the previous expression profiling data based on their high level of differential change following even moderate doses of x-rays as well as their level of abundance even when unstimulated, characteristics that improve the robustness of the assay.
This paper will demonstrate that the selected radiation exposure gene set used in the quantitative nuclease protection assay serves as a biodosimetrer. It will also describe the adaptation of this assay to a “lab on chip” format, which will help considerably to accelerate the processing speed for the assay (Liu et al. 2004).
MATERIALS AND METHODS
Blood collection and irradiation
These experiments were approved by the institutional review board (IRB#0807003079 and IRB#2008-036) and were conducted according to the principles expressed in the Declaration of Helsinki. Written consent for participation in the study was obtained from all the subjects voluntarily. Samples containing 6 ml of peripheral blood samples were collected from healthy volunteers in glass vacutainer tubes (12.35 mg Sodium Citrate, 2.21 mg Citric Acid) (VWR International, Pittsburg, PA). The blood was divided into 2 mL aliquots and exposed to 0, 2, and 8 Gy x-rays using the Varian 21EX Novalis Beam-Shaped System. After irradiation, blood samples were diluted 1:1 with RPMI 1640 medium (Invitrogen) supplemented with 10% heat inactivated fetal bovine serum (Invitrogen) and incubated for 24 h at 37°C in a humidified incubator with 5% CO2. Twenty four hours after exposure, RNA was extracted from the non-irradiated and irradiated whole blood samples and analyzed through the qNPA radiation array.
RNA purification from whole blood samples
RNA was extracted and purified from the blood using the Norgen Leukocyte RNA kit (Norgen, Thorold, ON Canada) following the manufacturer’s recommendations. In this procedure, the red blood cells are first removed from the sample through differential red blood cell lysis, and the leukocytes are recovered through centrifugation. The leukocytes are lysed, and purification of the leukocyte RNA is then based on spincolumn chromatography using Norgen’s resin as the separation matrix. RNA extracted from 2 mL blood sample was eluted with 50 µL of elution buffer and quantified using a Nanodrop-1000 spectrophotometer (Thermo Scientific, NanoDrop Technologies, Inc., 3411 Silverside Rd., Wilmington, DE).
qNPA
250 ng of total RNA was used for the quantitative nuclease protection assay. Array plate qNPA kits (HTG) were provided for all components of the assay (Martel et al. 2002). RNA was diluted in lysis buffer (up to 30 µL), which contains the protection fragments (probes), and added to wells in a 96-well microtiter plate. The plate was heated at 95°C (denaturation) and incubated 6 h at 60°C for hybridization of the probes to the RNA. Nonhybridized RNA and DNA were degraded by the addition of 50 units of S1 nuclease (20 µL/well) dissolved in 1.4 M NaCl, 22.5 mM zinc sulfate, 250 mM sodium acetate, pH 4.5 during 1 h at 50°C. The reaction was terminated by addition of 10 µL/well of stop solution (1.6 M NaOH, 135 mM EDTA), followed by heating for 15 min at 95°C and cooling to room temperature. This step also serves to degrade any residual RNA. 10 µL of neutralizing solution (1 M Hepes, pH 7.5, 1.6 M HCl, 6× SSC) were added to the wells to hydrolyze the duplex and degrade the RNA, leaving the sample with the selected probe only. Samples were then transferred for RNA quantification to an array plate where 16 spots, each containing a linker to specifically capture each probe, had been printed into each of the wells. The array plate was incubated overnight (ON) at 50°C and washed 6 times with 200 µL SSCS (1× SSC, 0.1% SDS) using a microplate strip washer (ELx50, Biotek Instruments Inc.). The detection linkers (5 mM) were added and the plate was incubated at 50°C for 1 h. The plate was washed for another cycle and 40 µL of the detection enzyme (HRP detection probes, 10 nM) were added for 30 min at 37°C, followed by another wash and addition of HRP chemiluminescent peroxydase substrate. The chemiluminescent signal from each well of the plate was quantified and reported by the imager.
Cell culture and treatment
THP-1 cells were obtained from ATCC (American Type Culture Collection). Cells were grown in RPMI medium 1640 (Invitrogen), supplemented with 10% FBS [heat inactivated fetal bovine serum (Invitrogen)], 1% Glutamax (Gibco) and 1% penicillin-streptomycin (ATCC). Cells were maintained in a humidified incubator at 37°C in 5% CO2 atmosphere. THP-1 cells were diluted at a concentration of 5 × 10⁵ cells/mL and incubated for 48 h in medium containing PMA (phorbol-12-myristate-13-acetate) (100 ng/mL) for maturation into macrophage-like adherent cells. This treatment was followed by a 4 h treatment with LPS (200 mg/mL). Cells were then washed and harvested before being resuspended in 1× lysis buffer (HTG) and assayed by qNPA.
RESULTS AND DISCUSSION
Optimization of the qNPA on a 96-well plate
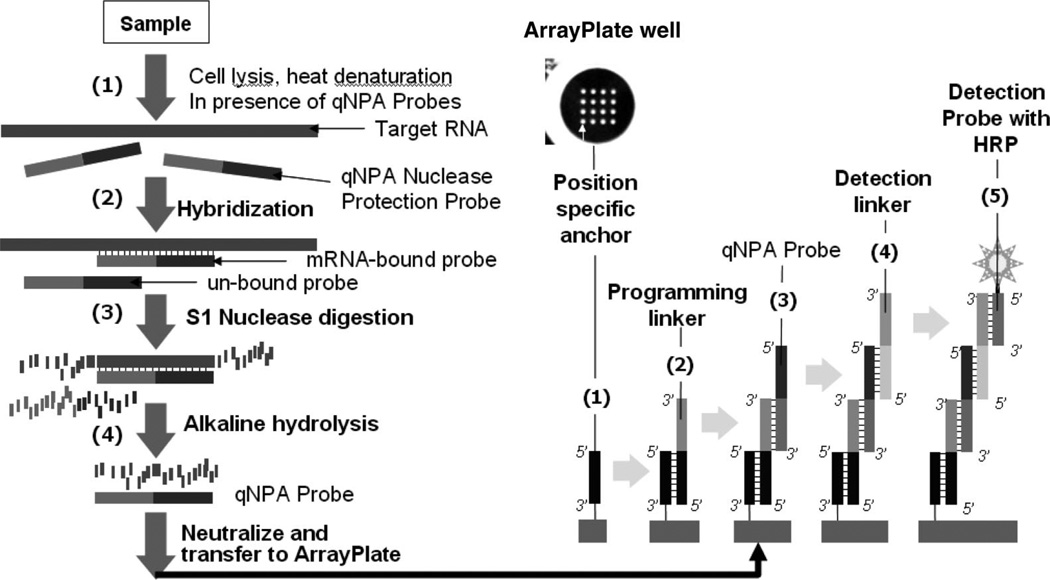
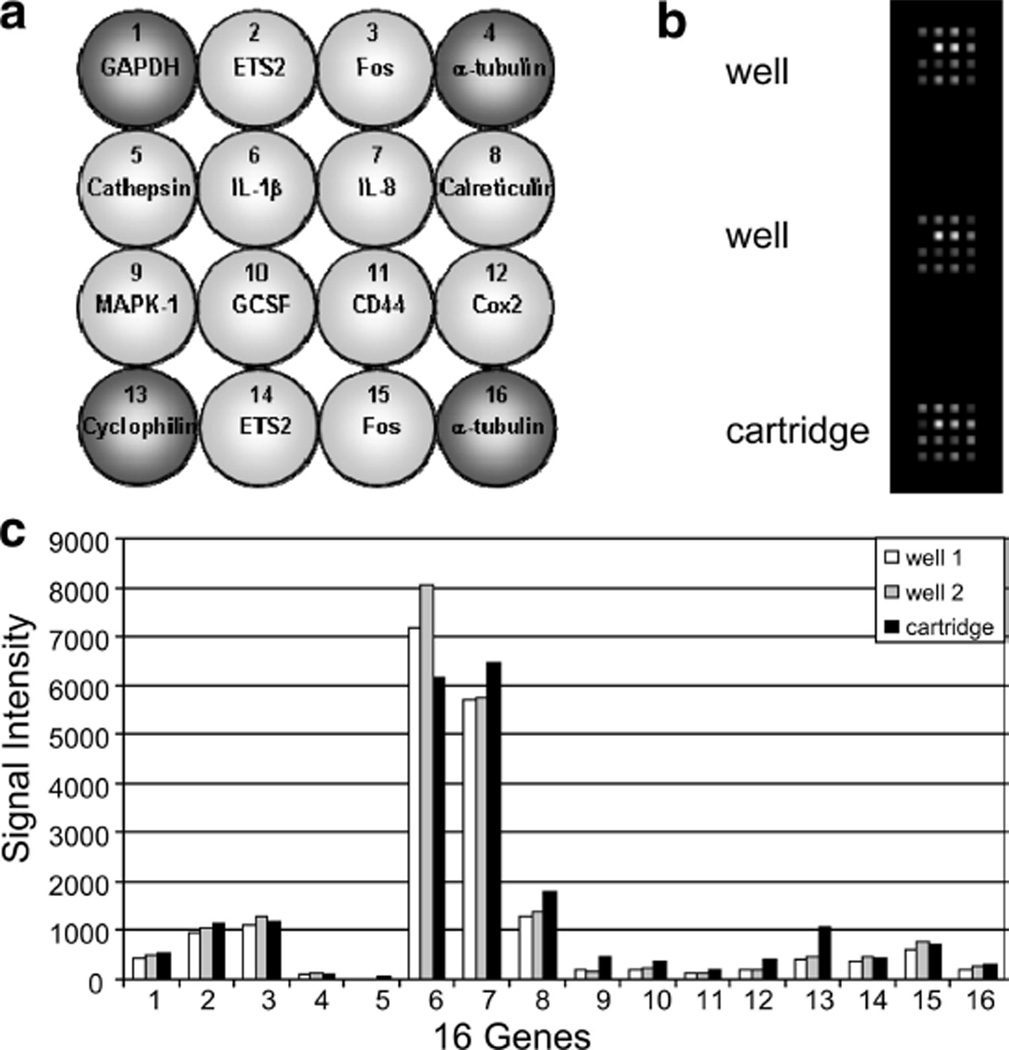
The quantitative nuclease protection assay is a commercially available platform (Fig. 1) (High Throughput Genomics, AZ) (Martel et al. 2002). The qNPA microarray assay is a lysis-only multiplexed mRNA assay for the quantitative high-sample-throughput measurement of gene expression. The technology can be applied to a very broad range of input samples, whole organisms, tissues, cells and purified RNA. The most extensively characterized qNPA assay uses an inflammation array (Fig. 2a). For this reason, the same array was used to optimize the assay on the microfluidic cartridge (Fig. 3) before switching to the novel radiation array. The qNPA is unique in that RNA extraction, RNA amplification, and RNA labeling are not required. This leads to very quantitatively reproducible results. The lysis buffer, which contains the probes for the genes of interest, is directly added to the blood sample. After denaturation and hybridization, there is an S1 nuclease reaction, followed by a neutralization step that dissociates duplexes and hydrolyzes residual RNA, leaving the protected probes only (Fig. 1). The chief limitation of this assay is the 27 h time to completion. The authors were able to reduce the qNPA protocol time down to 9 h after significant kinetic improvement of the two major reaction steps (Table 1). The first step is the hybridization of the probes to the selected genes. In the original procedure this was 6 h, but it is only 2 h in the optimized procedure. The second hybridization step, the binding of the protected probes and the various detection probes to the immobilized linker, was an ON step, but now is 4 h. Imaging and quantitation are carried out on a chemiluminescent imager that is able to scan a 96-well plate in 2 min, which will allow analysis of more than 200,000 samples in 1 wk in case of a massive irradiation event. The robustness of the data and the time efficiency of this assay make it ideal as an assay for biodosimetry.
Fig. 1.
Description of the qNPA protocol. After denaturation of the sample (1) in the presence of the lysis buffer and the protection fragments, these probes hybridize the sample (2). The single strand molecules (non-hybridized) will be degraded during the S1 nuclease reaction (3). The molecule duplex will be hydrolyzed (4) and the RNA will be degraded leaving the sample containing the selected probes. The sample will then be transferred to the array plate previously programmed by the addition of linkers to capture each specific nuclease protection probe (1, 2). Probes will hybridize to the complementary programming linker. Detection linkers are added to bind to the probes (4). Detection probes will hybridize to the detection linker. HRP substrates are added (5) for the chemiluminescent detection which is quantitatively imaged using a proprietary CDD based chemiluminescent reader.
Fig. 2.
qNPA on the front-end cartridge. (a) Layout of the inflammation array. At the four corners are represented the housekeeping genes (dark grey) used to normalize the data. The other genes (light grey) are the genes being tested. (b) Composite image of the chemiluminescence emission captured at the position of the array element. Top and middle (well) are obtained from samples run in a 96-well array plate. Bottom image (cartridge) was obtained from sample run in the front-end cartridge (nuclease reaction), then transferred to the 96-well array plate. (c) Comparison of transcript level when the qNPA is run on the 96 well-array plate vs. the front end of the cartridge.
Fig. 3.
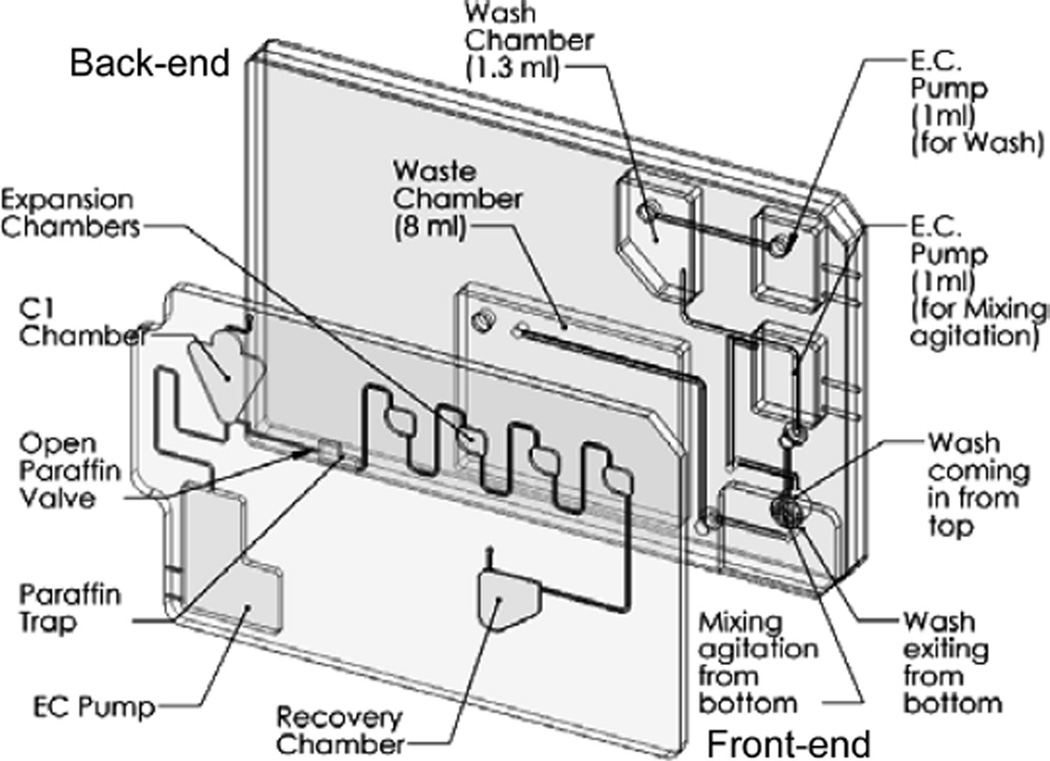
Schematic of the “lab on chip” cartridge. The cartridge contains a front-end module for the sample preparation of the nuclease protection assay and a back-end module corresponding to the future microarray chemiluminescent detection.
Table 1.
Optimization of the qNPA protocol.
| Solutions/steps | Incubation temp |
Original time |
Optimized time |
|---|---|---|---|
| Denaturation | 95°C | 20 min | 5 min |
| Hybridization | 60°C | 6 hours | 2 hours |
| S1 nuclease reaction | 50°C | 90 min | 60 min |
| Stop reaction | 95°C | 15 min | 15 min |
| Cool plate | RT | 10 min | 5 min |
| Transfer to array | 50°C | 16 hours | 4 hours |
| Detection linker | 60°C | 90 min | 60 min |
| Detection enzyme | 37°C | 60 min | 30 min |
| Protocol time | 27 hours | 9 hours |
Adaptation of the qNPA protocol to a microfluidic format
Microfluidic cartridges have been designed that comprise a front-end module for the sample preparation of the nuclease protection assay and a back-end module corresponding to the microarray chemiluminescent detection (Fig. 3) and fabricated. For the actuation and control of these cartridges, a printed circuit board and a computer controlled test-station, including Labview software user interface, were designed and prototyped. This universal test station (UTS) was made to accommodate operational testing of opening and closing valves, incubation of chambers at different temperatures, transfer of samples from one chamber to another, mixing and sample recovery. Once the assay is complete, the analysis is performed with a proprietary CCD-based chemiluminescence array reader suitable for accommodating these integrated microfluidic cartridges.
The qNPA protocol includes several mixing steps that are crucial for the success of this assay. On the front-end cartridge, 3 buffers with different viscosities need to be mixed with the initial sample at different stages of the experiment as quickly as possible and with the same efficiency that is achieved on the 96-well plate configuration. Recently, the authors were able to successfully perform qNPA on the front-end cartridge by using the advantages of the microfluidic system to mix the different samples. For the buffers with a low viscosity, an “on chip” electrochemical pump was used to force bubbles into the chamber, creating enough fluid movement to mix the sample. For the high viscosity neutralizing solution, intermediate mixing chambers were integrated into the cartridge (Fig. 3). The concentration of the S1 nuclease enzyme was also doubled from the original qNPA protocol. Once the steps on the front-end cartridge are processed, the sample is recovered from the chamber C2 of the cartridge and transferred to the array plate for RNA quantification. In the future, the sample will be automatically transferred to the back-end cartridge. Each experiment was done in parallel on a 96-well plate as a positive control. Similar profiles were obtained for the gene expression of the samples run on the front-end cartridge and the ones that had a complete run on a 96-well plate, revealing the success of the qNPA processing on the front-end cartridge (Figs. 2b and 2c). These results demonstrate that the qNPA can be successfully adapted into a microfluidic format, which will allow the future automation of the full assay. Now that the qNPA on the front-end cartridge has been adapted, the development of integration with the chip-based back-end detection is being pursued.
Gene signature for the radiation array
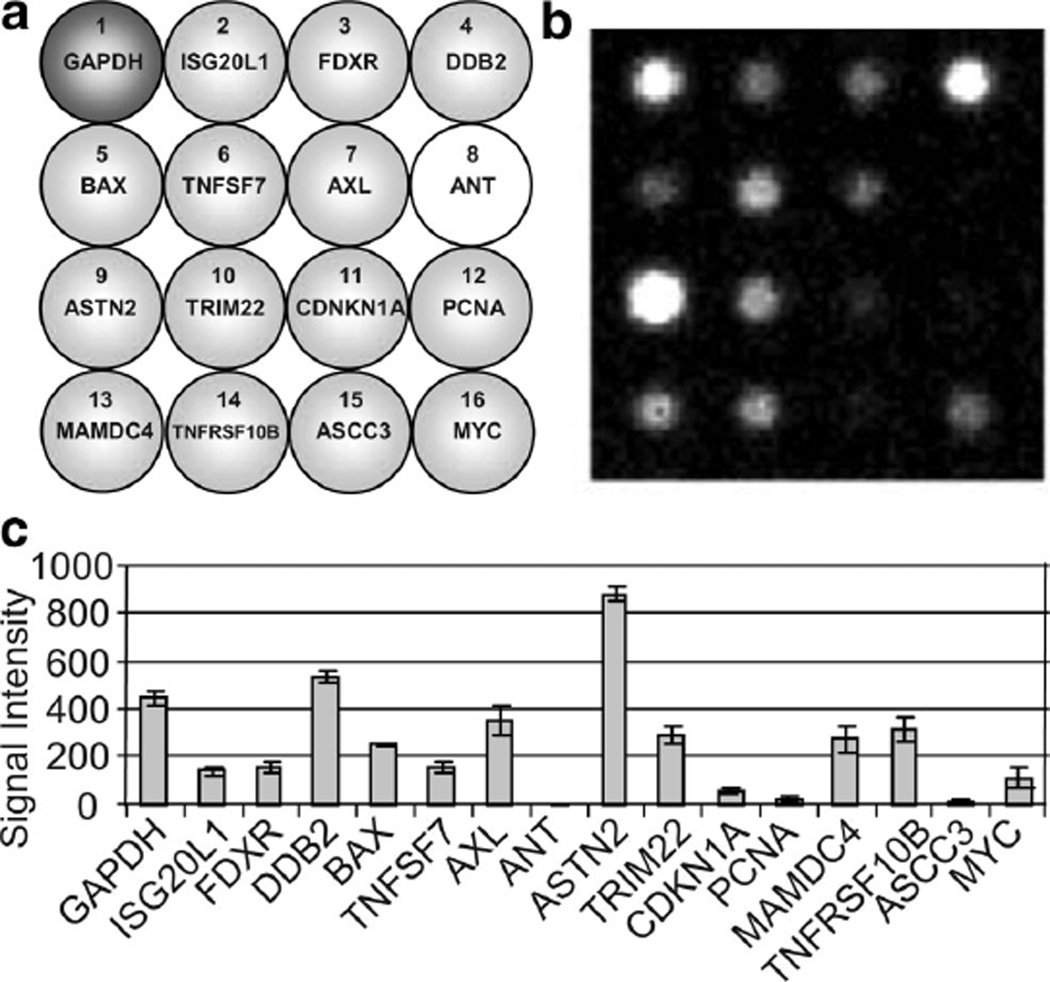
The radiation array platform comprises a set of 14 genes selected from the initial 41,000 gene expression profiling series on ex vivo irradiation of blood at doses of 0, 0.5, 2, 5, and 8 Gy. The selection of these genes was based both on their extent of differential expression level in response to radiation and their overall abundance. These genes showed an expression level increasing linearly with dose between 0.2 and 2 Gy up to 48 h post-exposure (Amundson et al. 2001b; Paul and Amundson 2008). One housekeeping gene, GAPDH, and one negative control, ANT, were added to complete the 16-gene radiation array (Fig. 4a). This was called Radiation Array I (RA-I), as a series of arrays for specific radiation types and doses is being developed. The gene names, accession numbers, and sequences chosen for RA-I are shown in Table 2.
Fig. 4.
qNPA on blood sample. (a) Layout of the radiation array I. At the top left corner is represented the housekeeping gene (GAPDH) used to normalize the data. The other genes (light grey) are the genes being tested. ANT is the negative control. (b) Composite image of the chemiluminescence emission captured at the position of the array element. (c) Transcript level obtained from qNPA run on whole blood sample.
Table 2.
Genes for radiation array I (RA-I).
| Gene name | Accession number | Sequence |
|---|---|---|
| ISG20L1 (BE646426) | NM_022767 | GAAGCCAAACCTGTGCCTGGTGGCCACAGACAAGACACACGGATATCCGTGAACCTTGCT |
| FDXR | NM_024417 | CGATCTAACCCCTTACCCATCTCTCTACTGCTGGACTGTGGAGGGTCACCAGGTTGGGAA |
| DDB2 | NM_000107 | CAAGGGCCCCTCTGTATCTAGCCTGGAACCAAGGTTATCTTGGAACTAAATGACTTTTCT |
| BAX | NM_138764 | TGCCTTGGACTGTGTTTTTCCTCCATAAATTATGGCATTTTTCTGGGAGGGGTGGGGATT |
| TNFSF7 | NM_001252 | TGGTGGCAGGACAAGAGAAGGCATTGAGCTTTTTCTTTCATTTTCCTATTAAAAAATACA |
| AXL | NM_001699 | AGCCTTAGAACATCACATTTTAGAATCCTAGGCCTTAGAACCTCCATGTCTAGAACTATA |
| ASTN2 | NM_014010 | GTGAGGAAGCATGGGTCTTTAAGGACTTCTCTCTCTTTTTTGCTGGACATTATTGAGTTT |
| TRIM22 | NM_006074 | GTACATAAGAATCTATCACTAAGTAATGTATCCTTCAGAATGTGTTGGTTTACCAGTGAC |
| CDKN1A | NM_000389 | CATCCCTCCCCAGTTCATTGCACTTTGATTAGCAGCGGAACAAGGAGTCAGACATTTTAA |
| PCNA | NM_002592 | ACCCCTTGTTGTAGAGTATAAAATTGCGGATATGGGACACTTAAAATACTACTTGGCTCC |
| MAMDC4 | NM_206920 | CATCCTTTTCAATGCGGATGGTGTCACCCTCCCGGCATCTGTCACCAGTGATCCGTAGAC |
| TNFRSF10B | NM_003842 | AAATAGCATGTGACACAGGACAGCCATAGTATAGTGTGTCACTCGTGGTTGGTGTCCTTT |
| ASCC3 | NM_006828 | TCTGCCGCATAAACTATAAATCTGTAAGGTGGTACACAGCGTGTCTTGTTAGCAAAATTT |
| MYC | NM_002467 | TTCAAATGCATGATCAAATGCAACCTCACAACCTTGGCTGAGTCTTGAGACTGAAAGATT |
| ANT | U41339 | Negative control |
| GAPDH | NM_002046 | Housekeeping gene |
Quantitative nuclease protection assay on human whole blood
Although qNPA assay technology had been successfully used to detect highly expressed genes in mouse blood and for expression profiling of isolated leukocytes, qNPA application to human whole blood always resulted in high background, S1 failures, or no signal. However, the authors have now successfully adapted the quantitative Nuclease Protection Assay to measure gene expression levels from human whole blood samples. When the blood is added to the lysis buffer, cell debris aggregates and the samples can’t be easily processed through qNPA. After the denaturation, the samples were centrifuged and the clear lysates were transferred to a new tube. In addition, proteinase K was added during the hybridization step. The subsequent steps were identical to the original protocol of the qNPA. As a result, it was possible to obtain the gene expression profile of the selected genes sensitive to radiation from human whole blood samples (Fig. 4b and 4c). These results were obtained from a very small volume of blood, 30 µL, which can easily be obtained with a fingerstick collection. It is the first time that the quantitative nuclease protection assay was successfully realized on a small volume of human whole blood. Next, work will begin on different approaches to adapt the qNPA on blood using a microfluidic format. Since it won’t be possible to have a centrifugation step on a cartridge, different techniques are under investigation. One of them will be to try to break these aggregates by using an ultrasonication system that could be integrated in the cartridge.
qNPA allows distinguishing between non-irradiated vs. irradiated blood samples
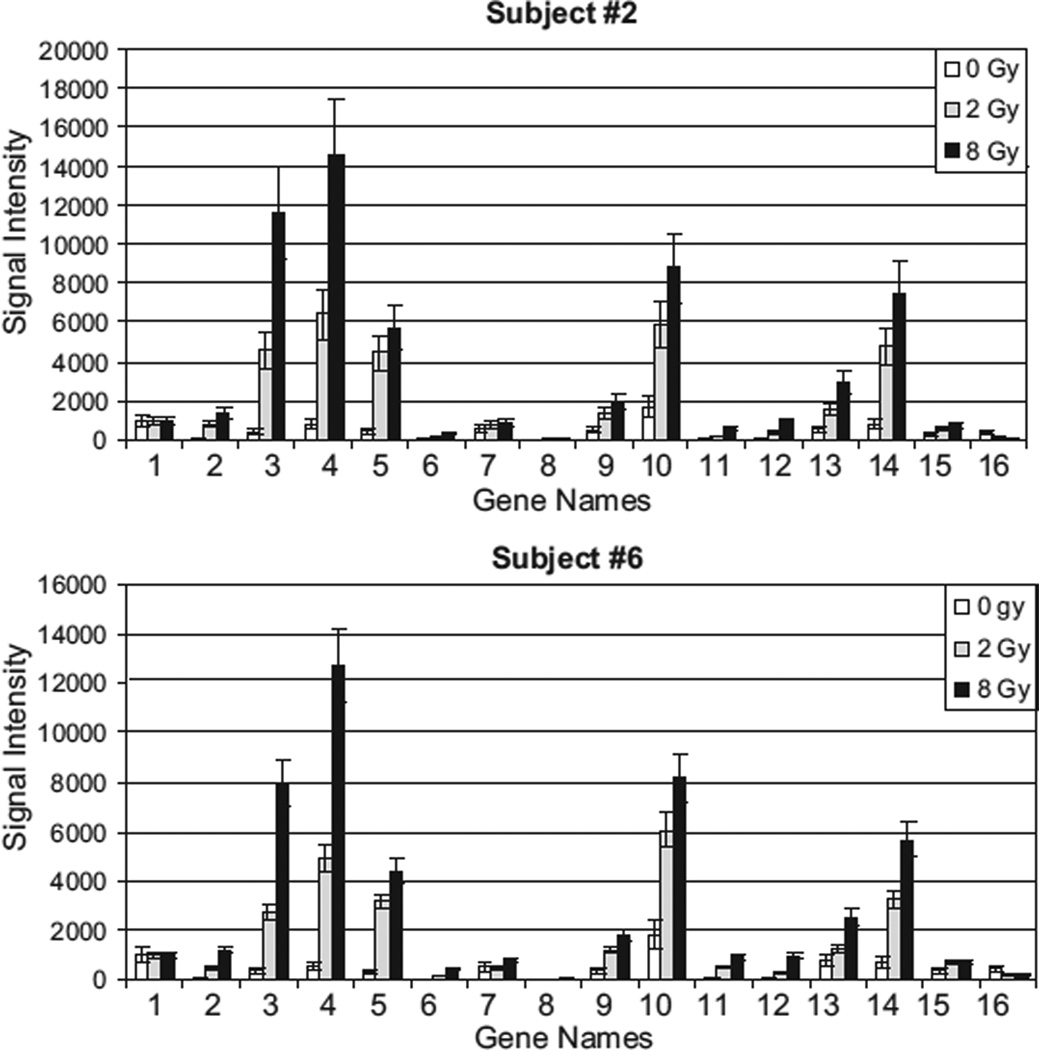
In this initial study, the responses of the 16 genes of the radiation array were monitored, sampling the mRNA from cells allowed to react to the irradiation under culture conditions for 24 h after exposure to the doses of 2 and 8 Gy. The irradiation was performed on freshly drawn whole blood. In order to validate the assay, the qNPA was initially done on purified RNA from the whole blood samples. This will allow comparison of future microfluidic platforms with the different plate based platforms. In this experiment, a clear dose response for all the genes was observed. Myc was chosen as a down-regulated gene (gene 16) (Fig. 5). All the other genes were anticipated to be up-regulated in response to radiation, and it was observed that their expression increased with the dose of radiation received (Fig. 5). These results showed that by using the qNPA, it is possible to separate the irradiated vs. the non-irradiated samples. Also a similar gene expression profile dose response was observed between the different volunteers (Fig. 5). Next, the same experiment will be performed on a larger number of volunteers and using a broader range of different radiation doses in order to demonstrate the robustness of the assay platform. The combined results will be compared with existing gene expression platforms (e.g., whole genome array from Agilent) to completely validate the assay for rapid biodosimetry.
Fig. 5.
Biodosimetry on RNA extracted from whole blood samples. 2 ml of blood was collected from each subject for each dose of radiation. Results from subjects #2 and #6 are represented. The blood samples were irradiated at 0, 2, and 8 Gy. After ON incubation of the blood samples, RNA was extracted. The signal intensity represents the transcript levels of the 16 genes obtained from the qNPA run on these RNA.
CONCLUSION
The technologies available today for biodosimetry are not easily adapted to rapid high-throughput measurements. The authors are developing a completely self-contained radiation biodosimeter suitable for screening from a small volume of blood. Only a very small volume of blood is necessary (fingerstick), which allows classifying this method as “micro-invasive.” In recent decades, advances in radiation imaging and radiation therapy led to dramatic increases of the number of people exposed to radiation. Radiation is an effective anti-cancer therapy but leads to severe late radiation toxicity in 5–10% of patients (Svensson et al. 2006). The possibility of radiation-induced cancer is a worrisome risk for patients exposed intentionally to radiation and to anyone who might have suffered accidental exposure.
Today, the assay using the quantitative nuclease protection assay allows distinguishing the in vitro irradiated vs. the non-irradiated blood samples. This integrated platform, using a molecular bioassay, will be able to deliver the data in less than 12 h. In addition, the cost of this assay (16-spot array) at a volume of 200,000 samples/wk would be less than $7/sample (excluding costs for sample collection and shipping). This assay is currently designed with a small density array. In the near future further gene signatures will be implemented by adding new genes to cover larger ranges of radiation dose with accurate estimation of dose across the range. The proposed platform has been developed to handle up to 100 genes if necessary. RA-I gives a good dose response for radiation exposures that are less than 8 Gy. The development of a refined set of gene signatures that would be appropriate to detect both higher and lower doses of radiation will be useful for further validation studies that include examining the effect of confounding factors in the level of expression of the gene panel. Meanwhile, FDA pre-IDE filing has been initiated for the methods, technology and gene set for the quantification of radiological exposure.
Acknowledgments
We thank Bradley Fox for helpful discussions and the members of the manufacturing and design team at the Center for the cartridge prototyping. We also thank the members of Scottsdale Medical Imaging Ltd (SMIL) Research Institute and Scottsdale Clinical Research Institute. This work was performed at the Center for Applied Nano-Bioscience at Arizona State University’s Biodesign Institute. This work was supported by the Center for High-Throughput Minimally-Invasive Radiation Biodosimetry (National Institute of Allergy and Infectious Diseases Grant U19 AI067773) and by the National Institutes of Health (Grant CA 49062). R. K. was also supported by a research grant from the Ibis Foundation for Personalized Medicine in Arizona.
REFERENCES
- Amundson SA, Do KT, Shahab S, Bittner M, Meltzer P, Trent J, Fornace AJ., Jr Identification of potential mRNA biomarkers in peripheral blood lymphocytes for human exposure to ionizing radiation. Radiat Res. 2000;154:342–346. doi: 10.1667/0033-7587(2000)154[0342:iopmbi]2.0.co;2. [DOI] [PubMed] [Google Scholar]
- Amundson SA, Bittner M, Meltzer P, Trent J, Fornace AJ., Jr Biological indicators for the identification of ionizing radiation exposure in humans. Expert Rev Mol Diagn. 2001a;1:211–219. doi: 10.1586/14737159.1.2.211. [DOI] [PubMed] [Google Scholar]
- Amundson SA, Bittner M, Meltzer P, Trent J, Fornace AJ., Jr Induction of gene expression as a monitor of exposure to ionizing radiation. Radiat Res. 2001b;156:657–661. doi: 10.1667/0033-7587(2001)156[0657:iogeaa]2.0.co;2. [DOI] [PubMed] [Google Scholar]
- Amundson SA, Lee RA, Koch-Paiz CA, Bittner ML, Meltzer P, Trent JM, Fornace AJ., Jr Differential responses of stress genes to low dose-rate gamma irradiation. Mol Cancer Res. 2003:1445–1452. [PubMed] [Google Scholar]
- Amundson SA, Grace MB, McLeland CB, Epperly MW, Yeager A, Zhan Q, Greenberger JS, Fornace AJ., Jr Human in vivo radiation-induced biomarkers: gene expression changes in radiotherapy patients. Cancer Res. 2004;64:6368–6371. doi: 10.1158/0008-5472.CAN-04-1883. [DOI] [PubMed] [Google Scholar]
- Blakely WF, Salter CA, Prasanna PG. Early-response biological dosimetry–recommended countermeasure enhancements for mass-casualty radiological incidents and terrorism. Health Phys. 2005;89:494–504. doi: 10.1097/01.hp.0000175913.36594.a4. [DOI] [PubMed] [Google Scholar]
- Dressman HK, Muramoto GG, Chao NJ, Meadows S, Marshall D, Ginsburg GS, Nevins JR, Chute JP. Gene expression signatures that predict radiation exposure in mice and humans. PLoS Med. 2007;4:e106. doi: 10.1371/journal.pmed.0040106. [DOI] [PMC free article] [PubMed] [Google Scholar]
- Fornace AJ, Jr, Amundson SA, Bittner M, Myers TG, Meltzer P, Weinsten JN, Trent J. The complexity of radiation stress responses: analysis by informatics and functional genomics approaches. Gene Expr. 1999;7:387–400. [PMC free article] [PubMed] [Google Scholar]
- Fornace AJ, Jr, Amundson SA, Do KT, Meltzer P, Trent J, Bittner M. Stress-gene induction by low-dose gamma irradiation. Mil Med. 2002;167:13–15. [PubMed] [Google Scholar]
- International Atomic Energy Agency. Biological dosimetry: chromosomal aberration analysis for dose assessment. Vienna: IAEA; 1986. [Google Scholar]
- International Atomic Energy Agency. Use of electron paramagnetic resonance dosimetry with tooth enamel for retrospective dose assessment. Vienna: IAEA; IAEA-TECDOC; 2002. p. 1331. [Google Scholar]
- Liu RH, Yang J, Lenigk R, Bonanno J, Grodzinski P. Selfcontained, fully integrated biochip for sample preparation, polymerase chain reaction amplification, and DNA microarray detection. Anal Chem. 2004;76:1824–1831. doi: 10.1021/ac0353029. [DOI] [PubMed] [Google Scholar]
- Martel RR, Bostros IW, Rounseville MP, Hinton JP, staples RR, Morales DA, Farmer JB, Seligmann BE. Multiplexed screening assay for mRNA combining nuclease protection with luminescent array detection. Assay Drug Dev Technol. 2002;1:61–71. doi: 10.1089/154065802761001310. [DOI] [PubMed] [Google Scholar]
- Paul S, Amundson SA. Development of gene expression signatures for practical radiation biodosimetry. Int J Radiat Onc Biol Phys. 2008;71:1236–1244. doi: 10.1016/j.ijrobp.2008.03.043. [DOI] [PMC free article] [PubMed] [Google Scholar]
- Svensson JP, Stalpers LJ, Esveldt-van Lange RE, Franken NA, Haveman J, Klein B, Turesson L, Vrieling H, Giphart-Grassler M. Analysis of gene expression using gene sets discriminates cancer patients with and without late radiation toxicity. PLoS Med. 2006;3:e422. doi: 10.1371/journal.pmed.0030422. [DOI] [PMC free article] [PubMed] [Google Scholar]
- Zavoiskii E. Paramagnetic absorption of a solution in parallel fields. J Phys (Moscow) 1944;8:377–380. [Google Scholar]


