

Abstract
Here we address two recent commentaries on our finding of an anticipatory trial-related signal that could not be predicted by concurrent electrode recordings. In addition, we offer a broad discussion regarding what our findings do and do not say about local neural activity underlying imaging signals.
Introduction
We are pleased to see the interest generated by our paper, and by the number of commentaries both formal and informal that our work has triggered. We particularly appreciate this opportunity that the editors of Neuroimage have afforded us, of responding to two commentaries in Neuroimage, one by Kleinschmidt and Muller (2010), and the other one by Handwerker and Bandettini in the current issue (). Before responding to the specific comments, however, we would like to start with a broader discussion of our published results and their implications. It is likely that some of the critiques of our work have arisen from an over interpretation of our results beyond what we had implied. We would like to take this opportunity, therefore, to also clarify what we are not saying.
Our published results and their implications
We demonstrated earlier (Sirotin and Das, 2009) that the hemodynamic signals in V1 (primary visual cortex) of alert behaving animals contain at least two distinct components. One component – the ‘conventional’ stimulus-evoked component – is reliably predicted by convolving the concurrently recorded spiking or high gamma band LFP activity with a hemodynamic response function (HRF) that is essentially constant across different recording sites and different animals. But in addition, during periodic visual tasks, we found a hemodynamic signal at the periodicity of the behavioral trials that is locked to trial onsets and is independent of visual stimulation. In clear distinction to the visually evoked component, this trial-related signal could not be predicted from concurrent spiking or high gamma LFP. (We also searched systematically through LFP wave bands down to 2 Hz to see if the LFP at any other band could predict the trial-related signal through a causal HRF kernel; we were hoping to see a double dissociation where spiking and high gamma would predict the visually evoked signal while some other LFP band would predict the trial-related signal; we failed to identify any LFP band that could do so reliably).
The primary conclusion that we wanted to convey from our findings is that the trial-related signal reflects a neural mechanism different from that underlying visually evoked hemodynamics. The brevity of the Nature Letter format did not allow us to go into an extended discussion. But we wanted to be very clear about this implication in our paper. As we stated there, our findings point to the likelihood that there is no ‘uniform linear predictive relationship between neuronal and hemodynamic signals;’ and that one could not assume that ‘equal increases in hemodynamic signal (imply) equal increases in the underlying neuronal activity’ But that is all. We emphatically do not want to conclude that the trial-related signal is ‘not neuronal’ or is ‘independent of neuronal activity’ as imputed by some of the commentaries on our work. Our point was to emphasize that the mechanism must be distinct and could not be modeled using the same linear kernel that works very well for visually evoked hemodynamics. Note that this statement is independent of the fact that, in addition, we failed to find any other LFP band that predicted the trial-related signal. The distinction between trial-related and visually evoked signal would have held even if we had found an LFP band that predicted the former and not the latter.
The statement that any mechanism underlying the trial-related signal is likely neuronal but different from feedforward still leaves important issues to be resolved when interpreting brain images. Our work since publishing the Nature paper has further sharpened the distinction between visually evoked and trial-related signals (manuscript in preparation). In particular, we found that the visually evoked component of hemodynamics is largely linearly predictable from spiking responses using a fixed HRF; this linear relationship holds true over a comprehensive range of spiking responses: we determined this by systematically varying stimulus contrast over 5 (base-2) log orders of magnitude up from baseline to 100%. The trial-related signal, on the other hand, had a character very different from the lawful, linearly predictable visually evoked signal. Its time course was determined by the trial period; and it had a fixed amplitude on any given experiment, essentially independent of the strength of visual stimulation and the consequent visually evoked spiking. Further, over our population of recordings the trial-related signal was, on average, 37% as strong as the strongest visually evoked signal (Supplementary Fig. S5, Sirotin and Das, 2009), and it can dominate weaker visually evoked signals. It is not clear if, by any measure, the neuronal mechanism underlying the trial-related signal is equivalent in strength to the spiking responses underlying a visually driven signal of corresponding magnitude. Thus even though this trial-related signal is likely neuronal in origin, it needs to be treated very differently from visually evoked signals when interpreting the overall hemodynamic response. To get a reliable prediction of the concurrently recorded neural activity, it is necessary to subtract away and thereby correct for this trial-related signal; else the neuronal signal predicted by deconvolving with an HRF is systematically poorly matched with the measured spiking.
In future studies it is necessary to explore a number of possibilities as to the mechanism driving trial-related hemodynamics. Unlike feedforward input, this ‘trial-related signal’ mechanism apparently does not activate the chains of principal neurons in V1 that likely dominate extracellular spiking and high gamma LFP. This alternate mechanism could, for example, reflect neuromodulatory input from some brain stem center that keeps track of behavioral timing. Or it may reflect feedback from some higher cortical center. Further, this presumed non-feedforward input might act preferentially not on pyramidal cells but on interneurons or on astrocytes. And along with other mechanisms one also needs to consider the possibility of direct neuromodulatory control of blood vessels. It has been proposed, for example, that dopamine can control cortical penetrating arterioles and capillaries without involving any local neuronal intermediaries (Krimer et al., 1998). So without further evidence one cannot rule out such a possibility, either, as the basis for the trial-related signal (‘distal neuromodulatory control of cerebral arteries’ as suggested in the discussion of our Nature paper).
Our strongest and most general conclusion, therefore, is that hemodynamic signals in alert individuals engaged in a task are a complicated resultant of multiple neuronal processes that are likely not equivalent to each other on any common measure (e.g. energy consumption). Thus fMRI images obtained in such behavioral contexts need to be interpreted with some caution. It may not be possible to make a 1:1 quantitative match between the imaging signal and local neuronal activity without some additional, independent information regarding different components of the imaging signal. In this we believe that our views mirror those of colleagues in the imaging community even if we may differ in our emphasis on particular details. We hope that our clarifying statements above will help all of us focus on the more important task of trying to understand the complexities of the imaging signal.
Responses to individual commentaries
Kleinschmidt and Muller
Kleinschmidt and Muller start with the premise that electrode recordings should predict hemodynamics just as well in the dark as they do with visual stimulation. They suggest that the apparent mismatch we reported arises due to a sampling problem which led to our collecting inappropriate samples of both the hemodynamic signal and the electrode signal in dark-room trials. Unfortunately, their argument is based on an assumption about the spatial shape of our trial-related signal that is not borne out by what we observed. Our published data – Fig. 1 and the supplementary movie in Sirotin and Das (2009) – offer a clarification. We are also in the process of providing a more detailed analysis in a separate manuscript that should elucidate the issue considerably further.
Fig. 1.
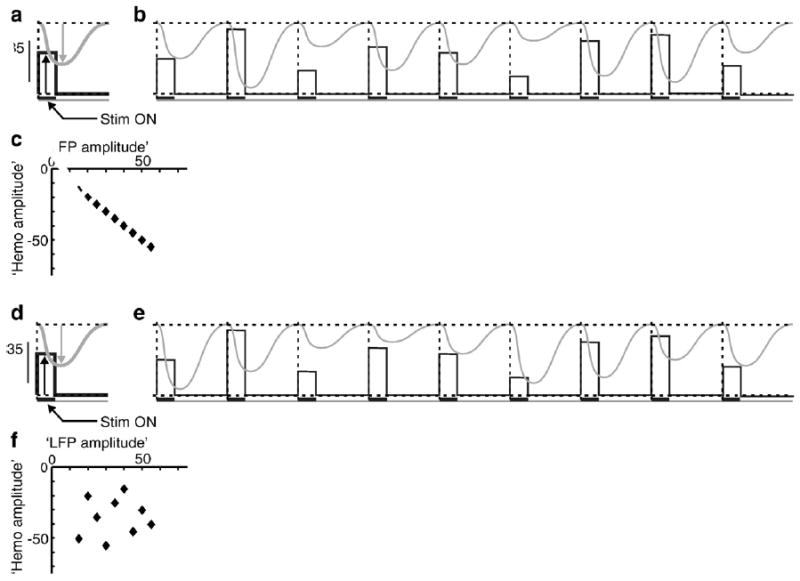
Schematic for ascertaining predictive relationship between two signals across a series of trials. a: Schematic of ‘mean LFP’ (black) and ‘mean hemodynamic’ (grey) signals averaged over a sequence of trials. Note that the ‘LFP’ is measured from baseline up (black arrow), while the ‘hemodynamic’ signal is a negative-going signal (grey arrow) with baseline at the top of the figure. Schematic based on the hemodynamic signal (local blood volume) shown in Fig. 2 of Sirotin and Das (2009), where increased blood volume leads to increased absorption of light and thus reduction of the light reflected off the cortical surface. Dashed vertical line marks trial boundaries. Black horizontal bar below the ‘LFP’ trace indicates stim on. The mean amplitudes of the two signals are chosen, arbitrarily, to be the same. b: A schematic sequence of ‘raw’ LFP and hemodynamic trials, chosen so that their amplitudes vary linearly with each other while their means equal the corresponding mean trace in panel a. c: ‘Hemodynamic’ vs. ‘LFP’ amplitudes for the 9 trials shown; the two are on a linear regression line of slope − 1 and R2=1, indicating a reliable predictive relationship. d–f: A The same sequence of ‘LFP’ but with the ‘hemodynamic’ amplitudes randomly permuted from the earlier set (panel e). This preserves the mean (panel d) while the signal amplitudes are now uncorrelated with each other, trial by trial (panels e, f). Here the ‘LFP’ is unlikely to predict the ‘hemodynamics.’ Calculating a kernel based on just the mean signals (panels a, d) cannot distinguish between these cases.
Kleinschmidt and Muller base their critique on the fundamental assumption that the dark-room, trial-related hemodynamic signal we report has a Mexican Hat-like center-surround profile centered on the fovea and that our imaging window lies on the sloping flanks of this function, including its zero crossing. They propose this Mexican Hat shape based on the assumption that the trial-related signal must correspond to a spatially localized attention-like signal that has a positive peak at the attentional focus (the fovea, where the animal fixates) and a negative surround that suppresses distracters (visual stimuli, presented at ~2–3° of visual eccentricity for the visually stimulated trials). After making this assumption the authors then make a number of corollary assumptions and assertions. They state, first, that we must have located our electrodes at the zero crossing of the presumed Mexican Hat; this, they assert, explains the relatively weak and unstructured electrical signals we observed. In our paper we compare the electrode recordings with the spatially averaged hemodynamic signal (Fig. 2 of Sirotin and Das (2009)). Such an averaging, Kleinschmidt and Muller state, is again inappropriate because the spatial average gives a poor and unrepresentative measure of a hemodynamic signal with a highly structured spatial shape consisting of two regions of opposite sign separated by a zero crossing. The authors propose that these are the reasons why our recorded neural signal was uncorrelated with the mean dark-room hemodynamic response.
The dark-room hemodynamic signal that we recorded shows no evidence of the Mexican Hat shape assumed by Kleinschmidt and Muller. The signal was spatially flat and homogeneous over the entire imaged region of V1 (~10 mm dia of V1, representing ~1 deg to 5 deg in visual eccentricity). This can be appreciated in the ‘blank’ signal image in Fig. 1b of our paper, as well as in the published supplementary movie (Sirotin and Das, 2009) where we show the time course of the image over one trial period. Notably, there is no zero crossing in this image. In fact, by sampling from multiple image locations we found that the amplitude and time course of our blank or dark-room signal is essentially uniform across the imaged region. The entire imaged signal moves with a common time course and amplitude (arteries in the image have the same time course but a higher amplitude). It is because the signal is so spatially uniform that we decided to use the mean signal time course in subsequent calculations comparing hemodynamics to electrode recordings. An early draft of our Nature paper did contain a quantitative analysis demonstrating this spatial uniformity. The reviewers persuaded us to remove that material in the interest of saving space and because of the information already present in Fig. 1b and the supplementary movie. We are in the process of submitting a manuscript that includes this material.
In addition, we did perform the spatially resolved analysis suggested by Kleinschmidt and Muller, comparing the electrode recordings with samples of the hemodynamic signal from a 16×16 grid tiling the imaged region. We found that during dark-room trials, the electrode signal was, on the whole, poorly correlated with the hemodynamic signal sampled at any of the 16×16 image locations. By contrast, the same spatially resolved analysis gave a robust and reliable spatial pattern of correlation amplitude during visually stimulated trials. When stimulating with a small visual stimulus (grating patch) at the electrode tip we got, as expected, high correlation between neural activity and the hemodynamic signal at the electrode tip; this correlation fell off progressively with distance over several millimeters of cortex. Once again, space limitations prevented us from including this analysis in our Nature paper.
Thus the body of Kleinschmidt and Muller’s concerns is easily addressed by considering the spatial and temporal structure of the trial-related signal. We apologize that such an analysis was not included in the Nature paper, but our manuscript with this analysis is close to completion and we hope to have it available to the imaging community in short order.
Handwerker and Bandettini
Handwerker and Bandettini express a number of issues in a broad introduction. They follow this with a detailed critique of our paper. We largely agree with their introduction. In their detailed critique, they remark on the extreme paucity of our evidence. However, they seem to have overlooked some of our published supplementary figures. They then offer an alternate analysis of our data but that appears to contain some signal processing issues that make their conclusions hard to interpret. We would like to address both of these points later in this response.
First, however, we would like to emphasize our broad areas of agreement which comes across, we hope, in the introductory section ‘Our published results and their implications’. We want to underscore once again that we are not concluding that the trial-related signal occurs in the ‘absence of neuronal activity’ or is ‘independent of neuronal activity.’ We simply propose that it involves mechanisms distinct from feedforward input. We agree with Handwerker and Bandettini’s statement that ‘Reports that emphasize and examine possible variations on what is known about the fMRI signal and the hemodynamic response are interesting windows into understanding more subtle and complex relationships between neuronal activity, hemodynamics, and measured signal.’ They go on to say that our HRF fitting procedure assumes linearity in the relationship between neural and hemodynamic signals and a poor fit could indicate nonlinearity rather than a lack of a relationship. We agree. Our current work – referred to in our introductory section – shows that the visually evoked and trial-related signals differ sharply in their linearity. Rather than belaboring our earlier points any further we just want to reiterate that we are close to finishing a manuscript discussing these issues in detail. We hope that the paper will soon be available to the imaging community.
Next we would like to address the first part of Handwerker and Bandettini’s detailed critique. Here they criticize us for what they contend is the extreme paucity of our evidence showing that trial-related signals are poorly predicted by LFP. Before addressing the question of the quantity of evidence, we want to remind the reader that poor prediction of trial-related signals by LFP is a secondary part of our findings. Our primary conclusion was that the trial-related signal is different from visually evoked signals and needs to be treated differently when ascribing neuronal activity to hemodynamics. This distinction between these two signals would have held true even if we had found that LFP but not spiking predicted the trial-related signal.
However, Handwerker and Bandettini bring up the issue of the paucity of evidence many times. ‘The only presented evidence to support this statement is shown in Fig. 2a and supplementary Fig. 3 of their article.’ ‘… the authors only compare the average of 66–130 Hz LFP to hemodynamics. There are no references explaining why they averaged over this range of frequencies and they presented no data over other frequency ranges.’ ‘Sirotin and Das might have additional data to support their conclusions, but that data is not presented in their manuscript.’ But we did publish the results of fitting to multiple LFP bands down to 2 Hz in our supplementary figures. Supplementary Fig. 7 shows the fit to a broadly defined ‘lo-LFP’ range, 10–56 Hz. This LFP band turns out to be equally poor at predicting both visually evoked and trial-related hemodynamic signals. In addition to this average 10–56 Hz LFP, Supplementary Fig. 13 shows the results of systematic fits through a comprehensive set of more narrowly defined LFP bands down to 2 Hz (equal 6-Hz frequency bins: 2–8 Hz, 8–14 Hz, 14–20 Hz etc). For each band, separately, we did exactly the same analysis that is illustrated in Fig. 2 or Supplementary Figs. 3 and 7: we asked how well the LFP signal in that band can predict hemodynamics using a causal gamma-function-like kernel. The summary data are shown in Supplementary Fig. 13. Each of these LFP bands down to 2 Hz predicted the trial-related signal very poorly (R2 consistently less than 0.05) although they did predict the visually evoked signal somewhat better (R2~0.15 to 0.2). Note that at every one of the LFP bands, this analysis – comparing trial-related and visually evoked signal pairs – was repeated, separately, for each of our 28 electrode recording sites. It is true that our Nature paper came with a rather large body of supplementary material and that does present an extra burden for the reader. We apologize for that but given the novelty of our findings we felt it was important to present as much as possible of our evidence and analysis. We encourage readers to look at these supplementary figures before castigating us for not carrying out analyses that we have already published.
Fig. 2.
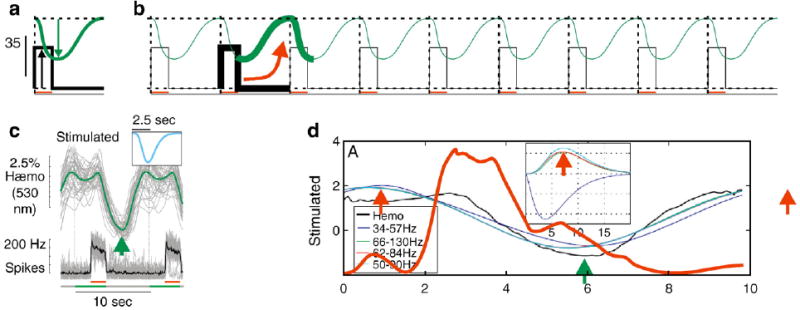
HRF kernels and possible source of misattribution in an exactly periodic sequence. a, b: Schematic of an exactly periodic series of ‘LFP’ and ‘hemodynamic’ signals (panel b) created by replicating the same ‘mean’ (panel a) as in Fig. 1. Because of the exact periodic nature of the sequence an algorithm for extracting an optimal kernel could erroneously link the ‘LFP’ with a phase-shifted section of the ‘hemodynamic’ signal (see arrow linking highlighted segments, panel b). Such a misattribution is unlikely to happen with the raw sequence of trials as in Fig. 1b because the sum square error would be much higher with such an erroneous kernel compared to the correct negative-going kernel. c: Panel reproduced from Fig. 2, Sirotin and Das (2009) showing the mean signals in trials with visual stimulation. Black: mean spike trace; green: mean hemodynamic, i.e. local blood volume, increasing to a (negative) peak of increased blood volume near the location of the green arrow. Inset shows the optimal kernel for this experiment. d: Fig. 3A from Handwerker and Bandettini (this issue), along with the ‘96 Hz LFP’ time series (red) from their Fig. 1C. (Time series was traced by hand). Their 96 Hz signal is representative of the three ‘high frequency LFP’ signals used by them, with a roughly rectangular peak during stim on, i.e. 2–4 s post trial on. The ~7.5-s peak of the corresponding HRF kernel (red arrow, inset) would give a peak signal at about 11 s post trial on, i.e. the position of the red arrow at that time point lying outside the displayed trial. This time point appears to capture the hemodynamic signal returning to baseline, as is clear from the red arrow one period earlier, at the 1 s time point. This is distinct from the actual peak of the hemodynamic signal, indicated by the green arrow, corresponding to the green arrow in panel c.
It is also not clear by what Handwerker and Bandettini mean by stating that we only show some ‘kernel variations’ and that we ‘present only a few trials of data from a single recording in a single animal to support (our) conclusions.’ What we show is the following. Visually evoked signals can be predicted consistently and reliably by spiking or high gamma LFP. This means, first, that the optimal HRF kernels, calculated independently for each data set, match each other remarkably well across different recording sites and different experiments; and second, that the predicted hemodynamic signal matches the measured signal very well (high R2: 0.64 for spiking, 0.53 for high gamma, N=28 separate recording sites. Fig. 2 of Sirotin and Das (2009) for spiking, Supplementary Fig. 3 for high gamma). By contrast, for the trial-related signal, not only was the optimal HRF kernel unreliable (poorly matched from experiment to experiment) but the signal predicted using the optimal HRF consistently poorly matched the measured hemodynamics (low R2: 0.08 for spiking, 0.06 for high gamma). This is a very clear distinction between the visually evoked and trial-related signals and it involves much more than just showing ‘kernel variations.’ These calculations were done separately for 28 recording sites, with the number of trials at each site ranging from 20 to 100. Furthermore, as mentioned earlier, we repeated the same comprehensive analysis multiple times at each recording site, separately for each of the full set of 6-Hz LFP bands from 50 Hz down to 2 Hz (Supplementary Fig. 13). Indeed just the data shown in Fig. 2a is an average of 40 stimulated trials and 72 dark-room trials only some of which are shown in Fig. 2b. Incidentally, we allowed the optimization program to search for kernels over a wide parameter space. Our only imposed limit was that the latencies and time to peak of the kernel be greater than zero so it is unlikely that the kernel mismatch for the dark-room signal was simply due to local minima in a limited parameter space.
Handwerker and Bandettini then go on to provide an alternate analysis of one of our figures to suggest a reliable prediction of trial-related signals by LFP. While we agree with some of their premises their alternate analysis (Fig. 3 of their paper) appears to have some problems with the method they used for obtaining optimal kernels.
In their Fig. 1 Handwerker and Bandettini show signal time courses extracted from our published mean data. In their Fig. 2 they then compare the strengths of mean trial-related vs. visually evoked signals. They point out that there is significant trial-linked LFP power in some frequency bands even in the dark, with mean amplitude proportional to the mean dark-room hemodynamics. We agree completely. We also noted the same (possibly signals due to extraretinal V1 inputs related to fixation (Rajkai et al., 2008)? reward (Shuler and Bear, 2006)?); in fact, we hoped to find a double dissociation where LFP predicted the trial-related hemodynamics while spiking predicted the visually evoked signal. Our Figs. 1a–c in this commentary shows a schematic of our approach. We use this same approach for both visually evoked and trial-related signals. (Also see Sirotin and Das, 2009, Supplementary Fig. S2). As an additional point, the corollary schematic in Figs. 1d–f suggests reasons why it is important to look for a relationship across a full string of trials rather than the mean signal alone. This helps ascertain that the signal amplitudes predict each other, trial by trial, rather than simply happening to have the same periodicity. Unfortunately, by using this approach – i.e., by fitting the full string of trials – we failed to find any predictive relationship with any of the LFP bands we examined down to 2 Hz. Our negative results are described in Supplementary Figs. 7 and 13 of Sirotin and Das (2009).
Finally, Handwerker and Bandettini provide an alternate fit to the LFP and hemodynamic signal data extracted from our paper. They use this alternate fit to propose that LFP in one frequency band (34 to 57 Hz) predicts trial-related hemodynamics very well (their Fig. 3). We would like to note, at the risk of belaboring our main point once again, that such finding would still have been entirely consistent with our primary thesis of distinct neuronal mechanisms for visually evoked vs. trial-related hemodynamics.
Fig. 3.
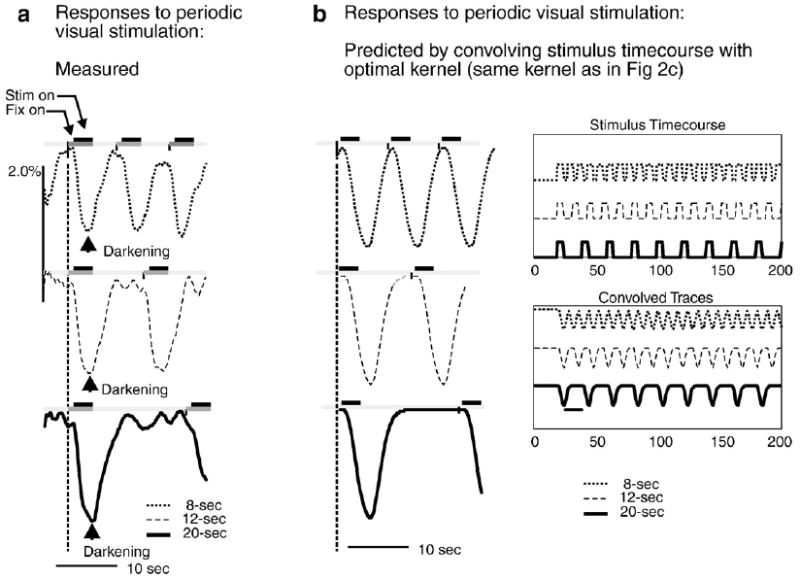
Negative-going HRF kernel correctly predict hemodynamic signal in trials of different periodicities. a: Measured hemodynamic responses to identical visual stimuli (100% contrast square wave gratings, 3 s on, 4c/deg) but at different interstimulus intervals (trial onsets separated by 8, 12 or 20 s periods for top, middle and bottom respectively). Arrowhead shows peak darkening (negative-going signal), i.e. peak increase in local blood volume triggered by first stim after time t=0 in each case. b: Prediction obtained by convolving HRF with model of stimulation. Stimulus Timecourse: modeled as rectangular positive-going 3-s pulses at 8, 12 or 20-s intervals; Convolved Traces: Output on convolving stimulus timecourse with experimentally obtained HRF kernel (same kernel as in Fig. 2c). Left: Trial-triggered averages, shown over one 20-s period. Compare with panel a showing experimentally obtained responses to visual stimulation at the same trial periodicities. (Reproduced from Supplementary Fig. 8, Sirotin and Das, 2009).
Unfortunately, their alternate analysis is hard to interpret because their procedure for calculating optimal kernels seems to have run into some problems. Note the shape of the visually stimulated kernel they get for their high frequency LFP bands (66–130 Hz, 62–84 Hz, 50–90 Hz in their Fig. 3). In each case their kernel is a positive signal peaking around 7.5 s. This means increased reflection of light off the cortical surface, i.e. a stimulus-evoked reduction in blood volume (since increasing local blood volume leads to increased light absorption at this wavelength. See Prahl, 2007). This is quite curious since visual stimulation is well known to lead to an increase in blood volume as reflected in the negative-going kernel we obtained (Fig. 2 of Sirotin and Das (2009). Also see Sirotin et al., 2009; Malonek and Grinvald, 1996; Vanzetta et al., 2004; Devor et al., 2003; Nemoto et al., 2004). We obtained our kernel by fitting the raw sequences of signals as indicated schematically in Fig. 1. Handwerker and Bandettini did something different: instead of using a raw sequence they constructed an exactly periodic sequence by taking our mean signal and replicating it multiple times. Our Figs. 2a,b suggests a reason why fitting such exactly periodic traces could lead to an erroneous kernel that is shifted some fraction of a trial period away from the correct solution. Fig. 2c reproduces our kernel and some relevant signal time courses from Fig. 2 in Sirotin and Das (2009). Fig. 2d collates some of Handwerker and Bandettini’s traces suggesting that the positive peak that they obtained may actually capture the hemodynamic signal returning to baseline. At the risk of belaboring this issue it is important to point out that using the raw, non-periodic data for fitting, as we did, is highly unlikely to run into similar problems. In the raw data the ‘correct’ kernel is (roughly) periodically present on each trial albeit at different amplitudes and is likely to emerge as the optimal fit; but an accidental kernel that straddles two trials will lead to large errors because of the amplitude jitter between trials.
To reinforce the point that the correct kernel is a negative-going signal, Fig. 3 shows signals from a separate experiment where we presented trials at three periods (8, 12 and 20 s) distinct from the 10-s period of the experiment cited by Handwerker and Bandettini. For each trial period, the recorded hemodynamics (Fig. 3a) are well matched by a predictor that convolves our optimal negative-going kernel with a rectangle wave modeling the corresponding visual stimulation (Fig. 3b; reproduced from Supplementary Fig. 8 of Sirotin and Das (2009)). We do not see how the positive kernel could generate the same match.
Finally, Handwerker and Bandettini have inadvertently provided material pointing to the likely weakness and ambiguity of the terms ‘activation’ and ‘deactivation.’ In their commentary, Muller and Kleinschmidt suggest that our observed trial-related hemodynamics would have easily been explained if only we had related the observed hemodynamics to standard fMRI ‘activation’ and ‘deactivation’ (Kleinschmidt and Muller, pg 624, first column, last para). On the other hand, Handwerker and Bandettini show that trial-related hemodynamic signals predicted from the high frequency LFP, using their kernel, would largely be of phase opposite to what we observed. They propose that this mismatch is an interesting issue to pursue (their third to last para); we suggest, in addition, that this mismatch reflects the problems that may be encountered on trying to interpret all increases vs. decreases of the fMRI signal in terms of a common underlying process of activation vs. deactivation.
Thus to summarize, we largely agree with Handwerker and Bandettini on the broad issues they bring up. Unfortunately their detailed critique of our paper has some problems. We hope that this commentary would help clarify the issues and help all in the imaging community to focus on the really interesting question of understanding the complexities of the hemodynamic signal.
Acknowledgments
The work was supported by National Institutes of Health (NIH) Grants R01 EY019500 & R01 NS063226 to A.D, and a National Research Service Award to Y.B.S. as well as the Columbia Research Initiatives in Science and Engineering, the Gatsby Initiative in Brain Circuitry, and The Dana Foundation Program in Brain and Immuno Imaging (to A.D.).
References
- Devor A, Dunn AK, Andermann ML, Ulbert I, Boas DA, Dale AM. Coupling of total hemoglobin concentration, oxygenation and neural activity in rat somatosensory cortex. Neuron. 2003;39:353–359. doi: 10.1016/s0896-6273(03)00403-3. [DOI] [PubMed] [Google Scholar]
- Kleinschmidt A, Muller NG. The blind, the lame, and the poor signals of brain function—a comment on Sirotin and Das (2009) Neuroimage. 2010;50(2):622–625. doi: 10.1016/j.neuroimage.2009.12.075. [DOI] [PubMed] [Google Scholar]
- Krimer LS, Muly EC, Williams GV, Goldman-Rakic PS. Dopaminergic regulation of cerebral cortical microcirculation. Nat Neurosci. 1998;1(4):286–289. doi: 10.1038/1099. [DOI] [PubMed] [Google Scholar]
- Malonek D, Grinvald A. Interactions between electrical activity and cortical microcirculation revealed by imaging spectroscopy: implications for functional brain mapping. Science. 1996;272:551–554. doi: 10.1126/science.272.5261.551. [DOI] [PubMed] [Google Scholar]
- Nemoto M, Sheth SA, Guiou MW, Pouratian N, Chen JW, Toga AW. Functional signal- and paradigm-dependent linear relationships between synaptic activity and hemodynamic esponses in rat somatosensory cortex. J Neurosci. 2004;24(15):3850–3861. doi: 10.1523/JNEUROSCI.4870-03.2004. [DOI] [PMC free article] [PubMed] [Google Scholar]
- Prahl S. Tabulated Molar Extinction Coefficient for Hemoglobin in Water. 2007 http://omlc.ogi.edu/spectra/hemoglobin/summary.html.
- Rajkai C, Lakatos P, Chen CM, Pincze Z, Karmos G, Schroeder CE. Transient cortical excitation at the onset of visual fixation. Cereb Cortex. 2008;18:200–209. doi: 10.1093/cercor/bhm046. [DOI] [PubMed] [Google Scholar]
- Shuler MG, Bear MF. Reward timing in the primary visual cortex. Science. 2006;311:1606–1609. doi: 10.1126/science.1123513. [DOI] [PubMed] [Google Scholar]
- Sirotin YB, Das A. Anticipatory haemodynamic signals in sensory cortex not predicted by local neuronal activity. Nature. 2009;457:475–479. doi: 10.1038/nature07664. [DOI] [PMC free article] [PubMed] [Google Scholar]
- Sirotin YB, Hillman EMC, Bordier C, Das A. Spatiotemporal precision and hemodynamic mechanism of optical point-spreads in alert primates. Proc Natl Acad Sci USA. 2009;106(43):18390–18395. doi: 10.1073/pnas.0905509106. [DOI] [PMC free article] [PubMed] [Google Scholar]
- Vanzetta I, Slovin H, Omer DB, Grinvald A. Columnar resolution of blood volume and oximetry functional maps in the behaving monkey: implications for fMRI. Neuron. 2004;42:843–854. doi: 10.1016/j.neuron.2004.04.004. [DOI] [PubMed] [Google Scholar]