

Abstract
Diffusion tractography offers enormous potential for the study of human brain anatomy. However, as a method to study brain connectivity, tractography suffers from limitations, as it is indirect, inaccurate, and difficult to quantify. Despite these limitations, appropriate use of tractography can be a powerful means to address certain questions. In addition, while some of tractography's limitations are fundamental, others could be alleviated by methodological and technological advances. This article provides an overview of diffusion magnetic resonance tractography methods with a focus on how future advances might address challenges in measuring brain connectivity. Parts of this review are somewhat provocative, in the hope that they may trigger discussions possibly lacking in a field where the apparent simplicity of the methods (compared to their functional magnetic resonance imaging counterparts) can hide some fundamental issues that ultimately hinder the interpretation of findings, and cast doubt as to what tractography can really teach us about human brain anatomy.
Key words: anatomical connectivity, brain connectivity, diffusion tensor imaging (DTI), high-angular-resolution diffusion imaging (HARDI), tractography
What Can We Learn from Tractography?
What has a decade of diffusion magnetic resonance (MR) tractography taught us about human brain anatomy? To answer this question, it is important to realize what tractography actually measures, and to understand the limitations of such measurements. Everyone agrees that tractography is the only tool we currently have that allows us to visualize white matter trajectories in vivo and noninvasively, but one problem with tractography is that the very elements of anatomical connectivity that are poorly known in the human brain are the ones that are challenging for tractography. Among these we can list the following: finding the exact termination of connections, detecting collaterals, tracking the very dense network of horizontal intra-cortical connections, discriminating between afferents and efferents, detecting synapses, etc. Like ex vivo dissection, tractography is able to help us determine the location (e.g., central part) of white matter bundles. Determining the termination parts of these bundles is crucial for assessing site-to-site connectivity, but achieving this with accuracy is still a challenge for tractography. In this first section, we discuss these limitations in more detail. We then examine some of the successful applications of tractography that have been able to provide valuable information about anatomy despite these limitations.
The limitations
Radial and transverse accuracies
A crucial limitation of tractography is its inability to determine the precise origin/termination of connections in the cortex. There are two types of information about the end points of white matter connections, which we refer to as radial and transverse, that we would like to know with accuracy. Radial accuracy means determining the cortical layer(s) where a white matter connection ends up [synapse(s)]. While such information is highly functionally relevant, in that it can tell us, for example, about hierarchical levels of cortical organization (Hilgetag et al., 2000), diffusion magnetic resonance imaging (MRI) does not enable us to detect synapses. This is where tracing studies in nonhuman animals are invaluable. In practice, tractography algorithms use heuristics and/or macroscopic termination criteria, such as reaching the edge of the brain or a voxel of low anisotropy, so the end points of tractography-derived pathways do not necessarily reflect the end point of the tracts.
Transverse accuracy refers to the ability to determine where, throughout the brain, a connection first enters the cortex (or subcortical nucleus, but we will concentrate on cortical connections for the time being). This is important as it will allow us to determine which cortical area (or unit) is connected to which other, providing a useful anatomical framework within which to make sense of functional specializations and interactions (Passingham et al., 2002). Of particular interest are questions such as the following: Which cortical region/column receives/sends which connections? Does a bundle of axons spread when it reaches the cortex? Do long association tracts send/receive adjunct connections? Is a bundle of axons a continuous long range connection between remote regions, or a succession of short U-shaped fibers? These questions vary in difficulty. For example, connections should be easier to pin down to regions than to columns or other sub-regional structures. However, achieving fine-grained transverse accuracy is difficult for tractography not only because of limits to spatial resolution but also because our measures are noisy and indirect. We will come back to the question of transverse accuracy when we discuss gray matter functional localization using tractography.
Dealing with errors and quantifying accuracy
Although (at least some) tractography methods can put forward an answer to (at least some of) the questions raised above (Catani et al., 2005; Frey et al., 2008; Rushworth et al., 2006), there is currently no framework for quantifying the confidence of our answers. This is due to the fundamental limitation of all diffusion MR tractography algorithms: they rely on water diffusion as an indirect probe of axon geometry. More specifically, they assume that the direction of least hindered diffusion [or principal diffusion direction (PDD)] is aligned with that of the axons. This is the main assumption made by tractography algorithms that rely on diffusion tensor imaging (DTI). While such an empirical assumption seems reasonable at the level of the axon, it has a number of practical consequences at the imaging scale. Running tractography in its simplest form equates to tracing the route of lowest hindrance to diffusion, not the route of axons (it should perhaps have been called diffusography!). This means that it is hard to distinguish, for example, branching from merging or kissing axons (Fig. 1). More elaborate models of axon-diffusion mapping, based on high angular resolution diffusion imaging techniques, extend the concept of a single PDD to mixtures of PDDs, allowing for several principal diffusion orientations (and hence axon orientations) within the same voxel (Seunarine et al., 2009). Although these techniques have improved the accuracy of tractography algorithms for detecting secondary white matter pathways (Behrens et al., 2007), the detailed geometry of axons within a voxel remains often ambiguous when looked at using diffusion (Fig. 1). In the white matter, these ambiguities can cause tractography algorithms to jump between different white matter tracts, making long-range connections hard to interpret. Near the cortex, ambiguities in the mapping between axon geometry and water diffusion make it very hard to determine the termination points with accuracy (Fig. 1).
FIG. 1.

Cartoon illustrations of ambiguities in mapping diffusion to axon geometry, and their consequences for tractography. Top left: Different axon geometries can lead to a similarly oriented tensor. The Tensor's principal direction is the same for all cases, but modeling crossing fibers helps distinguish a few of the cases. Modeling fiber fanning separates the top two geometries. Further modeling the polarity of a fanning can help separate all cases. Top right: Illustration of the asymmetry in tracking when fanning polarity is modeled locally. Bottom left: Illustration of a case of kissing fibers, where the local model is one of crossing fibers. Tractography will lead to jumping between the tracts, causing false positives. Bottom right: case of ambiguities near the cortex. Both axon configurations lead to the same diffusion profile (and hence the same tracking results), but have very different implications in terms of the actual connectivity.
All the above issues in mapping the diffusion profile into intra-voxel axon geometry can cause tractography algorithms to produce what people may refer to as false positives and false negatives (Catani, 2007). It is perhaps worth pointing that these are not false positives and negatives in the common statistical sense. Instead, they are mis-estimates of connectivity due to modeling errors. For example, in probabilistic tractography, they are samples from a posterior distribution that does not accurately represent the underlying ground truth. While a statistical framework (e.g., a noise model) allows us to control errors due to noise (we will get back to these later), modeling errors are in insofar-unknown proportions; we have no statistical framework to be able to control them, especially in the absence of ground truth.
Determining polarity
A fundamental limitation of tractography is that it is unable to tell us about the polarity of a given connection. Whether an axon is afferent or efferent does not affect water diffusion. One might argue that this is not such an issue since, on the one hand, the majority of cortico-cortical connections in the macaque cortex are reciprocal (Felleman and Van Essen, 1991), and on the other hand cortico-subcortical pathways' polarity is quite well characterized. Further, and at the level of resolution that is accessible to diffusion MR at the moment [i.e., millimeter scale, ∼105 axons per voxel (Aboitiz et al., 1992)], an answer to the question of polarity may not be very informative: within a voxel that contains a bundle of parallel axons, there will be axons running in both directions. Nevertheless, while distinguishing afferents and efferents spatially can undoubtedly open up important applications (e.g., structural changes will predict different functional changes depending on polarity), such information is unavailable to diffusion MRI and tractography. Perhaps a multi-modal approach can successfully tackle this difficult question, where diffusion tractography may provide information on the location of the tracts, whereas other techniques [such as Magneto-encephalography (MEG)] could inform us about polarity (Stufflebeam et al., 2008).
What we have learned
Advances in methods and data acquisition will undoubtedly help reduce the impact of some of the limitations, as we will discuss in the next section of this article. However, in spite of tractography's limitations, there have already been significant advances in our understanding of brain anatomy when asking the right questions. The key insights have come from exploiting the main strength of tractography methods: their ability to tell us where the tracts are.
Localizing white matter tracts
Diffusion tractography is suitable for localizing white matter tracts. Looking at a color-coded map of the PDD derived from DTI (Pajevic and Pierpaoli, 2000), we can promptly recognize some of the major axon bundles (Fig. 2). We are able to say with confidence where, for instance, the arcuate fasciculus is situated relative to the cortico-spinal tract. We can also tell, using adequate crossing-fiber low-level modeling, whether a voxel is likely to contain a mixture of the above tracts or not.
FIG. 2.
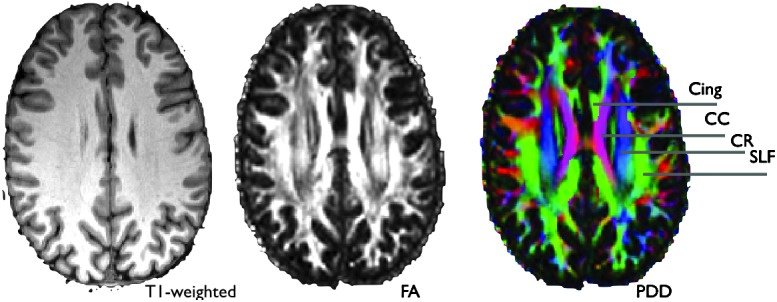
Example of diffusion tensor imaging-derived images that show the extra white-matter contrast gained by capturing diffusion anisotropy. The PDD (principal diffusion direction) map on the right is colored according to Red, left-right; Green, anterior-posterior; Blue, superior-inferior. Cing, cingulum bundle; CC, corpus callosum; CR, corona radiata, SLF, superior longitudinal fasciculus.
Tractography's ability to localize (and name) white matter tracts has been used extensively as a guide for region of interest (ROI) analysis of white matter (Gong et al., 2005a; Goodlett et al., 2009; Jbabdi et al., 2010; O'Donnell et al., 2009; Smith et al., 2006, 2007; Yushkevich et al., 2008). Tractometry, a term we could coin for these techniques that consist of making tract-specific measurements, was one of the first fruitful applications of diffusion MR tractography (Berman et al., 2005; Gong et al., 2005b; Jones et al., 2006). Tractometry has been used to study brain development (Eluvathingal et al., 2007; Huang, 2010), ageing (Davis et al., 2009; Hasan et al., 2010; Hsu et al., 2010; Michielse et al., 2010; Sala et al., 2010), clinical markers (Ciccarelli et al., 2008; Johansen-Berg, 2010; Johansen-Berg and Behrens, 2006; Yamada et al., 2009), structural correlates of behavior (Johansen-Berg, 2010), etc. The idea is to simply use tractography as a means of determining regions of interest in the white matter, and then make quantitative measurements within those ROIs. A recent example is the study by Lebel, Caverhill-Godkewitsch, and Beaulieu (Lebel et al., 2010), who used tractography to subdivide the corpus callosum into regions connecting different lobes. They then calculated fractional anisotropy (a micro-structural indicator of white matter integrity derived from DTI), in each of the subdivisions throughout human life span in a cross-sectional cohort. Their results show that all the subdivisions followed an inverted U-shaped pattern, but that they peaked at different times, suggesting varying maturation dynamics across different commissural axons (Fig. 3a). Another benefit of using tractography to determine white matter ROIs is in matching white matter location across subjects for averaging (a.k.a. registration). In cases where the bundles under consideration have a simple geometry (e.g., the cingulum bundle), position along the bundle can be parameterized, greatly simplifying the inter-individual correspondence problem (Fig. 3b).
FIG. 3.

(a) Example use of tractography to define regions of interest in the corpus callosum for quantitative measurements of FA through life-span [adapted from Lebel et al. (2010)]. (b) Tractography of the cingulum bundle allows parameterization of position along the tract. This enables better inter-subject registration for averaging and statistics [adapted from Gong et al. (2005a)].
Localizing gray matter functional units
Another successful application of tractography has been for subdividing gray matter (Fig. 4). While postmortem myelo- and cyto-architectonic studies are a great tool to find functional subdivisions, it was recognized early on that macroscopic landmarks (folds) are not necessarily a good indicator for subdivisions within a given individual. Cyto-architectonic sub-divisions therefore cannot easily be transferred into studying the living functional brain. On the other hand, it is easy to imagine that the extrinsic connections of cortical areas can, to some extent, determine the function (pattern of activity) of a brain region, and therefore that each region will have a distinct and hence distinctive pattern of connections (Passingham et al., 2002). Exploiting this principle, tractography has been used to segregate gray matter according to the route of its white matter projections (extrinsic connectivity), both in the sub-cortex (Bach et al., 2011; Behrens et al., 2003b; Devlin et al., 2006; Johansen-Berg et al., 2005; Lehericy et al., 2004a,b; Sillery et al., 2005) as well as the cortex (Anwander et al., 2007; Beckmann et al., 2009; Johansen-Berg et al., 2004; Klein et al., 2007; Tomassini et al., 2007). Many of these studies have shown a remarkable degree of similarity between regional borders identified using tractography and various other methods, including histological atlases (Klein et al., 2007), functional MRI (fMRI) activation methods (Johansen-Berg et al., 2004, 2005), and other structural imaging modalities (Devlin et al., 2006).
FIG. 4.

(a) Gray matter parcellation of the thalamus (top left), cingulate (top-right), medial prefrontal (top-right), Broca's area (bottom left), and lateral premotor cortex (bottom right). (b) Example use of tractography and cortical parcellation of the subgenual cingulate for guiding surgical interventions. Black dots correspond to locations where electrical stimulations were effective. Figures adapted from (a) (Anwander et al., 2007; Beckmann et al., 2009; Behrens et al., 2003b; Johansen-Berg et al., 2004; Tomassini et al., 2007) and (b) (Johansen-Berg et al., 2008).
At this point, the reader may find our mentioning of gray matter parcellation using tractography in contradiction with our argument on the limited transverse accuracy of tractography algorithms. Indeed, how can we be confident in gray matter parcellation if we are not sure about where tracts terminate? While it is true that the accuracy of tracking ultimately determines the accuracy of gray matter parcellation, most tractography-based parcellation studies so far have shown a certain degree of robustness to tractography errors. To tell apart two brain regions on the basis of their connections, it is not always necessary to determine the full connection patterns of both regions; finding a subset of these patterns can be enough to distinguish them.
Visualizing white matter complexity
Finally, a more recent application of tractography shows the spectacular amount of detail of white matter anatomy that is available in diffusion MR data (Calamante et al., 2010, 2011). The approach takes advantage of the spatially continuous nature of tractography: despite the fact that data comes in discrete voxels, the reconstructed curves (through the diffusion field) are represented in continuous space. By counting the number of times a voxel is hit by curves, probabilistic tractography builds up a (spatial) histogram that represents the probability that a path of least hindrance to diffusion passes through a given voxel. Now, the information as to whether a curve passes through the middle of a voxel or a corner gets lost in the binning process: all curves crossing the same voxel are counted in the same way. However, if we make the bins (voxels) smaller, then we can start distinguishing such cases. Figure 5 shows one such map at a resolution of (0.25 mm)3 [based on data acquired at (2 mm)3]. The gain in spatial resolution through the tracking process gives an impression of seeing the routes of white matter fibers. Indeed, this technique is able, through the spatial integration process inherent in tractography, to separate white matter structures that are mixed within the same voxels in the original data.
FIG. 5.
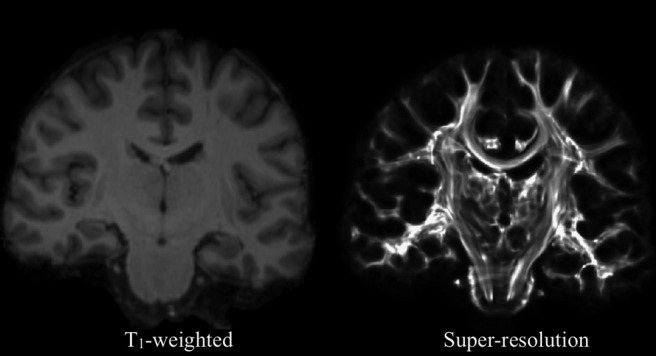
Comparison of a T1-weighted contrast (left) to the results of the super-resolution technique at 250 μm isotropic (right). Details of white matter architecture can be seen with the naked eye.
In summary, although current tractography methods do not track axons directly and have limited accuracy, it is clear that the ability to localize fiber bundles has been, and still is, of great help in understanding the structural organization of human white matter. However, we do not want to give the impression that the abovementioned applications are immune to tracking inaccuracies. For example, tractometry still relies on finding the pathways to calculate measurements on; errors in the delineation of the tracts will lead to difficulties in interpreting tractometry results. Also, as we have discussed above, the accuracy of tractography-based functional localization is determined by the accuracy of the tracking. Tractography should always be handled with care, and interpretation of results accompanied with caution.
The following section discusses some methodological advances that may take us closer to being able to make more accurate and quantifiable inferences on brain connectivity.
Methods: Are We Happy Yet?
In neuroimaging methods, the devil is always in the details. Methods that care about details are often the most successful ones. In tractography, there are three levels of methodology where details matter: low level (often voxelwise) modeling, the tracking itself (connecting the arrows), and the actual data. We highlight here some of these details, examine the status of current methods, and ask whether there is scope for further improvements that will matter for tractography as a tool for assessing connectivity.
Low level modeling
As we (and many others) have already stressed: tractography relies on the assumption that water diffusion reflects the underlying axonal (microscopic) geometry, but how much knowledge of the microanatomy does it provide us with, and how much is necessary to get an accurate estimate of connections? Can we bridge the gap between diffusion and axons?
Simple diffusion-axon mapping
In its original form, tractography relied on the diffusion tensor model (Basser et al., 1994). It proceeded by first fitting a Gaussian model for voxel-wise diffusion, then extracting the PDD (the direction of least hindrance to diffusion predicted by the model), and using it as a surrogate for axons' orientation within each voxel (Basser et al., 2000; Conturo et al., 1999; Jones et al., 1999a). Despite the success of this simple streamline technique in revealing very convincing white matter bundles throughout the brain (Catani and Thiebaut de Schotten, 2008), it became clear that the PDD was not always a good representation of fiber orientation. The architecture of white matter, despite a global appearance of order and smoothness, can contain a significant amount of local complexity. Axons tend to run in organized bundles that bend rather gently, but these bundles meet, merge, twist, bend, diverge, and cross throughout white matter. In a given voxel, several of these bundles may be present, and the PDD may not represent any of their orientations. This has triggered efforts into improving the low level modeling, searching for the distribution of fiber orientations within voxels [the fiber orientation distribution function (fODF)] from the diffusion profile [see (Seunarine et al., 2009) for a detailed account of these models, and (Behrens and Jbabdi, 2009) for their implications for tractography].
The first attempts were concerned with the problem of crossing fibers. Essentially, these approaches treat crossing fibers as a partial volume problem. Instead of modeling a single PDD, they model a number of directions of preferred diffusion, and estimate these directions (as well as the number of such directions) from the diffusion data (Assaf et al., 2004; Parker and Alexander, 2003; Tuch et al., 2002). Assimilating these mixed diffusion directions to discrete fiber orientations; tractography algorithms then use this information to track through one or more directions within each voxel depending on the direction of the approaching streamline. These low-level models have had a significant (qualitative) impact on tractography results. Several white matter bundles that were known to exist but were unseen in PDD approaches were revealed using the more complex crossing-fiber models, effectively decreasing the amount of false negative connections (Behrens et al., 2007).
Complex diffusion–axon mapping
Axon configurations within a voxel can, however, be more complex than simple crossing fibers. Several alternative local geometries can give rise to data that may seem akin to a crossing fiber-type architecture, but where other configurations may well be present. If we ignore these alternatives and use a crossing fiber model instead, we run into the problem of increasing tractography errors (Fig. 1).
So, what can we do? Crossing fibers are, in essence, a simple case of an fODF that has two or more peak orientations with non-zero probability, with all other orientations having probability zero. An extension of this model is to consider a more generic form for the fODF, allowing for a model that can distinguish between crossing fibers and spreading or fanning fibers. This is not a mathematical fantasy: cases of fibers spreading from each other are common in white matter. Axons in the internal capsule are tightly packed and confined to a rather narrow space, but they then spread out to reach various locations throughout the cortex, forming the corona radiata. The density of these tracts is lowered along their trajectory toward the cortex, while they are crossing other types of fiber bundles (commissures and association tracts). Another example is when tracts arrive at the cortex: axon bundles tend to fan-out when they reach the cortex. Modeling fanning fiber architectures is crucial for tractography for at least two reasons: (i) modeling a fanning configuration by simply using the mean orientation and ignoring the spreading is likely to induce false positives as well as false negatives; and (ii) explicitly accounting for these geometries will allow us to distinguish between fiber spreading and uncertainty in discrete fiber orientations (see later for why this is important).
Attempts have been made at inferring the continuous fODF from diffusion data, either by using various flavors of spherical deconvolution (Descoteaux et al., 2009; Tournier et al., 2007; Yeh et al., 2011) or by explicitly modeling the shape of the fODF (Kaden et al., 2007, 2008; Zhang et al., 2011). These fODF low-level models are already showing qualitative improvements in tractography (Descoteaux et al., 2009). None of these attempts has, however, accounted for the possibility of anisotropic (sheet-like) fanning, such as that seen in the corona radiata. This is likely to lead to the models underestimating fanning along one direction (along the sheet), and overestimating it along the other (across the sheet). Notwithstanding this technical detail that will probably be overcome in future models, accounting for fanning configurations is likely to prove important for tractography (see below), and will benefit considerably from advances in data acquisition (see further below).
Spatial models
Another apparently subtle but rather important aspect of local modeling is the idea of the polarity of a fanning. As exemplified earlier, axons in the corona radiata fan-out along their trajectory toward the cortex, but they converge in the other direction. It will be important to account for this asymmetry, otherwise tractography algorithms will lead to a fanning-out of streamline trajectories when tracking in both directions, introducing false positives on one side and false negatives on the other. However, diffusion MRI being a symmetric directional measurement, it is impossible, by looking at voxel-wise data alone, to determine or model the polarity of a fanning. Indeed, how can we fit an asymmetric model to symmetric data?
There has been one attempt (as far as we know) in the literature to tackle this issue (Savadjiev et al., 2008). Although the authors have used a crossing-fiber instead of a fanning-fiber model in their article, the idea is still valuable and can potentially be generalized to fanning models. It is based on the realization that, although there is no information in the voxel-wise data to determine the polarity of diverging fibers, it is still possible to get such information by looking at a voxel's neighborhood (Fig. 1). Generalizing this approach to combined crossing and fanning models (e.g., two fanning fibers crossing at some angle) is likely to be difficult. Simple geometric rules to determine whether the local neighborhood supports fanning in one or the other direction, while feasible in the case of one fiber population per voxel, may become computationally as well as conceptually challenging when modeling multiple fibers per voxel.
The idea of using spatial information to somewhat help or constrain tracking has been around implicitly in tractography algorithms. For example, in tracking through an orientation field from a crossing-fiber model, one may need to pick a candidate orientation amongst the crossing fiber categories within a visited voxel. The common approach is to choose the orientation that is closest to the current direction of tracking [alternative approaches exist, e.g., (Descoteaux et al., 2009)]. While this seems to be a reasonable choice in the white matter, it may not be appropriate when approaching the cortex. The geometry of cortical folds is likely to be accompanied by sharp bends and turns for axons to reach the cortical surface. Tractography algorithms that simply pick the closest orientation are likely to introduce biases. For example, more connections may be detected hitting the crown of a gyrus than its walls. This will obviously significantly limit the transverse accuracy that we discussed earlier. While it is likely that geometric models, potentially global in nature (i.e., combining information across voxels), may help solve these issues, it is not clear what form these models should have, and what type of spatial priors may be used to accurately represent the way axons enter the cortex.
Model-free approaches
Our presentation so far of low-level characterization of fiber orientations has focused on generative model-based approaches. Alternatives have also been suggested (Aganj et al., 2010; Descoteaux et al., 2007; Hess et al., 2006; Wedeen et al., 2008) and successfully applied to studying the architecture of white matter in humans (Hagmann et al., 2007) and non-human animals (Schmahmann et al., 2007). These approaches generally proceed by estimating a probability distribution on the sphere known as the diffusion ODF (dODF). This is the probability that a spin diffuses along each direction in space. Crucially, these approaches are termed “model-free,” in the sense that they estimate the dODF without making assumptions as to its form [e.g., diffusion spectrum imaging (DSI) (Wedeen et al., 2005) and Q-ball imaging (Tuch et al., 2003)]. Peaks of the dODF are assumed to correspond to fiber orientations and are used to guide tractography. Finally, these approaches have also been combined with deconvolution or ODF sharpening methods that attempt to reconstruct an fODF from the dODF (Tournier et al., 2004; Yeh et al., 2011). It is fair to say that, at the moment, model-based and model-free approaches suffer from the same limitations as to the accuracy of the subsequent tractography.
Errors and uncertainty
As we have seen, low-level modeling errors can (and do) lead to errors in the tractography itself. There are, however, at least two other sources of errors that will be important in the next section on the quantitative interpretation of tractography. We categorize these errors into noise and algorithmic errors.
Several methods have successfully been able to model measurement noise together with the diffusion profile and/or the fODFs (Behrens et al., 2003a; Berman et al., 2008; Jeurissen et al., 2011; Jones and Pierpaoli, 2005; Parker and Alexander, 2003, 2005; Sotiropoulos et al., 2010a). An explicit noise model allows us to calculate a confidence on the streamlining process, given the noise level and the low-level model [alternative model-free methods to estimate noise-related uncertainty also exist (Jones and Pierpaoli, 2005)]. In a crossing-fiber model, we can calculate a distribution that represents the uncertainty on the orientation of each of the crossing fibers [the uncertainty ODF (uODF)—(Behrens and Jbabdi, 2009)]. This local uncertainty then propagates into global uncertainty on the location of white matter tracts via tractography. It can be difficult to distinguish this uODF, which relates to a single underlying orientation, from a true spread in the fiber orientations, in which there is a continuum of potential orientations. Separating these two cases will be important for a more quantitative interpretation of tractography results (see next section).
Also, we insist here that this measure of uncertainty accounts for noise-related uncertainty. We have called it “uncertainty on the location of white matter tracts,” but it should really be understood as “uncertainty on the route of least hindrance to diffusion.” The extra uncertainty due to modeling errors (the discrepancy between diffusion and axons) remains unknown, and improved models attempt to help minimize it. In (Jones, 2010) the author relates the first source of error to the notion of precision and the second one to that of accuracy. The latter is the ultimate goal of tractography; the former is the one we can control at the moment.
The remaining source of error is related to the algorithmic aspects of tractography (Behrens and Jbabdi, 2009; Lazar and Alexander, 2003). Tractography can be seen as an integration process that is discretised. It involves, for example, the choice of an integration step and an interpolation scheme, both of which affect the accuracy of the results.
Fiber tracking
Advances in low-level local modeling should lead to improved tracking if tractography algorithms adapt to capitalize on these advances. For example, tractography algorithms could be designed to detect the local polarity of a fanning and adjust the choice of local fiber orientation accordingly. Another case is when modeling the fODF together with noise-related uncertainty: a probabilistic tracking algorithm needs to sample orientations from both ODFs (Behrens and Jbabdi, 2009). This will ultimately allow us to calculate not merely the confidence on the route of least hindrance to diffusion (as in current crossing-fiber models), but instead the confidence on the proportion of fibers running between two given locations (see quantitative section).
There are also cases where tractography can be used to improve local modeling. This is in the spirit of global approaches to tractography (Aganj et al., 2011; Jbabdi et al., 2007, 2008; Kreher et al., 2008; Parker et al., 2002; Reisert et al., 2011; Sotiropoulos et al., 2010b), in which the estimate of fiber orientation at a given voxel is informed by estimated orientations in that voxel's spatial neighborhood. The case of fanning polarity is a good illustration, as it is easy to understand that there is no information in the voxel-wise data as to what the orientation of the fanning is. Ultimately, we may even begin to model the spatial arrangement of axon bundles inside the voxels, an idea that may sound far-fetched, but the super-resolution method presented in Figure 2b shows that the sub-voxel information is richer than we might think.
In general, testing different local fiber bundle geometries (as opposed to local fiber orientations) against data will lead to more accurate models of the local fiber architecture, and hence improve our confidence in determining site-to-site connectivity. However, as illustrated in Figure 1, there are cases where it is very hard to imagine purely geometric models correcting for errors due to jumping between tracts in the white matter. It is likely that spatial or other types of priors will be required, although the form that such priors would take is still unknown.
There is another category of methods for improving the accuracy of tractography that we have not mentioned so far. These methods are related to the idea of imposing spatial priors. A straightforward type of such priors is to simply draw regions of interest to constrain the route of least hindrance to diffusion that is believed to represent the bundles of interest (Catani et al., 2002). Another type of such spatial priors is to compare generated tracts to a reference tract (e.g., from an atlas), and then select among the results on the basis of best similarity scores (Clayden et al., 2007; O'Donnell and Westin, 2007). Group-level tractography analyses can also serve as a means of imposing hierarchical-like spatial priors on individual tractographies (Yap et al., 2011).
We have so far discussed geometric models that account for mesoscopic features of white matter tracts. Other geometric approaches tackle the problem of modeling microstructure. In particular, these models use q-space diffusion data (Callaghan, 1991) to estimate, for instance, axon radii and density (Assaf et al., 2008). Whether these techniques are likely to be useful for tractography is still an open question, given, for example, the difficulties in obtaining appropriate data in vivo. There may be some interaction between tracking and microstructure, in that one could inform the other (Sherbondy et al., 2011) (by imposing spatial continuity priors), increasing the effective SNR of the local modeling on the one hand, and imposing spatial priors (continuity of, say, axon diameter) on the other. A more immediate benefit of these local micro-geometric models is that they are (or possibly are tending to become) capable of estimating some of the quantities that neuroscientists care about. We believe that these approaches may be valuable in the future for improving the quantitative nature of diffusion MR tractography (see later).
Data
For a given model that we may choose to take us from diffusion profile to fiber orientation, the precision of the mapping will depend on the quality of the data. Several factors define the quality of diffusion data, among which signal-to-noise ratio, diffusion weighting (b-value), spatial resolution (size of voxels) and orientational resolution (number of nonparallel diffusion weighting gradient orientations) are the most relevant. In tractography, the important parameter that we want to estimate from diffusion data is the orientation(s) of the diffusion profile and so it is important to optimize the orientational resolution of the data. If, by contrast, we were interested in the average apparent diffusion coefficient across all directions, then the optimal acquisition parameters may be more focused on the choice of b-values than the gradient directions (Alexander and Barker, 2005; Jones et al., 1999b).
Optimizing sequence parameters not only allows us to get better precision on estimated model parameters, but can also enable us to estimate the parameters themselves. Some of the more complex diffusion modeling such as DSI (Wedeen et al., 2005), micro-structural modeling (Assaf et al., 2008), or models for fiber spreading require a large number of data volumes. In particular, they require a large set of b-values [in the case of DSI and micro-structure models (Alexander, 2008)], and/or gradient directions (fODF models). Data acquisition strategies ultimately depend on the subsequent modeling approach (Tournier et al., 2011) (and of course on the available hardware and scanning time). While it is not clear what set of parameters will be optimal for each of these schemes, determining the range of ideal acquisition parameters, for example, using simulations, will be important for the future of tractography.
While the range of optimal parameters for some of the more advanced diffusion modeling may possibly fall beyond the current possibilities of clinical MR systems, state-of-the art imaging solutions provide some hope for getting higher and higher quality data in shorter times. New developments in accelerated sequences (Feinberg et al., 2010) are likely to provide an order of magnitude increase in the amount of data we can acquire in a given time window. This will allow us to spend time acquiring data with very high orientational resolution for detailed modeling of the fODF, or alternatively acquire multiple b-value data for complex micro-structural modeling, etc.
Another source of enthusiasm for the future of diffusion data is high field MRI (e.g., 7T) in humans. The increased SNR provided by the higher field strength will allow us to increase the diffusion weighting and get fine detailed fiber distributions, or alternatively increase the spatial resolution of the data. In vivo high-resolution diffusion at 7T is already showing promising examples of detailed cortical and sub-cortical anisotropy unseen before (Heidemann et al., 2010).
In summary, despite the difficulties in bridging the gap between diffusion and axons, and their consequences for tractography, there is some progress that will undoubtedly alleviate some of these issues. These advances are happening simultaneously in modeling, algorithm development, and data acquisition. It will still be difficult to know how many errors we make in tractography, but at least we will know that we are making fewer errors than we did before!
Is Tractography Quantitative?
Quantitative connectivity
One frustrating thing about tractography is that it takes a quantitative acquisition method (diffusion MRI) and makes it less quantitative. That is, less quantitative from the point of view of connectivity. Of course, diffusion MR is a quantitative method: it allows us to calculate the—albeit apparent—diffusion coefficient with great accuracy. Hence we can use it together with tractography (which quantifies the location of the tracts) to get quantitative measurements along tracts (what we have referred to as tractometry). For example, we can calculate the diffusion coefficient along and across white matter tracts, the anisotropy of the diffusion profile within the tract centres, etc. However, in the context of brain connectivity, these are not necessarily the quantitative measures that we are after. Instead, a good measure of structural connectivity, that is, one that has functional relevance or implications, is more likely to be one of the following:
• Does region A connect to region B or not?
• What is the number of axons that connect A to B?
• What proportion of axons leaving A go to B?
• What proportion of neurons in B get input from axons in A?
• What is the calibre/length/degree of myelination of axons from A to B?
None of the above is directly available to any tractography methods at the moment. For example, for the very reasons we have argued in the previous sections (modeling errors), we cannot answer with confidence the question of whether A connects to B. What we can do is to calculate the route of least hindrance to diffusion, and assume that if A really does connect to B, then the diffusion route is likely to follow the white matter tract underlying this connection. We can also calculate a confidence on the location of that route, or a confidence on whether that route passes through B, given the amount of noise in the data.
What about probabilistic tractography?
Studies that use tractography to explore brain connectivity and its variations across brain areas, individuals, or species, often extract numbers (summary statistics) from the tracking process to make quantitative comparisons. In deterministic tracking, that is, following a point estimate of the route of least hindrance to diffusion, these numbers tend to be either the number of streamlines from A to B, or the proportion of streamlines from A to B among other possible targets. Sometimes fibers is used as an alternative term to streamlines, but we would discourage this due to the obvious potential for confusion between tractography-derived fibers and axonal fibers. Given that the number of streamlines is not a direct measure of anatomical connectivity, and that their relationship to the underlying anatomy is rather ambiguous, it is questionable whether there is a value in using them to assess and compare connectivity.
Probabilistic tractography is in a sense slightly more quantitative, but it is important to realize in what sense it is and it is not. In the context of a low-level model that represents fiber orientations as a discrete set of crossing fibers, performing probabilistic tracking gives us an estimate of our confidence on the route of least hindrance to diffusion. We can say, for example, that we are more confident that A connects to B (through the diffusion field) than that A connects to C. Or that we are more confident that A connects to B in one individual than in another. This confidence in the route of diffusion is not a measure that you can get from the deterministic number of streamlines approach.
It is extremely tempting to consider these probabilities, or confidence levels, as our estimate of connection strength, and indeed this term has been used in many publications (including some of our own) instead of the more appropriate term “probability.” However, while this confidence may well depend on some of the above-mentioned good measures of structural connectivity, it does so in an un-modeled way. Other noninteresting factors will also influence our confidence. For example, we are more confident in a short route than a long one (errors and uncertainty accumulate during the tracking process), so our measure of connectivity will depend on the distance between regions. It will also depend on the size of voxels and brain areas, the noise level, the modeling errors, and the algorithmic errors (e.g., due to the curvature of the tracts).
Quantitative tractography may still not be a mere illusion. Recent advances in low-level modeling are opening possibilities of associating fiber bundles with quantitative measurements directly related to axon micro-geometry. First, using q-space imaging in conjunction with varying the diffusion time (i.e., varying the spatial scale of detectable diffusion displacements), one can probe restriction to diffusion associated with separate compartment sizes. Using a few geometric assumptions on the effect of axonal restriction on the diffusion signal, researchers can include these micro-geometric parameters into their models and infer them from the data. This approach has been shown to successfully estimate distribution of axon diameters in excised nerve fibers ex vivo (Assaf et al., 2008) as well as in vivo in rats (Barazany et al., 2009). The data requirements (in particular, the need for large gradient strengths) make these techniques difficult to apply to human imaging, where care must be taken both in experimental design as well as interpretation (Alexander, 2008).
Second, fiber spread models of the fODF will provide means of quantifying connectivity between regions (Zhang et al., 2011). We may be able to say how confident we are, not on the route of least hindrance to diffusion, but on the proportion of fibers between two regions (Behrens and Jbabdi, 2009). Finally, using complementary imaging techniques for myelin mapping [such as magnetization transfer (MacKay et al., 2006), multi flip-angle techniques (Deoni et al., 2008) or myelin water diffusion (Avram et al., 2010)], we may be able to quantify the myelin content within white matter voxels, and potentially associate these quantities with specific axon bundles using tractography. Of course, all these elements of structural quantification, as exciting as they are, should still be subject to careful interpretation, given the continued unknown influences of modeling errors in tractography.
Having said all this, do we need to be at all quantitative? Studies that find differences in tractography between populations, while not necessarily able to attribute these differences to specific aspects of the anatomy, are still in the position to say that something must be driving the differences. The ease of tracing through the diffusion field does depend, one way or another, on the anatomy. Tractography measures can be more sensitive to detecting true anatomical effects than, say, micro-structural measures (FA, MD, etc.). The main issue is of course one of interpretation. Biomarkers of tissue structure can be useful (for example, in a clinical setting), even if we do not know what they are measuring. However, while we insist that tractography measures are hard to interpret, we do not want to give the impression that they cannot be interpreted. One can, for instance, use tractography to detect an effect, then explore this effect using different measurements (e.g., DTI indices for micro-structure, VBM measures of macro-structure, relaxometry measures of myelin, etc.) to determine, or at least narrow down, which aspects of the anatomy are driving tractography results.
Can we do statistics on tractography?
When we look at a probabilistic connectivity map (the spatial histogram of where the tracts are), our first thought might be that it looks rather messy, how can we threshold it? Of course we can set the threshold on the connection probabilities at an arbitrary level for the purpose of a tidier visualization, or choose a threshold such that the map appears to make anatomical sense (we tend to have strong anatomical priors). However, the underlying question is really a statistical one: how can we tell that the route from A goes through B whilst controlling for type I and/or type II errors?
A frequentist approach to the above question can be framed in the language of hypothesis testing. We first define a null hypothesis and a (set of) alternative hypothesis(es). These are
H0: A does not connect to B
H1: A connects to B
The second step is to define a test-statistic. This is the first tricky part: what statistic would allow us to tell H1 from H0? Using probabilistic tractography, we are bound to use what we have, that is, the measure of probability of connection from A to each voxel on the map (in univariate terms, we would have one test per voxel). It is not clear whether this is a good statistic or not, and in particular, we need to proceed into the third step, which is to derive a probability distribution for the test-statistic under the null hypothesis H0. This is the really difficult part: what sort of distribution for the confidence on a tract from A through a voxel X (let us call this number XA) do we expect to have under the null hypothesis that A does not connect to X? Whether H0 is true does not appear to contain any useful information as to what the data should look like, it could be anything, and hence XA could be anything. Of course, we are not saying that a frequentist approach is not at all feasible in theory; we just do not have a clue how to formulate it!
In one attempt to tackle this issue (Morris et al., 2008), the authors were concerned by the dependence of the confidence measure on the distance from the starting point, and defined a null distribution to account for that. We put null between quotes here (and so do the authors of the article) because it is not strictly speaking a null distribution, as we shall explain below.
The authors' idea was to compare the empirical value of XA to the distribution on XA that one would obtain if the fiber orientations were random, that is, in a case where the value of XA is dominated by the distance from the starting point. It is immediately clear that such distribution does not represent the null (A does not connect to X). Indeed, H0 does not imply that the orientation field is random: a nonrandom field could well support a situation where A does not connect to X. Also, having a random orientation field is equivalent to saying that, from a given location, all directions in space are equally likely. This implies that the probability of reaching a location from A will obey a deterministic 1/d2 law. The distribution of XA under the random orientation field hypothesis will effectively produce a sort of threshold against which we could well test the empirical XA statistic, but without providing us with confidence intervals, or indeed control of type I or II errors. The method does still, however, have the merit of tackling the problem, and despite being heuristic, may increase our sensitivity in detecting long-range connections that are otherwise masked by the distance effect.
Another approach to test for the existence of connections has been suggested by Jbabdi et al. (2007). This time, it is not a frequentist but a Bayesian take on the problem. The idea is to have a generative model that contains an explicit parameterization of the connection from A to B. By calculating the model evidence (the marginal likelihood of the model given the data) implied by having a connection, and comparing that to a model that doesn't contain the connection, we are able to estimate the probability that the connection is supported by the data.
Of course, neither the frequentist nor the Bayesian method alleviates the fundamental problem with modeling errors, but instead try to test the existence of the path through the diffusion field, given the amount of data, noise and modeling assumptions. Such a diffusion path may still exist (i.e., have strong support in the data) when a true underlying connection does not.
Finally, it is worth adding that, although a rigorous statistical framework to control our confidence on the tracts is hard to establish, we can still use a more qualitative approach that is based on our prior knowledge on the trajectories of white matter pathways. The use of exclusion and inclusion masks in tractography algorithms has been extremely valuable for that purpose (Catani et al., 2002). For example, considering a connection from A to B, we can incorporate knowledge such as if it goes through region C (exclusion mask), or if it does not go through D (inclusion mask), then it is probably a false positive.
Now, given that determining the existence of a connection is a hard problem, can we at least use the numbers that probabilistic tractography gives us to conduct t-tests? For example, test whether the connection probability from A to B is significantly different from that to C. Of course, the answer is yes, assuming that the statistical assumptions underlying the t-test are valid. However, we should always keep in mind that the connection probability is not necessarily a direct reflexion of connection strength. So, interpreting test results should be subject to careful considerations as to the elements that make one connection more likely than another. It can be driven by connection strength, but also by differences in the amount of modeling errors, ease of tracking, noise, etc. These confounds can introduce biases in the structural connectivity network that may drive erroneous interpretations of graph structures (in terms of small-world architecture, hubs, etc.).
In summary, the quantitative value of tractography, although often rightly called into question in discussion sections of articles, may be viewed as straightforward by readers who are only interested in the overall picture. We need to be extremely wary of all potential sources of confounds, and use other sources of data to help eliminate some of these confounds, and to strengthen or confront the claims that we may formulate on the basis of tractography results.
Where Do We Go from Here?
Charting the human connectome
Determining the wiring diagram of the human brain is one of the greatest challenges in neuroscience (Sporns et al., 2005). At the micro-scale, the complexity of neuronal connections is hard to even conceive, and the task of determining their complete structure is extremely challenging even for small (∼1 mm) domains. At the macro-scale, however, this goal is approachable using current technology. Connections between brain areas can, in principle, be inferred from whole brain in vivo data using MRI-based neuroimaging techniques such as diffusion MR tractography (Hagmann et al., 2007; Sporns, 2011). This raises the possibility of not only characterizing the wiring diagram between (whole) brain areas, but also doing so in a systematic way across multiple individuals (Sporns, 2011).
This is the goal of current large-scale connectome efforts such as the Human Connectome Project (HCP), an NIH-funded initiative aiming to chart a “comprehensive map of human brain circuitry in 1200 healthy adults using state of the art neuroimaging methods” (www.humanconnectome.org). Tractography is of course central to the project and will help establish the structural basis of the human connectome. fMRI will also inform our understanding of connectivity and along with MEG will be used to characterize brain function. What are then the prospects for success in building the large-scale network structure of the human brain given the limitations of diffusion MR tractography that we have discussed throughout this review?
It is likely that not only will such initiatives owe a great deal to tractography as a tool, but also that tractography methods will benefit greatly from such concerted efforts. Significant investments will be targeted toward improving the amount and quality of the data that will be acquired for the project, using state-of-the art MRI physics and extensive optimization of acquisition parameters. In practical terms, this will mean that it may be possible to acquire, on each subject, much more diffusion data than is currently routinely available in the same amount of time. Most of the fine-level modeling, such as precise fiber spreading models and their polarity, will become feasible given this data quality, and estimates of connectivity will thereby be improved significantly.
On the other hand, tractography is not the only way to access the structure of brain networks. Fluctuations of the fMRI BOLD signal at rest provide a complementary type of evidence on distributed functional brain networks and will be an important modality for the HCP effort. Other large-scale efforts, such as the 1000 Functional Connectomes Project (Biswal et al., 2010), are attempting to characterize consistent patterns in these networks. There is evidence that such functional networks can indirectly reflect the brain structural connectivity (Fig. 6); For example, resting-state functional connectivity between remote brain regions has been shown to reflect aspects of the underlying white matter connectivity in the case of the default-mode network (Greicius et al., 2009), and tractography-derived structural connectivity has been used to predict resting state activity via modeling (Honey et al., 2009, 2010). One of the drawbacks of using functional connectivity as an indicator of structure is that it may reflect indirect as well as direct connections, thereby confusing the interpretation of the graph structure. However, extensive simulation models (Smith et al., 2011) indicate that, given high enough quality data, and at the spatial scale of brain regions (as opposed to voxels) one can use sophisticated methods for inferring interregional functional connectivity that reflect the direct interactions through the graph structure. While such techniques may still have less sensitivity (a structural link may not always be functional), it is likely that a combination of resting-state fMRI and diffusion MR tractography will provide a more complete and accurate description of the structural connectome than either technique on its own. Also, as we have alluded to earlier, electrophysiology data (such as MEG) may be used to determine the timing and/or the (preferred) direction of functional influences, addressing the question of polarity that is lacking from tractography data (Stufflebeam et al., 2008).
FIG. 6.

Comparison between tractography-based and resting-state fMRI connectivity (correlation of time series) thresholded at arbitrary levels. The seed point is indicated by the black cross on the left temporo-parietal junction. Tractography data are from a single subject and fMRI data from averaging correlation matrices from five subjects. Notice the similarities but also the differences between the two maps. fMRI, functional magnetic resonance imaging.
In general, multimodal integration in the context of tractography and brain connectivity has two advantages: (i) it provides complementary sources of information that is missing from tractography (e.g., polarity), and (ii) it provides means for validation (Jbabdi, 2009). An example of the latter is the use of task fMRI to test the hypothesis that borders between brain regions, detected using tractography, are genuine functional borders (Behrens et al., 2006; Johansen-Berg et al., 2004, 2005). Next we examine strategies for validation of tractography per se, that is, whether the routes of least hindrance to diffusion correspond to the trajectory of white matter axon bundles.
Validation
Since we are not sure whether we are making modeling errors or not, an alternative approach to testing our confidence in tractography findings is to compare them to situations where we do know the ground truth, that is, using physical phantoms, animal models, or postmortem studies in humans. There have been several attempts using all of the above. In most cases, the results were encouraging, in that diffusion was not far off modeling the underlying microstructures and connections (Hubbard et al., 2009).
Physical phantoms have been used to test low level models and tractography algorithms (Perrin et al., 2005; Poupon et al., 2008). For example, phantoms mimicking crossing fibers and/or bending and kissing fibers have been used to test various model-based and model-free low-level techniques; several tractography algorithms have also been used in a competition aimed at reconstructing the underlying ground truth (Fillard et al., 2011). Building realistic phantoms is, however, extremely difficult. Firstly, the dimensions of the artificial fibers that are used are, at best, one or two orders of magnitude larger than those of axons. This means that the data acquisition strategy that may be suitable for modeling phantom data may not be optimal for in vivo experiments. Also, and perhaps more importantly, the voxel-wise complexity of true axon bundles is difficult to reproduce, rendering the phantoms rather simplistic, which makes it difficult to judge whether a method that performs well on a phantom will also perform well in the brain.
Animal models have also been used as a means to validate tractography methods. In this case, the ground truth comes from tracer-injections, which are known to be very specific markers of connectivity. Tracers are transported within the axons, which completely alleviates the problem of jumping between one tract and another. Examples of such studies are comparisons between tractography and histological tracers in macaques (Dauguet et al., 2007; Schmahmann et al., 2007), or against MRI-visible tracers in rats (Leergaard et al., 2003), marmosets (Yamada et al., 2008) and mini-pigs (Dyrby et al., 2007). While in these cases, only a few connections could be tested at a time, others have used databases of tracer studies results (www.cocomac.org) to test several connections at a time (Hagmann et al., 2008). This not only alleviates the problem of testing multiple sites at once, but also improves the reliability of tracer studies results in terms of false negatives and experimental subjectivity.
One of the difficulties with these types of validations is that while they can tell us when there is a discrepancy between our estimate of connections and that of a tracer, the success of using the same method in a human brain is not guaranteed by its success in animals.
Finally, testing against postmortem histological samples from human or animal brains will certainly be useful to test local models of fiber architectures (Barazany et al., 2009). Testing tractography methods in humans, while impossible using the more reliable methods of tracer-injections, may be possible, although subject to inter-operator variability, using classical dissections (Lawes et al., 2008).
Do we need tractography?
Several good atlases of the major white matter fiber bundles in the human brain have been published in recent years using tractography [e.g., (Catani and Thiebaut de Schotten, 2008; Wakana et al., 2004)]. Given that we can register a given subject's brain onto an atlas, thereby localizing the white matter tracts from the atlas relative to the subject's own brain, why do we need to spend precious MRI time acquiring diffusion data at all? Why not simply use the atlas? The problem with using standard atlases is that the size and shape of cortical areas varies considerably between individuals; for example, there can be a two-fold change in the size of V1 across healthy individuals (Andrews et al., 1997). White matter tracts are also extremely variable in size and position (although less variable in terms of their relative positions to one another). Hence, to get an accurate registration to an atlas, we need to be able to localize the tracts of an individual to be able to register them to the tracts on the atlas. We need tractography for this.
A more fundamental question though is: If what we ultimately want to understand is brain functional organization, do we need tractography, or even precise structural information at all? Why not simply measure brain function directly, and apply methods to infer functional interactions between brain areas. Is our knowledge of the gross connectional structure really a key to our understanding of brain function, or is it marginal relative to a direct access to interregional functional influences?
We believe that knowing about the structure of a network informs our understanding of its function. For example, a hierarchical network architecture allows for the possibility of bottom-up and top-down message passing, and ladder-like hierarchies can allow shared computations between parallel hierarchies. While it is possible, to some extent, to define hierarchical levels on the basis of the laminar pattern of cortico-cortical connectivity, such information is not available to tractography. However, other aspects of structural organization are, in principle, available to tractography. For example, white matter pathways are able to transfer cortical map representations into remote brain areas in a topographic manner. Understanding these topographies can potentially give us indicators, or even predictors, for the activity of target cortical regions. Intersection between cortico-cortical maps may reveal interesting aspects of how areas share information to perform specific computations, which can help us formulate testable mechanistic computational models.
Another element that pleads in favor of structure is the possibility of understanding, or perhaps even predicting, dysfunction caused by (structural) dysconnections in specific locations of the brain network. Catani and Ffytche's hodology (Catani, 2007), the science of connectional anatomy, is vital if we are to formulate such predictive models.
Finally, structural connectivity, even seen through the incomplete and imperfect detector that is tractography, can be a valuable tool to identify brain functional units (parcellation), and can also provide a useful set of prior architectural constrains for models of functional interactions (Stephan et al., 2009).
In a nutshell, although a complete understanding of brain structural architecture is certainly not sufficient to understand brain function (Friston, 2011), it is still a valuable tool to understand its degrees of freedom.
Conclusion
Tractography can and should be used to study human brain connectivity. Adopting the diffusion profile as a proxy for white matter local geometry is a model. That is, it is imperfect, but useful, if we understand its limitations. Efforts carried out on several fronts, including data acquisition and analysis, will undoubtedly help overcome some of these limitations. However, while our confidence on tracing white matter connections will certainly increase, we should still use the method with care. Multimodal approaches should be used both as a source of complementary information as well as a validation tool. Experiments should be designed such that the data and the analysis can answer the scientific questions posed.
Acknowledgments
We thank Tim Behrens, David Van Essen, Stamatios Sotiropoulos, and Natalie Voets for their helpful comments on the article. The authors are funded by the Medical Research Council (S.J.) and the Wellcome Trust (H.J.B.).
Author Disclosure Statement
No competing financial interests exist.
References
- Aboitiz F, et al. Fiber composition of the human corpus callosum. Brain Res. 1992;598:143–153. doi: 10.1016/0006-8993(92)90178-c. [DOI] [PubMed] [Google Scholar]
- Aganj I, et al. Reconstruction of the orientation distribution function in single- and multiple-shell q-ball imaging within constant solid angle. Magn Reson Med. 2010;64:554–566. doi: 10.1002/mrm.22365. [DOI] [PMC free article] [PubMed] [Google Scholar]
- Aganj I, et al. A Hough transform global probabilistic approach to multiple-subject diffusion MRI tractography. Med Image Anal. 2011;15:414–425. doi: 10.1016/j.media.2011.01.003. [DOI] [PMC free article] [PubMed] [Google Scholar]
- Alexander DC. A general framework for experiment design in diffusion MRI and its application in measuring direct tissue-microstructure features. Magn Reson Med. 2008;60:439–448. doi: 10.1002/mrm.21646. [DOI] [PubMed] [Google Scholar]
- Alexander DC. Barker GJ. Optimal imaging parameters for fiber-orientation estimation in diffusion MRI. Neuroimage. 2005;27:357–367. doi: 10.1016/j.neuroimage.2005.04.008. [DOI] [PubMed] [Google Scholar]
- Andrews TJ. Halpern SD. Purves D. Correlated size variations in human visual cortex, lateral geniculate nucleus, and optic tract. J Neurosci. 1997;17:2859–2868. doi: 10.1523/JNEUROSCI.17-08-02859.1997. [DOI] [PMC free article] [PubMed] [Google Scholar]
- Anwander A, et al. Connectivity-based parcellation of Broca's area. Cereb Cortex. 2007;17:816–825. doi: 10.1093/cercor/bhk034. [DOI] [PubMed] [Google Scholar]
- Anwander A, et al. DTI-Tractography Based Parcellation of Human Precentral Gyrus. 11th Annual Meeting of the Organization For Human Brain Mapping; Toronto, Canada. 2005. [Google Scholar]
- Assaf Y, et al. New modeling and experimental framework to characterize hindered and restricted water diffusion in brain white matter. Magn Reson Med. 2004;52:965–978. doi: 10.1002/mrm.20274. [DOI] [PubMed] [Google Scholar]
- Assaf Y, et al. AxCaliber: a method for measuring axon diameter distribution from diffusion MRI. Magn Reson Med. 2008;59:1347–1354. doi: 10.1002/mrm.21577. [DOI] [PMC free article] [PubMed] [Google Scholar]
- Avram AV. Guidon A. Song AW. Myelin water weighted diffusion tensor imaging. Neuroimage. 2010;53:132–138. doi: 10.1016/j.neuroimage.2010.06.019. [DOI] [PubMed] [Google Scholar]
- Bach DR, et al. Deep and superficial amygdala nuclei projections revealed in vivo by probabilistic tractography. J Neurosci. 2011;31:618–623. doi: 10.1523/JNEUROSCI.2744-10.2011. [DOI] [PMC free article] [PubMed] [Google Scholar]
- Barazany D. Basser PJ. Assaf Y. In vivo measurement of axon diameter distribution in the corpus callosum of rat brain. Brain. 2009;132(Pt 5):1210–1220. doi: 10.1093/brain/awp042. [DOI] [PMC free article] [PubMed] [Google Scholar]
- Basser P, et al. In vivo fiber tractography using DT-MRI data. MRM. 2000;44:625–632. doi: 10.1002/1522-2594(200010)44:4<625::aid-mrm17>3.0.co;2-o. [DOI] [PubMed] [Google Scholar]
- Basser P. Mattiello J. Bihan DL. Estimation of the effective self-diffusion tensor from the NMR spin echo. J Magn Reson. 1994;103:247–254. doi: 10.1006/jmrb.1994.1037. [DOI] [PubMed] [Google Scholar]
- Beckmann M. Johansen-Berg H. Rushworth MF. Connectivity-based parcellation of human cingulate cortex and its relation to functional specialization. J Neurosci. 2009;29:1175–1190. doi: 10.1523/JNEUROSCI.3328-08.2009. [DOI] [PMC free article] [PubMed] [Google Scholar]
- Behrens TE, et al. Characterization and propagation of uncertainty in diffusion-weighted MR imaging. Magn Reson Med. 2003a;50:1077–1088. doi: 10.1002/mrm.10609. [DOI] [PubMed] [Google Scholar]
- Behrens TE, et al. Non-invasive mapping of connections between human thalamus and cortex using diffusion imaging. Nat Neurosci. 2003b;6:750–757. doi: 10.1038/nn1075. [DOI] [PubMed] [Google Scholar]
- Behrens TE, et al. A consistent relationship between local white matter architecture and functional specialisation in medial frontal cortex. Neuroimage. 2006;30:220–227. doi: 10.1016/j.neuroimage.2005.09.036. [DOI] [PubMed] [Google Scholar]
- Behrens TE, et al. Probabilistic diffusion tractography with multiple fibre orientations: what can we gain? Neuroimage. 2007;34:144–155. doi: 10.1016/j.neuroimage.2006.09.018. [DOI] [PMC free article] [PubMed] [Google Scholar]
- Behrens TEJ. Jbabdi S. MR Diffusion Tractography, in Diffusion MRI. San Diego: Academic Press; 2009. pp. 333–351. [Google Scholar]
- Berman JI, et al. Quantitative diffusion tensor MRI fiber tractography of sensorimotor white matter development in premature infants. Neuroimage. 2005;27:862–871. doi: 10.1016/j.neuroimage.2005.05.018. [DOI] [PubMed] [Google Scholar]
- Berman JI, et al. Probabilistic streamline q-ball tractography using the residual bootstrap. Neuroimage. 2008;39:215–222. doi: 10.1016/j.neuroimage.2007.08.021. [DOI] [PubMed] [Google Scholar]
- Biswal BB, et al. Toward discovery science of human brain function. Proc Natl Acad Sci USA. 2010;107:4734–4739. doi: 10.1073/pnas.0911855107. [DOI] [PMC free article] [PubMed] [Google Scholar]
- Calamante F, et al. Track-density imaging (TDI): super-resolution white matter imaging using whole-brain track-density mapping. Neuroimage. 2010;53:1233–1243. doi: 10.1016/j.neuroimage.2010.07.024. [DOI] [PubMed] [Google Scholar]
- Calamante F, et al. Track density imaging (TDI): validation of super resolution property. Neuroimage. 2011;56:1259–1266. doi: 10.1016/j.neuroimage.2011.02.059. [DOI] [PubMed] [Google Scholar]
- Callaghan PT. Oxford: Oxford University Press; 1991. Principles of Nuclear Magnetic Resonance Microscopy; p. 371. [Google Scholar]
- Catani M. From hodology to function. Brain. 2007;130(Pt 3):602–605. doi: 10.1093/brain/awm008. [DOI] [PubMed] [Google Scholar]
- Catani M, et al. Virtual in vivo interactive dissection of white matter fasciculi in the human brain. Neuroimage. 2002;17:77–94. doi: 10.1006/nimg.2002.1136. [DOI] [PubMed] [Google Scholar]
- Catani M. Jones D. Ffytche D. Perisylvian language networks of the human brain. Ann Neurol. 2005;57:8–16. doi: 10.1002/ana.20319. [DOI] [PubMed] [Google Scholar]
- Catani M. Thiebaut de Schotten M. A diffusion tensor imaging tractography atlas for virtual in vivo dissections. Cortex. 2008;44:1105–1132. doi: 10.1016/j.cortex.2008.05.004. [DOI] [PubMed] [Google Scholar]
- Ciccarelli O, et al. Diffusion-based tractography in neurological disorders: concepts, applications, and future developments. Lancet Neurol. 2008;7:715–727. doi: 10.1016/S1474-4422(08)70163-7. [DOI] [PubMed] [Google Scholar]
- Clayden JD. Storkey AJ. Bastin ME. A probabilistic model-based approach to consistent white matter tract segmentation. IEEE Trans Med Imaging. 2007;26:1555–1561. doi: 10.1109/TMI.2007.905826. [DOI] [PubMed] [Google Scholar]
- Conturo TE, et al. Tracking neuronal fiber pathways in the living human brain. Proc Natl Acad Sci USA. 1999;96:10422–10427. doi: 10.1073/pnas.96.18.10422. [DOI] [PMC free article] [PubMed] [Google Scholar]
- Dauguet J, et al. Comparison of fiber tracts derived from in vivo DTI tractography with 3D histological neural tract tracer reconstruction on a macaque brain. Neuroimage. 2007;37:530–538. doi: 10.1016/j.neuroimage.2007.04.067. [DOI] [PubMed] [Google Scholar]
- Davis SW, et al. Assessing the effects of age on long white matter tracts using diffusion tensor tractography. Neuroimage. 2009;46:530–541. doi: 10.1016/j.neuroimage.2009.01.068. [DOI] [PMC free article] [PubMed] [Google Scholar]
- Deoni SC, et al. Gleaning multicomponent T1 and T2 information from steady-state imaging data. Magn Reson Med. 2008;60:1372–1387. doi: 10.1002/mrm.21704. [DOI] [PubMed] [Google Scholar]
- Descoteaux M, et al. Regularized, fast, and robust analytical Q-ball imaging. Magn Reson Med. 2007;58:497–510. doi: 10.1002/mrm.21277. [DOI] [PubMed] [Google Scholar]
- Descoteaux M, et al. Deterministic and probabilistic tractography based on complex fibre orientation distributions. IEEE Trans Med Imaging. 2009;28:269–286. doi: 10.1109/TMI.2008.2004424. [DOI] [PubMed] [Google Scholar]
- Devlin JT, et al. Reliable identification of the auditory thalamus using multi-modal structural analyses. Neuroimage. 2006;30:1112–1120. doi: 10.1016/j.neuroimage.2005.11.025. [DOI] [PMC free article] [PubMed] [Google Scholar]
- Dyrby TB, et al. Validation of in vitro probabilistic tractography. Neuroimage. 2007;37:1267–1277. doi: 10.1016/j.neuroimage.2007.06.022. [DOI] [PubMed] [Google Scholar]
- Eluvathingal TJ, et al. Quantitative diffusion tensor tractography of association and projection fibers in normally developing children and adolescents. Cereb Cortex. 2007;17:2760–2768. doi: 10.1093/cercor/bhm003. [DOI] [PMC free article] [PubMed] [Google Scholar]
- Feinberg DA, et al. Multiplexed echo planar imaging for sub-second whole brain FMRI and fast diffusion imaging. PLoS ONE. 2010;5:e15710. doi: 10.1371/journal.pone.0015710. [DOI] [PMC free article] [PubMed] [Google Scholar]
- Felleman DJ. Van Essen DC. Distributed hierarchical processing in the primate cerebral cortex. Cereb Cortex. 1991;1:1–47. doi: 10.1093/cercor/1.1.1-a. [DOI] [PubMed] [Google Scholar]
- Fillard P, et al. Quantitative evaluation of 10 tractography algorithms on a realistic diffusion MR phantom. Neuroimage. 2011;56:220–234. doi: 10.1016/j.neuroimage.2011.01.032. [DOI] [PubMed] [Google Scholar]
- Frey S, et al. Dissociating the human language pathways with high angular resolution diffusion fiber tractography. J Neurosci. 2008;28:11435–11444. doi: 10.1523/JNEUROSCI.2388-08.2008. [DOI] [PMC free article] [PubMed] [Google Scholar]
- Friston K. Functional and effective connectivity: a review. Brain Connect. 2011;1:13–36. doi: 10.1089/brain.2011.0008. [DOI] [PubMed] [Google Scholar]
- Gong G, et al. Asymmetry analysis of cingulum based on scale-invariant parameterization by diffusion tensor imaging. Hum Brain Mapp. 2005a;24:92–98. doi: 10.1002/hbm.20072. [DOI] [PMC free article] [PubMed] [Google Scholar]
- Gong G, et al. Side and handedness effects on the cingulum from diffusion tensor imaging. Neuroreport. 2005b;16:1701–1705. doi: 10.1097/01.wnr.0000183327.98370.6a. [DOI] [PubMed] [Google Scholar]
- Goodlett CB, et al. Group analysis of DTI fiber tract statistics with application to neurodevelopment. Neuroimage. 2009;45(1 Suppl):S133–S142. doi: 10.1016/j.neuroimage.2008.10.060. [DOI] [PMC free article] [PubMed] [Google Scholar]
- Greicius MD, et al. Resting-state functional connectivity reflects structural connectivity in the default mode network. Cereb Cortex. 2009;19:72–78. doi: 10.1093/cercor/bhn059. [DOI] [PMC free article] [PubMed] [Google Scholar]
- Hagmann P, et al. Mapping human whole-brain structural networks with diffusion MRI. PLoS ONE. 2007;2:e597. doi: 10.1371/journal.pone.0000597. [DOI] [PMC free article] [PubMed] [Google Scholar]
- Hagmann P. Gigandet X. Meuli R. Kötter R. Sporns O. Wedeen VJ. Quantitative validation of MR tractography using the CoCoMac database. Magn Reson Med. 2008;16:427. [Google Scholar]
- Hasan KM, et al. Quantification of the spatiotemporal microstructural organization of the human brain association, projection and commissural pathways across the lifespan using diffusion tensor tractography. Brain Struct Funct. 2010;214:361–373. doi: 10.1007/s00429-009-0238-0. [DOI] [PMC free article] [PubMed] [Google Scholar]
- Heidemann RM, et al. Diffusion imaging in humans at 7T using readout-segmented EPI and GRAPPA. Magn Reson Med. 2010;64:9–14. doi: 10.1002/mrm.22480. [DOI] [PubMed] [Google Scholar]
- Hess CP, et al. Q-ball reconstruction of multimodal fiber orientations using the spherical harmonic basis. Magn Reson Med. 2006;56:104–117. doi: 10.1002/mrm.20931. [DOI] [PubMed] [Google Scholar]
- Hilgetag CC. O'Neill MA. Young MP. Hierarchical organization of macaque and cat cortical sensory systems explored with a novel network processor. Philos Trans R Soc Lond B Biol Sci. 2000;355:71–89. doi: 10.1098/rstb.2000.0550. [DOI] [PMC free article] [PubMed] [Google Scholar]
- Honey CJ, et al. Predicting human resting-state functional connectivity from structural connectivity. Proc Natl Acad Sci USA. 2009;106:2035–2040. doi: 10.1073/pnas.0811168106. [DOI] [PMC free article] [PubMed] [Google Scholar]
- Honey CJ. Thivierge JP. Sporns O. Can structure predict function in the human brain? Neuroimage. 2010;52:766–776. doi: 10.1016/j.neuroimage.2010.01.071. [DOI] [PubMed] [Google Scholar]
- Hsu JL, et al. Microstructural white matter changes in normal aging: a diffusion tensor imaging study with higher-order polynomial regression models. Neuroimage. 2010;49:32–43. doi: 10.1016/j.neuroimage.2009.08.031. [DOI] [PubMed] [Google Scholar]
- Huang H. Structure of the fetal brain: what we are learning from diffusion tensor imaging. Neuroscientist. 2010;16:634–649. doi: 10.1177/1073858409356711. [DOI] [PubMed] [Google Scholar]
- Hubbard PL, et al. Validation of Tractography, in Diffusion MRI. San Diego: Academic Press; 2009. pp. 353–375. [Google Scholar]
- Jbabdi S. Imaging Structure and Function, in Diffusion MRI. San Diego: Academic Press; 2009. pp. 461–480. [Google Scholar]
- Jbabdi S. Behrens TE. Smith SM. Crossing fibres in tract-based spatial statistics. Neuroimage. 2010;49:249–256. doi: 10.1016/j.neuroimage.2009.08.039. [DOI] [PubMed] [Google Scholar]
- Jbabdi S, et al. A Bayesian framework for global tractography. Neuroimage. 2007;37:116–129. doi: 10.1016/j.neuroimage.2007.04.039. [DOI] [PubMed] [Google Scholar]
- Jbabdi S, et al. Accurate anisotropic fast marching for diffusion-based geodesic tractography. Int J Biomed Imaging. 2008;2008:320195. doi: 10.1155/2008/320195. [DOI] [PMC free article] [PubMed] [Google Scholar]
- Jeurissen B, et al. Probabilistic fiber tracking using the residual bootstrap with constrained spherical deconvolution. Hum Brain Mapp. 2011;32:461–479. doi: 10.1002/hbm.21032. [DOI] [PMC free article] [PubMed] [Google Scholar]
- Johansen-Berg H. Behavioural relevance of variation in white matter microstructure. Curr Opin Neurol. 2010;23:351–358. doi: 10.1097/WCO.0b013e32833b7631. [DOI] [PubMed] [Google Scholar]
- Johansen-Berg H. Behrens TE. Just pretty pictures? What diffusion tractography can add in clinical neuroscience. Curr Opin Neurol. 2006;19:379–385. doi: 10.1097/01.wco.0000236618.82086.01. [DOI] [PMC free article] [PubMed] [Google Scholar]
- Johansen-Berg H, et al. Changes in connectivity profiles define functionally distinct regions in human medial frontal cortex. Proc Natl Acad Sci USA. 2004;101:13335–13340. doi: 10.1073/pnas.0403743101. [DOI] [PMC free article] [PubMed] [Google Scholar]
- Johansen-Berg H, et al. Functional-anatomical validation and individual variation of diffusion tractography-based segmentation of the human thalamus. Cereb Cortex. 2005;15:31–39. doi: 10.1093/cercor/bhh105. [DOI] [PubMed] [Google Scholar]
- Johansen-Berg H, et al. Anatomical connectivity of the subgenual cingulate region targeted with deep brain stimulation for treatment-resistant depression. Cereb Cortex. 2008;18:1374–1383. doi: 10.1093/cercor/bhm167. [DOI] [PMC free article] [PubMed] [Google Scholar]
- Jones D. Challenges and limitations of quantifying brain connectivity in vivo with diffusion MRI. Imaging Med. 2010;2:341–355. [Google Scholar]
- Jones D, et al. Non-invasive assessment of axonal fiber connectivity in the human brain via diffusion tensor {MRI} MRM. 1999a;42:37–41. doi: 10.1002/(sici)1522-2594(199907)42:1<37::aid-mrm7>3.0.co;2-o. [DOI] [PubMed] [Google Scholar]
- Jones DK, et al. Age effects on diffusion tensor magnetic resonance imaging tractography measures of frontal cortex connections in schizophrenia. Hum Brain Mapp. 2006;27:230–238. doi: 10.1002/hbm.20179. [DOI] [PMC free article] [PubMed] [Google Scholar]
- Jones DK. Horsfield MA. Simmons A. Optimal strategies for measuring diffusion in anisotropic systems by magnetic resonance imaging. Magn Reson Med. 1999b;42:515–525. [PubMed] [Google Scholar]
- Jones DK. Pierpaoli C. Confidence mapping in diffusion tensor magnetic resonance imaging tractography using a bootstrap approach. Magn Reson Med. 2005;53:1143–1149. doi: 10.1002/mrm.20466. [DOI] [PubMed] [Google Scholar]
- Kaden E. Anwander A. Knosche TR. Variational inference of the fiber orientation density using diffusion MR imaging. Neuroimage. 2008;42:1366–1380. doi: 10.1016/j.neuroimage.2008.06.004. [DOI] [PubMed] [Google Scholar]
- Kaden E. Knosche TR. Anwander A. Parametric spherical deconvolution: inferring anatomical connectivity using diffusion MR imaging. Neuroimage. 2007;37:474–488. doi: 10.1016/j.neuroimage.2007.05.012. [DOI] [PubMed] [Google Scholar]
- Klein JC, et al. Connectivity-based parcellation of human cortex using diffusion MRI: establishing reproducibility, validity and observer independence in BA 44/45 and SMA/pre-SMA. Neuroimage. 2007;34:204–211. doi: 10.1016/j.neuroimage.2006.08.022. [DOI] [PubMed] [Google Scholar]
- Kreher BW. Mader I. Kiselev VG. Gibbs tracking: a novel approach for the reconstruction of neuronal pathways. Magn Reson Med. 2008;60:953–963. doi: 10.1002/mrm.21749. [DOI] [PubMed] [Google Scholar]
- Lawes IN, et al. Atlas-based segmentation of white matter tracts of the human brain using diffusion tensor tractography and comparison with classical dissection. Neuroimage. 2008;39:62–79. doi: 10.1016/j.neuroimage.2007.06.041. [DOI] [PubMed] [Google Scholar]
- Lazar M. Alexander AL. An error analysis of white matter tractography methods: synthetic diffusion tensor field simulations. Neuroimage. 2003;20:1140–1153. doi: 10.1016/S1053-8119(03)00277-5. [DOI] [PubMed] [Google Scholar]
- Lebel C. Caverhill-Godkewitsch S. Beaulieu C. Age-related regional variations of the corpus callosum identified by diffusion tensor tractography. Neuroimage. 2010;52:20–31. doi: 10.1016/j.neuroimage.2010.03.072. [DOI] [PubMed] [Google Scholar]
- Leergaard TB, et al. In vivo tracing of major rat brain pathways using manganese-enhanced magnetic resonance imaging and three-dimensional digital atlasing. Neuroimage. 2003;20:1591–1600. doi: 10.1016/j.neuroimage.2003.07.009. [DOI] [PubMed] [Google Scholar]
- Lehericy S, et al. 3-D diffusion tensor axonal tracking shows distinct SMA and pre-SMA projections to the human striatum. Cereb Cortex. 2004a;14:1302–1309. doi: 10.1093/cercor/bhh091. [DOI] [PubMed] [Google Scholar]
- Lehericy S, et al. Diffusion tensor fiber tracking shows distinct corticostriatal circuits in humans. Ann Neurol. 2004b;55:522–529. doi: 10.1002/ana.20030. [DOI] [PubMed] [Google Scholar]
- MacKay A, et al. Insights into brain microstructure from the T2 distribution. Magn Reson Imaging. 2006;24:515–525. doi: 10.1016/j.mri.2005.12.037. [DOI] [PubMed] [Google Scholar]
- Michielse S, et al. Selective effects of aging on brain white matter microstructure: a diffusion tensor imaging tractography study. Neuroimage. 2010;52:1190–1201. doi: 10.1016/j.neuroimage.2010.05.019. [DOI] [PubMed] [Google Scholar]
- Morris DM. Embleton KV. Parker GJ. Probabilistic fibre tracking: differentiation of connections from chance events. Neuroimage. 2008;42:1329–1339. doi: 10.1016/j.neuroimage.2008.06.012. [DOI] [PubMed] [Google Scholar]
- O'Donnell LJ. Westin CF. Automatic tractography segmentation using a high-dimensional white matter atlas. IEEE Trans Med Imaging. 2007;26:1562–1575. doi: 10.1109/TMI.2007.906785. [DOI] [PubMed] [Google Scholar]
- O'Donnell LJ. Westin CF. Golby AJ. Tract-based morphometry for white matter group analysis. Neuroimage. 2009;45:832–844. doi: 10.1016/j.neuroimage.2008.12.023. [DOI] [PMC free article] [PubMed] [Google Scholar]
- Pajevic S. Pierpaoli C. Color schemes to represent the orientation of anisotropic tissues from diffusion tensor data: application to white matter fiber tract mapping in the human brain. Magn Reson Med. 2000;43:921. doi: 10.1002/1522-2594(200006)43:6<921::aid-mrm23>3.0.co;2-i. [DOI] [PubMed] [Google Scholar]
- Parker G. Alexander D. Probabilistic anatomical connectivity derived from the microscopic persistent angular structure of cerebral tissue. Philos Trans R Soc B. 2005;360:893–902. doi: 10.1098/rstb.2005.1639. [DOI] [PMC free article] [PubMed] [Google Scholar]
- Parker GJ. Alexander DC. Probabilistic Monte Carlo based mapping of cerebral connections utilising whole-brain crossing fibre information. Inf Process Med Imaging. 2003;18:684–695. doi: 10.1007/978-3-540-45087-0_57. [DOI] [PubMed] [Google Scholar]
- Parker GJM. Wheeler-Kingshott CAM. Barker GJ. Estimating distributed anatomical connectivity using fast marching methods and diffusion tensor imaging. IEEE Trans Med Imaging. 2002;21:505–512. doi: 10.1109/TMI.2002.1009386. [DOI] [PubMed] [Google Scholar]
- Passingham RE. Stephan KE. Kotter R. The anatomical basis of functional localization in the cortex. Nat Rev Neurosci. 2002;3:606–616. doi: 10.1038/nrn893. [DOI] [PubMed] [Google Scholar]
- Perrin M, et al. Validation of q-ball imaging with a diffusion fibre-crossing phantom on a clinical scanner. Philos Trans R Soc Lond B Biol Sci. 2005;360(1457):881–891. doi: 10.1098/rstb.2005.1650. [DOI] [PMC free article] [PubMed] [Google Scholar]
- Poupon C, et al. New diffusion phantoms dedicated to the study and validation of high-angular-resolution diffusion imaging (HARDI) models. Magn Reson Med. 2008;60:1276–1283. doi: 10.1002/mrm.21789. [DOI] [PubMed] [Google Scholar]
- Reisert M, et al. Global fiber reconstruction becomes practical. Neuroimage. 2011;54:955–962. doi: 10.1016/j.neuroimage.2010.09.016. [DOI] [PubMed] [Google Scholar]
- Rushworth MF. Behrens TE. Johansen-Berg H. Connection patterns distinguish 3 regions of human parietal cortex. Cereb Cortex. 2006;16:1418–1430. doi: 10.1093/cercor/bhj079. [DOI] [PubMed] [Google Scholar]
- Sala S, et al. Microstructural changes and atrophy in brain white matter tracts with aging. Neurobiol Aging. 2010 doi: 10.1016/j.neurobiolaging.2010.04.027. [Epub ahead of print] [DOI] [PubMed] [Google Scholar]
- Savadjiev P, et al. Labeling of ambiguous subvoxel fibre bundle configurations in high angular resolution diffusion MRI. Neuroimage. 2008;41:58–68. doi: 10.1016/j.neuroimage.2008.01.028. [DOI] [PubMed] [Google Scholar]
- Schmahmann JD, et al. Association fibre pathways of the brain: parallel observations from diffusion spectrum imaging and autoradiography. Brain. 2007;130(Pt 3):630–653. doi: 10.1093/brain/awl359. [DOI] [PubMed] [Google Scholar]
- Seunarine KK, et al. Multiple Fibers: Beyond the Diffusion Tensor, in Diffusion MRI. San Diego: Academic Press; 2009. pp. 55–72. [Google Scholar]
- Sherbondy AJ. Rowe MC. Alexander DC. MicroTrack: an algorithm for concurrent projectome and microstructure estimation. Med Image Comput Comput Assist Interv. 2011;13(Pt 1):183–190. doi: 10.1007/978-3-642-15705-9_23. [DOI] [PubMed] [Google Scholar]
- Sillery E, et al. Connectivity of the human periventricular-periaqueductal gray region. J Neurosurg. 2005;103:1030–1034. doi: 10.3171/jns.2005.103.6.1030. [DOI] [PubMed] [Google Scholar]
- Smith SM, et al. Tract-based spatial statistics: voxelwise analysis of multi-subject diffusion data. Neuroimage. 2006;31:1487–1505. doi: 10.1016/j.neuroimage.2006.02.024. [DOI] [PubMed] [Google Scholar]
- Smith SM, et al. Acquisition and voxelwise analysis of multi-subject diffusion data with tract-based spatial statistics. Nat Protoc. 2007;2:499–503. doi: 10.1038/nprot.2007.45. [DOI] [PubMed] [Google Scholar]
- Smith SM, et al. Network modelling methods for FMRI. Neuroimage. 2011;54:875–891. doi: 10.1016/j.neuroimage.2010.08.063. [DOI] [PubMed] [Google Scholar]
- Sotiropoulos SN, et al. Brain tractography using Q-ball imaging and graph theory: improved connectivities through fibre crossings via a model-based approach. Neuroimage. 2010a;49:2444–2456. doi: 10.1016/j.neuroimage.2009.10.001. [DOI] [PubMed] [Google Scholar]
- Sotiropoulos SN, et al. Biomedical Imaging: From Nano to Macro. IEEE International Symposium, Rotterdam; The Netherlands: 2010b. 2010. Exact and Analytic Bayesian Inference for Orientation Distribution Functions. [Google Scholar]
- Sporns O. The human connectome: a complex network. Ann NY Acad Sci. 2011;1224:109–125. doi: 10.1111/j.1749-6632.2010.05888.x. [DOI] [PubMed] [Google Scholar]
- Sporns O. Tononi G. Kotter R. The human connectome: a structural description of the human brain. PLoS Comput Biol. 2005;1:e42. doi: 10.1371/journal.pcbi.0010042. [DOI] [PMC free article] [PubMed] [Google Scholar]
- Stephan KE, et al. Tractography-based priors for dynamic causal models. Neuroimage. 2009;47:1628–1638. doi: 10.1016/j.neuroimage.2009.05.096. [DOI] [PMC free article] [PubMed] [Google Scholar]
- Stufflebeam SM, et al. A non-invasive method to relate the timing of neural activity to white matter microstructural integrity. Neuroimage. 2008;42:710–716. doi: 10.1016/j.neuroimage.2008.04.264. [DOI] [PMC free article] [PubMed] [Google Scholar]
- Tomassini V, et al. Diffusion-weighted imaging tractography-based parcellation of the human lateral premotor cortex identifies dorsal and ventral subregions with anatomical and functional specializations. J Neurosci. 2007;27:10259–10269. doi: 10.1523/JNEUROSCI.2144-07.2007. [DOI] [PMC free article] [PubMed] [Google Scholar]
- Tournier JD, et al. Direct estimation of the fiber orientation density function from diffusion-weighted MRI data using spherical deconvolution. Neuroimage. 2004;23:1176–1185. doi: 10.1016/j.neuroimage.2004.07.037. [DOI] [PubMed] [Google Scholar]
- Tournier JD. Calamante F. Connelly A. Robust determination of the fibre orientation distribution in diffusion MRI: non-negativity constrained super-resolved spherical deconvolution. Neuroimage. 2007;35:1459–1472. doi: 10.1016/j.neuroimage.2007.02.016. [DOI] [PubMed] [Google Scholar]
- Tournier JD. Mori S. Leemans A. Diffusion tensor imaging and beyond. Magn Reson Med. 2011;65:1532–1556. doi: 10.1002/mrm.22924. [DOI] [PMC free article] [PubMed] [Google Scholar]
- Tuch DS, et al. High angular resolution diffusion imaging reveals intravoxel white matter fiber heterogeneity. Magn Reson Med. 2002;48:577–582. doi: 10.1002/mrm.10268. [DOI] [PubMed] [Google Scholar]
- Tuch DS, et al. Diffusion MRI of complex neural architecture. Neuron. 2003;40:885–895. doi: 10.1016/s0896-6273(03)00758-x. [DOI] [PubMed] [Google Scholar]
- Wakana S, et al. Fiber tract-based atlas of human white matter anatomy. Radiology. 2004;230:77–87. doi: 10.1148/radiol.2301021640. [DOI] [PubMed] [Google Scholar]
- Wedeen VJ, et al. Mapping complex tissue architecture with diffusion spectrum magnetic resonance imaging. Magn Reson Med. 2005;54:1377–1386. doi: 10.1002/mrm.20642. [DOI] [PubMed] [Google Scholar]
- Wedeen VJ, et al. Diffusion spectrum magnetic resonance imaging (DSI) tractography of crossing fibers. Neuroimage. 2008;41:1267–1277. doi: 10.1016/j.neuroimage.2008.03.036. [DOI] [PubMed] [Google Scholar]
- Yamada K, et al. MR tractography: a review of its clinical applications. Magn Reson Med Sci. 2009;8:165–174. doi: 10.2463/mrms.8.165. [DOI] [PubMed] [Google Scholar]
- Yamada M, et al. Diffusion-tensor neuronal fiber tractography and manganese-enhanced MR imaging of primate visual pathway in the common marmoset: preliminary results. Radiology. 2008;249:855–864. doi: 10.1148/radiol.2493072141. [DOI] [PubMed] [Google Scholar]
- Yap P, et al. PopTract: population-based tractography. IEEE Trans Med Imaging. 2011 doi: 10.1109/TMI.2011.2154385. [Epub ahead of print] [DOI] [PMC free article] [PubMed] [Google Scholar]
- Yeh FC. Wedeen VJ. Tseng WY. Estimation of fiber orientation and spin density distribution by diffusion deconvolution. Neuroimage. 2011;55:1054–1062. doi: 10.1016/j.neuroimage.2010.11.087. [DOI] [PubMed] [Google Scholar]
- Yushkevich PA, et al. Structure-specific statistical mapping of white matter tracts. Neuroimage. 2008;41:448–461. doi: 10.1016/j.neuroimage.2008.01.013. [DOI] [PMC free article] [PubMed] [Google Scholar]
- Zhang H, et al. Axon diameter mapping in the presence of orientation dispersion with diffusion MRI. Neuroimage. 2011;56:1301–1315. doi: 10.1016/j.neuroimage.2011.01.084. [DOI] [PubMed] [Google Scholar]