

Abstract
Purpose
Tamoxifen treatment is associated with a reduction in mammographic density and an improved survival. However, the extent to which change in mammographic density during adjuvant tamoxifen therapy can be used to measure response to treatment is unknown.
Patients and Methods
Overall, 974 postmenopausal patients with breast cancer who had both a baseline and a follow-up mammogram were eligible for analysis. On the basis of treatment information abstracted from medical records, 474 patients received tamoxifen treatment and 500 did not. Mammographic density was measured by using an automated thresholding method and expressed as absolute dense area. Change in mammographic density was calculated as percentage change from baseline. Survival analysis was performed by using delayed-entry Cox proportional hazards regression models, with death as a result of breast cancer as the end point. Analyses were adjusted for a range of patient and tumor characteristics.
Results
During a 15-year follow-up, 121 patients (12.4%) died from breast cancer. Women treated with tamoxifen who experienced a relative density reduction of more than 20% between baseline and first follow-up mammogram had a reduced risk of death as a result of breast cancer of 50% (hazard ratio, 0.50; 95% CI, 0.27 to 0.93) compared with women with stable mammographic density. In the no-tamoxifen group, there was no statistically significant association between mammographic density change and survival. The survival advantage was not observed when absolute dense areas at baseline or follow-up were evaluated separately.
Conclusion
A decrease in mammographic density after breast cancer diagnosis appears to serve as a prognostic marker for improved long-term survival in patients receiving adjuvant tamoxifen, and these data should be externally validated.
INTRODUCTION
Mammographic density is a modifiable trait and has been suggested to be an intermediate phenotype of breast cancer.1 An increase in mammographic density has been linked to increased breast cancer risk in postmenopausal women who use estrogen/ progestin therapies.2,3 Furthermore, a change in mammographic density seems to reflect the effect of tamoxifen used in primary prevention of breast cancer. In the primary prevention IBIS-1 trial [International Breast Cancer Intervention Study 1], healthy high-risk women were randomly assigned to tamoxifen or placebo. Women who had at least a 10% reduction in mammographic density over the first 1.5 years of tamoxifen prophylaxis had a 63% reduction in breast cancer risk. In contrast, women who did not experience a change in mammographic density had no reduction in breast cancer incidence.4,5
Although tamoxifen-induced breast density change has been shown to mirror breast cancer risk in a primary preventive setting, whether a change in mammographic density can predict the treatment effectiveness among women who have already developed the disease has not been addressed. Although adjuvant therapy has dramatically improved breast cancer survival over the years, not all patients respond positively to such therapy. Currently, there are no means to accurately identify which women will benefit from adjuvant endocrine therapy. Because a reduction in mammographic density appears to be a strong indicator of a woman's response to tamoxifen therapy in a preventive setting,4–9 we tested the hypothesis that density change after adjuvant tamoxifen therapy has an influence on breast cancer–specific survival.
PATIENTS AND METHODS
Patients
We used information on breast cancer cases in a population-based case-control study conducted in Sweden between 1993 and 1995.10–12 Briefly, all women born in Sweden who were age 50 to 74 years old at first diagnosis of invasive breast cancer in the Swedish Cancer Register were eligible (n = 3,979). Of these, 84% (n = 3,345) participated by answering a mailed questionnaire. The mean duration from diagnosis to data collection was 4.3 months (standard deviation [SD], 1.5 months). Women previously diagnosed with invasive cancer (other than nonmelanoma skin cancer) were excluded from the study (n = 112). Because menopause has been associated with distinct reductions in mammographic density, we restricted the analysis to postmenopausal women only. Menopause was defined as the age at last menstrual period or age at bilateral oophorectomy if 1 year or more before data collection. Premenopausal women and women younger than age 55 years with unknown age at menopause were excluded (n = 415). Details on further exclusions based on medical records and mammographic density data are depicted in Figure 1.
Fig 1.

Exclusion criteria.
Data Collection
Data on sociodemographic, anthropometric, reproductive, and menstrual factors, and use of hormone replacement therapy were collected by means of a mailed questionnaire. Information on primary surgery, adjuvant treatment (endocrine therapy, chemotherapy, and radiotherapy), and tumor characteristics was retrieved from patient records from hospitals throughout Sweden.13,14 Grade was classified according to the Nottingham histologic grade or the Bloom-Richardson scale into three groups. Tumors were considered estrogen receptor (ER) –positive if they contained ≥ 0.05 fmol receptor/μg DNA or ≥ 10 fmol receptor/mg protein. The date and cause of death until December 31, 2008, was collected from the Swedish Causes of Death Registry.15
Approval of the study was given by the ethical review board at Karolinska Institutet (Stockholm, Sweden) and six other ethical review boards in the respective regions in which the patients were based. Analyses were carried out for all participants who gave informed consent.
Mammograms and Mammographic Density Measurement
Details on the collection of mammograms and measurement of mammographic density have been described elsewhere.16,17 By using national registration numbers18 that are assigned to all patients living in Sweden, the current addresses from 1975 to 1995 were obtained for all participants through the nationwide population registry. Mammograms were then retrieved from radiology departments conducting screening mammography for those addresses.
The start date of treatment was set as the reference date for women who received adjuvant tamoxifen therapy a median of 45 days after diagnosis. For women who did not receive tamoxifen, the date of breast cancer diagnosis was used.
All participating women were required to have at least two mammograms: one baseline mammogram taken at most 1 year before the date of reference and one follow-up mammogram taken at least 6 months after the date of reference but less than 3 years after the baseline mammogram. Only mediolateral oblique views of the breast unaffected by breast cancer were used because other views (eg, cranial-caudal) were not routinely used for screening mammography. None of the women included in this study had bilateral breast cancer.
Film mammograms were digitized by using an Array 2905HD Laser Film Digitizer (Array Corp, Tokyo, Japan). All density measurements were obtained by using an automated thresholding method previously described in Li et al.17 The machine learning method incorporates the knowledge of a trained reader (L.E.) by using segmentations obtained by Cumulus19 as training data. Because tamoxifen has been associated with a decrease in parenchymal tissue, which is reflected as dense areas on a mammogram, absolute dense area (DA) in square centimeters was considered in our analyses. Externally validated results showed a high correspondence between the automated method and the user-assisted threshold method (Pearson's correlation coefficient = 0.872 for DA).
Statistical Analysis
Associations between patient characteristics and treatment were evaluated by the χ2 test or Welch's two-sample t test, as appropriate. There was a strong association between DA at baseline and change in DA (ΔDA, P < .001). To adjust for DA at baseline, ΔDA was measured as percentage change of DA from baseline: (Follow-up − Baseline)*100/Baseline. Because of the sensitivity to small errors and the inability to assess percentage change, patients in the lowest quintile of baseline DA (range, 0.1 to 10.8 cm2) were excluded. Women were observed from the date of breast cancer diagnosis until death, emigration, or end of follow-up (December 31, 2008), whichever came first. Cause-specific deaths as a result of breast cancer were ascertained by using the cause of death register (codes 174 and C50, according to the International Classification of Diseases, Ninth and Tenth Revisions, respectively). Because we are interested in evaluating ΔDA as a prognostic marker for response to endocrine treatment, a follow-up mammogram allowing time for treatment and mammographic density change to take effect is necessary for assessment. Patients who died or were censored before a follow-up mammogram was obtained were therefore excluded.
After testing the validity of the proportional hazards assumption by using Schoenfeld's residuals, a delayed-entry Cox proportional hazards model (coxph procedure) was fitted to examine whether ΔDA influenced survival stratified by tamoxifen therapy. This model adjusts for the fact that women entered the study (when follow-up mammogram was taken) at 6 to 36 months beyond their initial date of tamoxifen use or date of diagnosis and were not under observation for a possible event before study entry. Because the use of categorical cutoff points allows for an easy application and interpretation, we specified and categorized ΔDA into four levels a priori (≥ 10% increase, 9% increase to 10% reduction, 11% to 20% reduction, and > 20% reduction) corresponding to increased density, stable density, mild reduction, and pronounced density reduction.
Analysis was restricted to patients with complete covariate information. However, due to the high proportion of missing data for grade (30.3%) and ER status (29.8%), patients with missing values were included in the analyses and coded as a separate missing category. Unadjusted models included only ΔDA as a categorical variable. Models were also fitted to adjust for time interval between baseline and follow-up mammograms (years), age at baseline mammogram (years), ever hormone replacement therapy use (yes/no), body mass index (BMI) at interview (quartiles), time since menopause at baseline mammogram (years), ER status (positive, negative, or missing), tumor size (< 10, 10 to 19, 20 to 29, 30 to 39, 40 to 49, or ≥ 50 mm), number of metastatic nodes (none, 1 to 3, 4 to 9, or > 9), grade (well differentiated, moderately differentiated, poorly differentiated, or missing), radiotherapy treatment (yes/no), and chemotherapy treatment (yes/no). Because we do not have data regarding baseline and follow-up BMI for the women in the study, quartile of percentage change in nondense area was used as a proxy for BMI and included as a covariate in the analysis. Models including all women were further adjusted for tamoxifen treatment (yes/no). Ten women in the tamoxifen-treated group (2.1%) were prescribed toremifene, a chlorinated derivative of tamoxifen. When treated and untreated women were analyzed separately, the model for women treated with tamoxifen also included duration of tamoxifen treatment. P values for tests for trend were obtained by treating categories of ΔDA as an ordinal variable.
To investigate whether the prognostic value is restricted to the ΔDA between baseline and follow-up mammograms, unadjusted and adjusted Cox proportional hazards models were fitted to test the association between quintiles of baseline and follow-up DA and breast cancer–specific survival separately. Delayed-entry models were fitted for the analysis of quintiles that DA measured at baseline and follow-up separately. The statistical software R, version 2.13.020 was used for data cleaning, data analysis, and visualization. The RcmdrPlugin.survival package21 was used to plot the predicted survival function from coxph objects. All reported P values were two-sided.
RESULTS
Altogether, 1,295 women with both a baseline and follow-up mammogram taken not more than 3 years apart were identified. Of these, 243 had a baseline DA in the lowest quintile and were excluded; 974 women with complete covariate information remained for the main analysis. During a median of 14.2 years (range, 1.0 to 15.3 years) of follow-up, 121 women died as a result of breast cancer. Women who died as a result of breast cancer were not significantly different from women who were censored in terms of age at baseline mammogram, time interval between baseline and follow-up mammograms, and DA at baseline and follow-up (Appendix Table A1, online only). When comparing tamoxifen treatment groups, reproductive, hormonal, and anthropometric characteristics were well-balanced (Table 1). Tumor characteristics were found to be more favorable in the treatment-free group. Among the women who did not receive tamoxifen, there were higher proportions of well-differentiated, small, and hormone receptor–negative tumors and considerably fewer patients with axillary lymph node metastases. Radiotherapy was also more often prescribed among women who did not receive tamoxifen. After excluding patients with DA in the lowest quintile at baseline, there was a reduction in mean DA relative to baseline for both treated and nontreated groups at follow-up. DA on the baseline mammogram ranged from 10.8 to 135.4 cm2 with a median of 27.4 cm2. The age-adjusted magnitude of change was significantly greater in women who received tamoxifen (mean, −5.3 [SD, 13.4] for tamoxifen-treated group; mean, −3.7 [SD, 12.4] for the no-tamoxifen group; P = .03). DA at baseline and time between baseline and follow-up mammograms did not differ significantly between women who received tamoxifen and those who did not.
Table 1.
Description of Selected Characteristics of Study Participants at Interview
| Characteristic | No Tamoxifen (n = 500) |
Tamoxifen (n = 474) |
P | ||
|---|---|---|---|---|---|
| No. | % | No. | % | ||
| Age at breast cancer diagnosis, years | .143 | ||||
| 50-59 | 207 | 41.4 | 179 | 37.8 | |
| 60-69 | 227 | 45.4 | 219 | 46.2 | |
| ≥ 70 | 66 | 13.2 | 76 | 16.0 | |
| Median | 62 | 63 | |||
| IQR | 10 | 11 | |||
| Body mass index at diagnosis, kg/m2 | .800 | ||||
| < 25 | 251 | 50.2 | 246 | 51.9 | |
| 25-29.9 | 197 | 39.4 | 168 | 35.4 | |
| 30-34.9 | 45 | 9.0 | 51 | 10.8 | |
| ≥ 35 | 7 | 1.4 | 9 | 1.9 | |
| Median | 25 | 24.8 | |||
| IQR | 4.6 | 5 | |||
| Ever use of hormone replacement therapy | .292 | ||||
| No | 230 | 46.0 | 235 | 49.6 | |
| Yes | 270 | 54.0 | 239 | 50.4 | |
| Tumor grade (%)* | .067 | ||||
| Well differentiated | 1 | 0.2 | 60 | 12.7 | |
| Moderately differentiated | 2 | 0.4 | 154 | 32.5 | |
| Poorly differentiated | 3 | 0.6 | 124 | 26.2 | |
| Missing | 162 | 32.4 | 131 | 27.6 | |
| Tumor size, mm | < .001 | ||||
| < 10 | 134 | 26.8 | 67 | 14.1 | |
| 10-19 | 278 | 55.6 | 191 | 40.3 | |
| 20-29 | 65 | 13 | 146 | 30.8 | |
| 30-39 | 16 | 3.2 | 37 | 7.8 | |
| 40-49 | 6 | 1.2 | 19 | 4.0 | |
| ≥ 50 | 1 | 0.2 | 14 | 3.0 | |
| No. of metastatic nodes | < .001 | ||||
| None | 471 | 94.2 | 247 | 52.1 | |
| 1-3 | 18 | 3.6 | 170 | 35.9 | |
| 4-9 | 6 | 1.2 | 45 | 9.5 | |
| > 9 | 5 | 1 | 12 | 2.5 | |
| Estrogen receptor status† | < .001 | ||||
| Negative | 84 | 16.8 | 58 | 12.2 | |
| Positive | 238 | 47.6 | 327 | 69.0 | |
| Missing | 178 | 35.6 | 89 | 18.8 | |
| Treatment | |||||
| Radiation | < .001 | ||||
| No | 207 | 41.4 | 296 | 62.4 | |
| Yes | 293 | 58.6 | 178 | 37.6 | |
| Chemotherapy | .459 | ||||
| No | 471 | 94.2 | 440 | 92.8 | |
| Yes | 29 | 5.8 | 34 | 7.2 | |
| Surgery | < .001 | ||||
| Lumpectomy | 362 | 72.4 | 241 | 50.8 | |
| Mastectomy | 138 | 27.6 | 233 | 49.2 | |
| Tamoxifen dose prescribed, mg per day | N/A | ||||
| 20 | N/A | 231 | 48.7 | ||
| 40 | N/A | 123 | 26.0 | ||
| 20 + 40 | N/A | 108 | 22.8 | ||
| Other | N/A | 12 | 2.5 | ||
| Length of tamoxifen treatment, months | |||||
| < 12 | N/A | 37 | 7.8 | N/A | |
| 12-23 | N/A | 58 | 12.2 | ||
| 24-35 | N/A | 76 | 16.0 | ||
| 36-59 | N/A | 61 | 12.9 | ||
| ≥ 60 | N/A | 242 | 51.1 | ||
| Median | N/A | 60 | |||
| IQR | 36 | ||||
| No. of breast cancer deaths | .002 | ||||
| Censored | 454 | 90.8 | 399 | 84.2 | |
| Event | 46 | 9.2 | 75 | 15.8 | |
| Age at baseline mammogram, years | .161 | ||||
| 49-59 | 207 | 41.4 | 181 | 38.2 | |
| 60-69 | 230 | 46 | 223 | 47.0 | |
| ≥ 70 | 63 | 12.6 | 70 | 14.8 | |
| Median | 61 | 63 | |||
| IQR | 10 | 10 | |||
| Absolute dense area at baseline, cm2 | .844 | ||||
| 0-10 | 0 | 0 | 0 | 0 | |
| 11-25 | 229 | 45.8 | 198 | 41.8 | |
| 26-50 | 189 | 37.8 | 192 | 40.5 | |
| 51-75 | 59 | 11.8 | 64 | 13.5 | |
| > 75 | 23 | 4.6 | 20 | 4.2 | |
| Median | 26.4 | 28.4 | |||
| IQR | 22 | 23.4 | |||
| Time difference between baseline and follow-up mammogram, years (mean, SD) | 1.39, 0.48 | 1.42, 0.48 | .300 | ||
NOTE. Patient characteristics were evaluated by two-sided χ2 test or Welch's two-sample t test between the treatment groups.
Abbreviations: IQR, interquartile range; N/A, not applicable; SD, standard deviation.
Grade was classified according to the Nottingham histologic grade or the Bloom-Richardson scale into three groups. Grade was not routinely assessed during the time period of this study.
Tumors were considered estrogen receptor–positive or progesterone receptor–positive if they contained ≥ 0.05 fmol receptor/μg DNA or ≥ 10 fmol receptor/mg protein. Estrogen receptor and progesterone receptor content of breast tumors were routinely measured in Sweden at the time of the study but were often not done on tumors of less than 1 cm because of lack of tumor tissue.
In the tamoxifen-treated group, 35% of the women who died as a result of breast cancer had a reduction of DA of 20% or more compared with 48% in women who did not die as a result of breast cancer (P = .017; Table 2). Among women treated with tamoxifen who experienced a decrease in DA of 20% or more, the relative risk of death was 0.50 (95% CI, 0.27 to 0.93) compared with that of women treated with tamoxifen who had stable mammographic density (−9% to 10% percentage change). Further adjustment for surgery (ie, lumpectomy or mastectomy) and tamoxifen dosage, which ranged between 20 and 40 mg per day, did not appreciably change the results. Although the relationship between ΔDA and survival in the no-tamoxifen group did not reach statistical significance (Ptrend = .200), a trend for better survival was seen with a decrease in DA. The evidence for a survival benefit associated with a reduction in DA persisted when the analysis was performed on the combined cohort of both tamoxifen-treated and untreated women (Ptrend = .045). When we expanded our analyses to include an alternative method of assessing change (ie, absolute difference), we observed similar trends of significantly better survival with mammographic density reduction among women treated with tamoxifen (Appendix Table A2, online only). When another mammographic density measure—percent density—was assessed, the trends persisted but the results were not significant.
Table 2.
Estimated HRs and 95% CIs for Breast Cancer–Specific Death As an End Point Based on Mammographic Density Change in Absolute Dense Area (cm2)
| Categories | No. of Patients | No. of Events | Unadjusted |
Adjusted |
||||
|---|---|---|---|---|---|---|---|---|
| HR | 95% CI | Ptrend | HR | 95% CI | Ptrend | |||
| Tamoxifen* | ||||||||
| ≥ 10% increase | 113 | 18 | 0.66 | 0.35 to 1.24 | .110 | 0.99 | 0.50 to 1.94 | .017 |
| No change (−10%-9%) | 89 | 21 | 1.00 | Reference | 1.00 | Reference | ||
| 11%–20% reduction | 55 | 10 | 0.73 | 0.35 to 1.56 | 0.90 | 0.40 to 2.04 | ||
| > 20% reduction | 217 | 26 | 0.48 | 0.27 to 0.85 | 0.50 | 0.27 to 0.93 | ||
| No tamoxifen | ||||||||
| ≥ 10% increase | 123 | 13 | 1.02 | 0.47 to 2.24 | .350 | 1.29 | 0.56 to 2.98 | .200 |
| No change (−10%-9%) | 112 | 12 | 1.00 | Reference | 1.00 | Reference | ||
| 11%–20% reduction | 53 | 4 | 0.69 | 0.22 to 2.15 | 1.03 | 0.32 to 3.37 | ||
| > 20% reduction | 212 | 17 | 0.76 | 0.36 to 1.59 | 0.73 | 0.31 to 1.71 | ||
| Overall† | ||||||||
| ≥ 10% increase | 236 | 31 | 0.81 | 0.49 to 1.32 | .085 | 1.06 | 0.64 to 1.77 | .005 |
| No change (−10%-9%) | 201 | 33 | 1.00 | Reference | 1.00 | Reference | ||
| 11%–20% reduction | 108 | 14 | 0.77 | 0.41 to 1.44 | 0.85 | 0.44 to 1.62 | ||
| > 20% reduction | 429 | 43 | 0.60 | 0.38 to 0.94 | 0.56 | 0.35 to 0.91 | ||
NOTE. Unadjusted models included only density change as a categorical variable. Models were also fitted to adjust for time interval between baseline and follow-up mammograms (years), age at baseline mammogram (years), ever hormone replacement therapy use (yes/no), body mass index at interview (quartiles), time since menopause at baseline mammogram (years), estrogen receptor status (positive, negative, or missing), tumor size (< 10, 10-19, 20-29, 30-39, 40-49 or ≥ 50 mm), number of metastatic nodes (none, 1-3, 4-9 or > 9), grade (well differentiated, moderately differentiated, poorly differentiated, or missing), radiotherapy treatment (yes/no), chemotherapy treatment (yes/no), and change in absolute nondense area (quartiles). Analyses for overall and tamoxifen-treated groups were additionally adjusted for tamoxifen treatment (yes/no) and length of tamoxifen treatment (months), respectively. P values for trend tests were obtained by treating density change as an ordinal variable.
Abbreviation: HR, hazard ratio.
Additionally adjusted for duration of tamoxifen treatment (months).
Additionally adjusted for tamoxifen treatment (Yes/No).
The plots of predicted survival functions for the no-tamoxifen and tamoxifen-treated groups are displayed in Figure 2. Divergence of survival curves is noticeable after 5 years for the tamoxifen-treated group. This survival advantage was observed only when ΔDA was assessed and not when baseline or follow-up DA were evaluated separately (Table 3).
Fig 2.
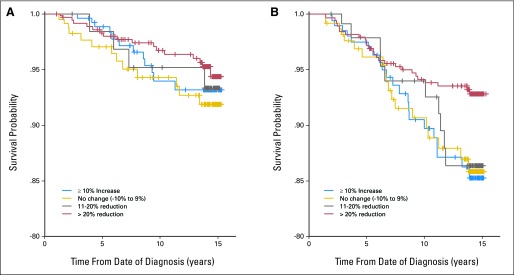
Predicted survival functions from delayed-entry Cox proportional hazards regression models for (A) women not treated with tamoxifen and (B) women treated with tamoxifen. This model adjusts for the fact that women enter the study (when follow-up mammogram was taken) at 6 to 36 months beyond their initial diagnosis and are not under observation for a possible event before study entry.
Table 3.
Estimated HRs and 95% CIs for Breast Cancer–Specific Death as an End Point Based on Baseline or Follow-Up Mammogram, Separately
| Categories | Lower Cutoff (cm2) | Upper Cutoff (cm2) | No. of Patients | Events | Unadjusted |
Adjusted |
||||
|---|---|---|---|---|---|---|---|---|---|---|
| HR | 95% CI | Ptrend | HR | 95% CI | Ptrend | |||||
| Baseline | ||||||||||
| Q1 | 0.14 | 10.83 | 244 | 30 | 1.00 | Reference | .920 | 1.00 | Reference | .750 |
| Q2 | 10.85 | 18.02 | 243 | 32 | 1.13 | 0.69 to 1.85 | 1.05 | 0.63 to 1.75 | ||
| Q3 | 18.05 | 27.34 | 243 | 26 | 0.86 | 0.51 to 1.46 | 1.01 | 0.58 to 1.73 | ||
| Q4 | 27.46 | 41.00 | 243 | 31 | 1.02 | 0.62 to 1.68 | 1.00 | 0.59 to 1.69 | ||
| Q5 | 41.05 | 135.41 | 244 | 31 | 1.02 | 0.62 to 1.68 | 0.94 | 0.55 to 1.59 | ||
| Follow-up | ||||||||||
| Q1 | 0.00 | 9.49 | 244 | 34 | 1.00 | Reference | .900 | 1.00 | Reference | .840 |
| Q2 | 9.49 | 16.46 | 243 | 28 | 0.81 | 0.49 to 1.34 | 0.84 | 0.50 to 1.41 | ||
| Q3 | 16.48 | 24.94 | 243 | 28 | 0.83 | 0.50 to 1.36 | 0.95 | 0.56 to 1.62 | ||
| Q4 | 24.99 | 35.92 | 243 | 25 | 0.72 | 0.43 to 1.20 | 0.74 | 0.43 to 1.28 | ||
| Q5 | 35.93 | 148.56 | 244 | 35 | 1.02 | 0.63 to 1.63 | 1.10 | 0.67 to 1.81 | ||
NOTE. Unadjusted models included only quintiles of absolute dense area as a categorical variable. Models were also fitted to adjust for age at mammogram (years), ever hormone replacement therapy use (yes/no), body mass index at interview (quartiles), estrogen receptor status (positive, negative, or missing), tumor size (< 10, 10-19, 20-29, 30-39, 40-49 or ≥ 50 mm), number of metastatic nodes (none, 1-3, 4-9 or > 9), grade (well differentiated, moderately differentiated, poorly differentiated, or missing), tamoxifen treatment (yes/no), radiotherapy treatment (yes/no), and chemotherapy treatment (yes/no). P values for trend tests were obtained by treating quintiles of absolute dense area as an ordinal variable.
Abbreviations: HR, hazard ratio; Q, quintile.
DISCUSSION
Tamoxifen-treated women with a relative reduction of DA of more than 20% had a 50% decrease in the risk of dying as a result of breast cancer when compared with women who experienced relatively little or no change. The results did not change after controlling for predictors of mammographic density, tumor characteristics, and breast cancer therapy. The survival advantage was observed only when ΔDA was assessed and not when baseline or follow-up DA were evaluated separately. A statistically significant association between ΔDA and breast cancer–specific survival was not observed in women not treated with tamoxifen.
Among postmenopausal patients with breast cancer, ΔDA over time is mainly a result of age, cessation of hormone replacement therapy, and adjuvant endocrine therapy, such as selective ER modulators, of which tamoxifen is one of the oldest and most-prescribed variants. After adjusting for age at mammogram, a significantly greater mean reduction DA was observed in the tamoxifen group when compared with the no-tamoxifen group. The association of ΔDA and risk of death as a result of breast cancer was found only among women who were prescribed tamoxifen, suggesting that ΔDA could be a convenient biomarker for tamoxifen therapy response. There was a significant difference between the established prognostic markers of the tamoxifen and no-tamoxifen group (Table 1) because the early adjuvant tamoxifen trials targeted women with node-positive disease.22
The late separation of survival curves in the tamoxifen-treated group 5 years from date of breast cancer diagnosis is noteworthy. In contrast to treatment-associated ΔDA, established prognostic indicators such as ER status or tumor size typically have an effect on breast cancer–specific survival within the first 5 years, after which survival curves tend to converge.23 For women who survived at least until they received a follow-up mammogram after treatment, the prognostic value of ΔDA assessed from the baseline and follow-up mammogram is informative up to 15 years past diagnosis, suggesting that ΔDA can serve as an early indicator of treatment response with long-term implications for breast cancer–specific survival.
One could argue that a limitation to our study is the observational design, but since it is impossible to randomly assign a density decrease or lack thereof, a randomized clinical trial is not possible. Despite our adjustment for relevant covariates, residual confounding and confounding by unknown factors related to both mammographic density and breast cancer survival may persist. It should also be noted that some characteristics of our study population may limit generalizability to other breast cancer populations. For example, few women received chemotherapy (< 10%), not all women with ER-positive breast cancer received tamoxifen, and the standard of care has changed such that aromatase inhibitors are also used to treat ER-positive breast cancer. Future work is needed to corroborate our findings in prospective cohort studies. In addition, our results may be generalizable only to longer-term breast cancer survivors (ie, only women who have lived long enough after diagnosis for the treatment to take effect and also to get a follow-up mammogram). However, since the probability of a women recently diagnosed with breast cancer surviving 5 years is nearly 90%,24 our findings still hold considerable clinical importance for the long-term prognosis of breast cancer. Moreover, because of the adverse effects of tamoxifen, discontinuation of the drug by the patient is a common clinical challenge.25 It is conceivable that the association between ΔDA and breast cancer survival in the tamoxifen-treated group could be explained by differences in compliance or response to treatment (eg, due to genetic variation in the CYP2D6 gene26). That said, both reasons for lack of density change are clinically important, and failure to account for compliance should not be seen as a weakness.
Factors associated with the acquisition of the mammographic images, such as variability in breast positioning, may affect the reliability of the mammographic measurements. Because DA, and not the entire breast, is more likely to be fully caught in the image, we chose to focus on ΔDA, rather than changes in percent density. Another motivation for basing change of mammographic density on DA in our study, which lacks data on BMI at baseline and follow-up mammogram, is that, although percent density is highly and inversely correlated with BMI (through BMI's strong association with nondense area), DA has been shown to be only weakly associated with BMI, if at all.27,28
We chose to conduct the study among postmenopausal women only because then ΔDA is less likely to be as a result of hormonal changes occurring during menopause. However, because postmenopausal women generally have lower mammographic density, clinically useful measures of ΔDA are more difficult to detect when compared with premenopausal (and younger) women.8,29,30 It is thus possible that assessment of ΔDA may prove more useful in premenopausal women. Further strengths of our study include the long follow-up, reliable clinical data from a previous nationwide case-control study and medical records, and data from national registries.
To the best of our knowledge, this is the first time mammographic density change has been used as a prognostic marker of response to tamoxifen. We observed that women treated with tamoxifen who experienced mammographic density reduction were associated with substantially better long-term breast cancer–specific survival. If validated, mammographic density change has the potential to be an early marker for therapy response and provide clinicians with a tool for monitoring the effect of postsurgical adjuvant therapy beyond the current wait-and-see approach. In fact, given ongoing developments in automatic algorithms for mammographic density measurement, implementing this as a routine clinical tool could be cost-effective.
Supplementary Material
Appendix
Table A1.
Description of Selected Characteristics of Patients Eligible for Analysis by Outcome (n = 974)
| Characteristic | Censored (n = 853) |
No. of Patients Dead as a Result of Breast Cancer (n = 121) |
P | ||
|---|---|---|---|---|---|
| No. | % | No. | % | ||
| Age at breast cancer diagnosis, years | 62 | 10 | 61 | 10 | .125 |
| Body mass index at diagnosis, kg/m2 | 24.8 | 4.8 | 26 | 4.8 | .209 |
| Ever use of hormone replacement therapy | .008 | ||||
| No | 393 | 46.1 | 72 | 59.5 | |
| Yes | 460 | 53.9 | 49 | 40.5 | |
| Tumor grade | |||||
| Well-differentiated | 102 | 12 | 6 | 5 | .048 |
| Moderately differentiated | 261 | 30.6 | 36 | 29.8 | |
| Poorly differentiated | 232 | 27.2 | 44 | 36.4 | |
| Missing | 258 | 30.2 | 35 | 28.9 | |
| Tumor size, mm | < .001 | ||||
| < 10 | 189 | 22.2 | 12 | 9.9 | |
| 10-19 | 425 | 49.8 | 44 | 36.4 | |
| 20-29 | 168 | 19.7 | 43 | 35.5 | |
| 30-39 | 42 | 4.9 | 11 | 9.1 | |
| 40-49 | 19 | 2.2 | 6 | 5 | |
| ≥ 50 | 10 | 1.2 | 5 | 4.1 | |
| No. of metastatic nodes | < .001 | ||||
| None | 667 | 78.2 | 51 | 42.1 | |
| 1-3 | 148 | 17.4 | 40 | 33.1 | |
| 4-9 | 33 | 3.9 | 18 | 14.9 | |
| > 9 | 5 | 0.6 | 12 | 9.9 | |
| Estrogen receptor status | .003 | ||||
| Negative | 113 | 13.2 | 29 | 24.0 | |
| Positive | 497 | 58.3 | 68 | 56.2 | |
| Missing | 243 | 28.5 | 24 | 19.8 | |
| Treatment | |||||
| Radiation | < .001 | ||||
| No | 419 | 49.1 | 84 | 69.4 | |
| Yes | 434 | 50.9 | 37 | 30.6 | |
| Chemotherapy | < .001 | ||||
| No | 810 | 95 | 101 | 83.5 | |
| Yes | 43 | 5 | 20 | 16.5 | |
| Surgery | < .001 | ||||
| Lumpectomy | 549 | 64.4 | 54 | 44.6 | |
| Mastectomy | 304 | 35.6 | 67 | 55.4 | |
| Local recurrence in breast | .151 | ||||
| No | 843 | 98.8 | 117 | 96.7 | |
| Yes | 10 | 1.2 | 4 | 3.3 | |
| Age at baseline mammogram, years | 62 | 10 | 62 | 11 | .169 |
| Absolute dense area at baseline, cm2 | 27.3 | 22.9 | 27.7 | 24.1 | .936 |
| Absolute dense area at follow-up, cm2 | 24.6 | 20.2 | 24.7 | 21.9 | .634 |
| Time difference between baseline and follow-up mammogram, years | 1.2 | 0.6 | 1.2 | 0.6 | .465 |
NOTE. Medians with interquartile ranges (IQRs) are presented for continuous variables; counts with percentages are presented for categorical variables. Patient characteristics were evaluated by two-sided χ2 test or t test between the treatment groups.
Table A2.
Summary of Survival Analysis Results for Relative and Absolute Density Changes of Absolute Dense Area and Percent Density
| Variable | Percentage Change |
Absolute Change |
||||||||
|---|---|---|---|---|---|---|---|---|---|---|
| No. of Breast Cancer–Specific Deaths | HR | 95% CI | Ptrend* | Pcont† | No. of Breast Cancer–Specific Deaths | HR | 95% CI | Ptrend* | Pcont† | |
| Absolute dense area (cm2) | ||||||||||
| Tamoxifen | ||||||||||
| Q1 | 21 | 1.00 (Reference) | .036 | .075 | 21 | 1.00 (Reference) | .024 | .074 | ||
| Q2 | 23 | 0.74 | 0.39 to 1.40 | 24 | 0.94 | 0.51 to 1.73 | ||||
| Q3 | 13 | 0.46 | 0.22 to 0.96 | 13 | 0.52 | 0.25 to 1.09 | ||||
| Q4 | 18 | 0.53 | 0.26 to 1.04 | 17 | 0.46 | 0.20 to 1.04 | ||||
| No tamoxifen | ||||||||||
| Q1 | 13 | 1.00 (Reference) | .230 | .590 | 13 | 1.00 (Reference) | .600 | .620 | ||
| Q2 | 13 | 0.83 | 0.37 to 1.88 | 12 | 0.87 | 0.38 to 1.99 | ||||
| Q3 | 10 | 0.64 | 0.26 to 1.57 | 8 | 0.31 | 0.11 to .87 | ||||
| Q4 | 10 | 0.60 | 0.23 to 1.55 | 13 | 1.23 | 0.49 to 3.08 | ||||
| Overall | ||||||||||
| Q1 | 33 | 1.00 (Reference) | .024 | .063 | 33 | 1.00 (Reference) | .052 | .053 | ||
| Q2 | 33 | 0.82 | 0.49 to 1.35 | 35 | 0.94 | 0.58 to 1.55 | ||||
| Q3 | 27 | 0.61 | 0.36 to 1.04 | 21 | 0.42 | 0.24 to .76 | ||||
| Q4 | 28 | 0.57 | 0.33 to 0.97 | 32 | 0.77 | 0.43 to 1.39 | ||||
| Percent density | ||||||||||
| Tamoxifen | ||||||||||
| Q1 | 21 | 1.00 (Reference) | .130 | .200 | 20 | 1.00 (Reference) | .075 | .210 | ||
| Q2 | 22 | 0.62 | 0.32 to 1.19 | 20 | 0.67 | 0.34 to 1.29 | ||||
| Q3 | 12 | 0.44 | 0.20 to 0.94 | 16 | 0.61 | 0.30 to 1.23 | ||||
| Q4 | 20 | 0.61 | 0.32 to 1.19 | 19 | 0.50 | 0.23 to 1.09 | ||||
| No tamoxifen | ||||||||||
| Q1 | 13 | 1.00 (Reference) | .210 | .480 | 12 | 1.00 (Reference) | .970 | .260 | ||
| Q2 | 13 | 0.68 | 0.29 to 1.57 | 15 | 1.31 | 0.55 to 3.12 | ||||
| Q3 | 8 | 0.49 | 0.19 to 1.27 | 3 | 0.19 | 0.05 to .74 | ||||
| Q4 | 12 | 0.61 | 0.25 to 1.48 | 16 | 1.78 | 0.72 to 4.42 | ||||
| Overall | ||||||||||
| Q1 | 34 | 1.00 (Reference) | .071 | .120 | 34 | 1.00 (Reference) | .045 | .100 | ||
| Q2 | 33 | 0.65 | 0.40 to 1.07 | 35 | 0.81 | 0.50 to 1.33 | ||||
| Q3 | 20 | 0.45 | 0.25 to 0.80 | 18 | 0.39 | 0.22 to .71 | ||||
| Q4 | 34 | 0.65 | 0.39 to 1.08 | 34 | 0.72 | 0.41 to 1.26 | ||||
NOTE. Models were fitted to adjust for time interval between baseline and follow-up mammograms (years), age at baseline mammogram (years), ever hormone replacement therapy use (yes/no), body mass index at interview (quartiles), estrogen receptor status (positive, negative, or missing), tumor size (< 10, 10-19, 20-29, 30-39, 40-49 or ≥ 50 mm), No. of metastatic nodes (none, 1-3, 4-9 or > 9), grade (well differentiated, moderately differentiated, poorly differentiated, or missing), radiotherapy treatment (yes/no), chemotherapy treatment (yes/no), and change in absolute nondense area (quartiles, for analyses involving absolute dense area only, due to collinearity with percent density). Baseline density (absolute dense area or percent density) was included as a continuous covariate in models evaluating absolute change. Analyses for overall and tamoxifen-treated groups were also adjusted for tamoxifen treatment (yes/no) and length of tamoxifen treatment (months), respectively. Q1, least reduction; Q4, most pronounced reduction.
Abbreviations: HR, hazard ratio; Q, quartile.
P value for trend test obtained by treating density change as an ordinal variable.
P value of Wald test treating density change as a continuous variable.
Footnotes
Supported by Marit and Hans Rausing's Initiative Against Breast Cancer, and by the Agency for Science, Technology and Research, Singapore (J.L.); by Grants No. W81XWH-05-1-0314 (Innovator award) from the US Department of Defense Breast Cancer Research Program, No. 523-2006-972 from the Swedish Research Council and the Swedish E-Science Research Centre (K.H.), No. 5128-B07-01PAF from the Swedish Cancer Society (K.C.), and by a postdoctoral grant from Svenska Sällskapet för Medicinsk Forskning (G.E.).
Disclaimers: This study has not been presented elsewhere.
Authors' disclosures of potential conflicts of interest and author contributions are found at the end of this article.
AUTHORS' DISCLOSURES OF POTENTIAL CONFLICTS OF INTEREST
The author(s) indicated no potential conflicts of interest.
AUTHOR CONTRIBUTIONS
Conception and design: Jingmei Li, Keith Humphreys, Gustaf Edgren, Kamila Czene, Per Hall
Financial support: Per Hall
Administrative support: Per Hall
Provision of study materials or patients: Per Hall
Collection and assembly of data: Jingmei Li, Keith Humphreys, Kamila Czene, Per Hall
Data analysis and interpretation: Jingmei Li, Keith Humphreys, Louise Eriksson, Gustaf Edgren, Kamila Czene, Per Hall
Manuscript writing: All authors
Final approval of manuscript: All authors
REFERENCES
- 1.Boyd NF, Rommens JM, Vogt K, et al. Mammographic breast density as an intermediate phenotype for breast cancer. Lancet Oncol. 2005;6:798–808. doi: 10.1016/S1470-2045(05)70390-9. [DOI] [PubMed] [Google Scholar]
- 2.Greendale GA, Reboussin BA, Slone S, et al. Postmenopausal hormone therapy and change in mammographic density. J Natl Cancer Inst. 2003;95:30–37. doi: 10.1093/jnci/95.1.30. [DOI] [PubMed] [Google Scholar]
- 3.McTiernan A, Martin CF, Peck JD, et al. Estrogen-plus-progestin use and mammographic density in postmenopausal women: Women's Health Initiative randomized trial. J Natl Cancer Inst. 2005;97:1366–1376. doi: 10.1093/jnci/dji279. [DOI] [PubMed] [Google Scholar]
- 4.Cuzick J, Warwick J, Pinney E, et al. Tamoxifen and breast density in women at increased risk of breast cancer. J Natl Cancer Inst. 2004;96:621–628. doi: 10.1093/jnci/djh106. [DOI] [PubMed] [Google Scholar]
- 5.Cuzick J, Warwick J, Pinney E, et al. Tamoxifen-induced reduction in mammographic density and breast cancer risk reduction: A nested case-control study. J Natl Cancer Inst. 2011;103:744–752. doi: 10.1093/jnci/djr079. [DOI] [PubMed] [Google Scholar]
- 6.Ursin G, Pike MC, Spicer DV, et al. Can mammographic densities predict effects of tamoxifen on the breast? J Natl Cancer Inst. 1996;88:128–129. doi: 10.1093/jnci/88.2.128-a. [DOI] [PubMed] [Google Scholar]
- 7.Konez O, Goyal M, Reaven RE. Can tamoxifen cause a significant mammographic density change in breast parenchyma? Clin Imaging. 2001;25:303–308. doi: 10.1016/s0899-7071(01)00329-1. [DOI] [PubMed] [Google Scholar]
- 8.Brisson J, Brisson B, Coté G, et al. Tamoxifen and mammographic breast densities. Cancer Epidemiol Biomarkers Prev. 2000;9:911–915. [PubMed] [Google Scholar]
- 9.Chow CK, Venzon D, Jones EC, et al. Effect of tamoxifen on mammographic density. Cancer Epidemiol Biomarkers Prev. 2000;9:917–921. [PubMed] [Google Scholar]
- 10.Magnusson C, Baron J, Persson I, et al. Body size in different periods of life and breast cancer risk in post-menopausal women. Int J Cancer. 1998;76:29–34. doi: 10.1002/(sici)1097-0215(19980330)76:1<29::aid-ijc6>3.0.co;2-#. [DOI] [PubMed] [Google Scholar]
- 11.Magnusson C, Baron JA, Correia N, et al. Breast-cancer risk following long-term oestrogen- and oestrogen-progestin-replacement therapy. Int J Cancer. 1999;81:339–344. doi: 10.1002/(sici)1097-0215(19990505)81:3<339::aid-ijc5>3.0.co;2-6. [DOI] [PubMed] [Google Scholar]
- 12.Magnusson CM, Persson IR, Baron JA, et al. The role of reproductive factors and use of oral contraceptives in the aetiology of breast cancer in women aged 50 to 74 years. Int J Cancer. 1999;80:231–236. doi: 10.1002/(sici)1097-0215(19990118)80:2<231::aid-ijc11>3.0.co;2-r. [DOI] [PubMed] [Google Scholar]
- 13.Rosenberg LU, Granath F, Dickman PW, et al. Menopausal hormone therapy in relation to breast cancer characteristics and prognosis: A cohort study. Breast Cancer Res. 2008;10:R78. doi: 10.1186/bcr2145. [DOI] [PMC free article] [PubMed] [Google Scholar]
- 14.Rosenberg LU, Einarsdóttir K, Friman EI, et al. Risk factors for hormone receptor-defined breast cancer in postmenopausal women. Cancer Epidemiol Biomarkers Prev. 2006;15:2482–2488. doi: 10.1158/1055-9965.EPI-06-0489. [DOI] [PubMed] [Google Scholar]
- 15.Nyström L, Larsson LG, Rutqvist LE, et al. Determination of cause of death among breast cancer cases in the Swedish randomized mammography screening trials: A comparison between official statistics and validation by an endpoint committee. Acta Oncol. 1995;34:145–152. doi: 10.3109/02841869509093948. [DOI] [PubMed] [Google Scholar]
- 16.Tamimi RM, Eriksson L, Lagiou P, et al. Birth weight and mammographic density among postmenopausal women in Sweden. Int J Cancer. 2010;126:985–991. doi: 10.1002/ijc.24786. [DOI] [PubMed] [Google Scholar]
- 17.Li J, Szekely L, Eriksson L, et al. High-throughput mammographic density measurement: A tool for risk prediction of breast cancer. Breast Cancer Res. 2012;14:R114. doi: 10.1186/bcr3238. [DOI] [PMC free article] [PubMed] [Google Scholar]
- 18.Ludvigsson JF, Otterblad-Olausson P, Pettersson BU, et al. The Swedish personal identity number: Possibilities and pitfalls in healthcare and medical research. Eur J Epidemiol. 2009;24:659–667. doi: 10.1007/s10654-009-9350-y. [DOI] [PMC free article] [PubMed] [Google Scholar]
- 19.Byng JW, Boyd NF, Fishell E, et al. The quantitative analysis of mammographic densities. Phys Med Biol. 1994;39:1629–1638. doi: 10.1088/0031-9155/39/10/008. [DOI] [PubMed] [Google Scholar]
- 20.R Development Core Team: Vienna, Austria: R Foundation for Statistical Computing; 2011. R: A Language and Environment for Statistical Computing. [Google Scholar]
- 21.Fox J, Carvalho MS. The RcmdrPlugin.survival package: Extending the R commander interface to survival analysis (R package version 1.0-1) J Stat Software. 2012;49:1–32. [Google Scholar]
- 22.Osborne CK. Tamoxifen in the treatment of breast cancer. N Engl J Med. 1998;339:1609–1618. doi: 10.1056/NEJM199811263392207. [DOI] [PubMed] [Google Scholar]
- 23.Colzani E, Liljegren A, Johansson AL, et al. Prognosis of patients with breast cancer: Causes of death and effects of time since diagnosis, age, and tumor characteristics. J Clin Oncol. 2011;29:4014–4021. doi: 10.1200/JCO.2010.32.6462. [DOI] [PubMed] [Google Scholar]
- 24.American Cancer Society: Atlanta, GA: American Cancer Society; 2011. Cancer Facts & Figures for African Americans 2011-2012. [Google Scholar]
- 25.Owusu C, Buist DS, Field TS, et al. Predictors of tamoxifen discontinuation among older women with estrogen receptor-positive breast cancer. J Clin Oncol. 2008;26:549–555. doi: 10.1200/JCO.2006.10.1022. [DOI] [PubMed] [Google Scholar]
- 26.Schroth W, Goetz MP, Hamann U, et al. Association between CYP2D6 polymorphisms and outcomes among women with early stage breast cancer treated with tamoxifen. JAMA. 2009;302:1429–1436. doi: 10.1001/jama.2009.1420. [DOI] [PMC free article] [PubMed] [Google Scholar]
- 27.Maskarinec G, Nagata C, Shimizu H, et al. Comparison of mammographic densities and their determinants in women from Japan and Hawaii. Int J Cancer. 2002;102:29–33. doi: 10.1002/ijc.10673. [DOI] [PubMed] [Google Scholar]
- 28.Haars G, van Noord PA, van Gils CH, et al. Measurements of breast density: No ratio for a ratio. Cancer Epidemiol Biomarkers Prev. 2005;14:2634–2640. doi: 10.1158/1055-9965.EPI-05-0824. [DOI] [PubMed] [Google Scholar]
- 29.Son HJ, Oh KK. Significance of follow-up mammography in estimating the effect of tamoxifen in breast cancer patients who have undergone surgery. AJR Am J Roentgenol. 1999;173:905–909. doi: 10.2214/ajr.173.4.10511146. [DOI] [PubMed] [Google Scholar]
- 30.Ursin G, Ma H, Wu AH, et al. Mammographic density and breast cancer in three ethnic groups. Cancer Epidemiol Biomarkers Prev. 2003;12:332–338. [PubMed] [Google Scholar]
Associated Data
This section collects any data citations, data availability statements, or supplementary materials included in this article.