Abstract.
Antibody fragments including diabodies have more desirable pharmacokinetic characteristics than whole antibodies. An activatable optical imaging probe based on a cys-diabody targeting prostate-specific membrane antigen conjugated with the near-infrared fluorophore, indocyanine green (ICG), was designed such that it can only be activated when bound to the tumor, leading to high signal-to-background ratios. We employed short polyethylene glycol (PEG) linkers between the ICG and the reactive functional group (Sulfo-OSu group), resulting in covalent conjugation of ICG to the cys-diabody, which led to lower dissociation of ICG from cys-diabody early after injection, reducing hepatic uptake. However, unexpectedly, high and long-term fluorescence was observed in the kidneys, liver, and blood pool more than 1 h after injection of the cys-diabody PEG-ICG conjugate. A biodistribution study using -labeled cys-diabody-ICG showed immediate uptake in the kidneys followed by a rapid decrease, while gastric activity increased due to released radioiodine during rapid cys-diabody-ICG catabolism in the kidneys. To avoid this catabolic pathway, it would be preferable to use antibody fragments large enough not to be filtered through glomerulus or to conjugate the fragments with fluorescent dyes that are readily excreted into urine when cleaved from the cys-diabody to achieve high tumor-specific detection.
Keywords: optical probe, activatable imaging, diabody, indocyanine green, polyethylene glycol linker, catabolism
1. Introduction
Monoclonal antibodies (mAbs) have been used for targeted therapy and imaging because of their high affinity for a diverse number of antigens overexpressed on cancer cells.1,2 Molecular imaging based on mAbs labeled with radioisotopes can not only localize tumor within the whole body but also characterize it for drug targeting.3,4. However, the prolonged clearance time of whole mAbs reduces the target-to-background ratio, lowering sensitivity and specificity of labeled mAbs.5 To overcome this problem, mAbs have been subjected to enzymatic cleavage or have been genetically modified to create fragments of various sizes, including variable region fragments (Fvs), diabody, fragments, antigen binding (Fabs), minibody, F(ab)’2 fragment, and -deleted mAb.6,7 If these fragments are too small, their renal clearance will be too rapid, compromising tumor uptake. Additionally, monovalent Fabs have lower binding affinities. Therefore, intermediate-size Fabs with mild prolongation of clearance but with bivalent binding to antigen, such as diabodies (50 to 60 kDa) or minibodies (75 to 80 kDa), would seem more likely to provide the highest tumor-to-background ratios.7
Activatable imaging probes upon binding to the target are produced based on a relatively new concept that minimizes background signal, resulting in an increase in the tumor-to-background ratio. These activatable optical imaging probes using mAbs can be activated only when bound to a cell surface receptor followed by internalization.8–10. Whole immunoglobulin G (IgG)-based activatable probes with a long biological half-life have shown excellent target-specific tumor detection with minimal background signals.11–13 In this study, we hypothesize that optimal pharmacokinetics of a cys-diabody combined with activatable labeling could improve the specific detection of cancer. Therefore, we have synthesized anti-prostate-specific membrane antigen (PSMA) cys-diabody activatably labeled with indocyanine green (ICG) derivatives14 and tested them in PSMA-expressing tumor-bearing mice.
2. Materials and Methods
2.1. Reagents
Anti-PSMA-Cys-diabody (PSMA-Cys-Db) was kindly supplied by ImaginAb Inc. (Inglewood, California). J591, a humanized PSMA-specific monoclonal antibody, was developed at Weill Cornell Medical College (New York, New York) by Bander N. H. ICG-Sulfo-OSu, ICG-PEG4-Sulfo-OSu, and ICG-PEG8-Sulfo-OSu were supplied by Dojindo Molecular Technologies (Gaithersburg, Maryland) and IR700 DX NHS ester (IR700) was purchased from LI-COR Biosciences (Lincoln, Nebraska). All other chemicals used were of reagent grade.
2.2. Synthesis of ICG Derivatives and IR700 Conjugated PSMA-Cys-Db
PSMA-Cys-Db (0.4 mg, 8.0 nmol) was incubated with ICG-Sulfo-OSu (74.4 μg, 80.0 nmol), ICG-PEG4-Sulfo-OSu (47.1 μg, 40 nmol), ICG-PEG8-Sulfo-OSu (108.3 μg, 80.0 nmol), or IR700-NHS ester (78.2 μg, 40 nmol) in 0.1 M (pH 8.6) at room temperature for 1 h, followed by purification with a size exclusion column (PD-10; GE Healthcare, Piscataway, New Jersey). The concentrations of ICG and IR700 were calculated by measuring the absorption with a UV-Vis system (8453 Value UV-Vis system; Agilent Technologies, Santa Clara, California) to confirm the number of fluorophore molecules conjugated to each antibody molecule. The protein concentration was also determined by measuring the absorption at 280 nm with a UV-Vis system. The number of ICG and IR700 per antibody was adjusted to 0.5 to 0.8 for each probe. We performed sodium dodecyl sulfate polyacrylamide gel electrophoresis (SDS-PAGE) as a quality control for each conjugate according to a previous report.14 As a comparison, anti-human PSMA mAb (J591) conjugated with ICG was also synthesized as reported previously.12
2.3. Determination of Quenching Capacity In Vitro
The quenching capacity of each conjugate was investigated by denaturation with 1% SDS as described previously.14 Briefly, the conjugates were incubated with 1% SDS in phosphate-buffered saline (PBS) for 15 min at room temperature. As a control, the samples were incubated in PBS. The change in fluorescence signal intensity of IR700 and ICG was investigated with an in vivo imaging system (Maestro, CRi Inc., Woburn, Massachusetts). The red filter set for IR700 uses a bandpass filter, which ranges between 615 and 665 nm (excitation), and a long-pass filter over 700 nm (emission); the near-infrared filter set for ICG uses a bandpass filter from 710 to 760 nm (excitation) and a long-pass filter over 800 nm (emission). Regions of interest (ROIs) were placed on ICG spectrum images with reference to white light images to measure fluorescence intensities of solutions. The Maestro software was used for calculating ROI signal data.
2.4. Stability in Mouse Serum
Each probe [5 to 6 μg in PBS (40 μL)] was incubated in mouse serum (40 μL) for 0, 0.5, and 1 h at 37°C, followed by imaging with a Maestro in vivo imaging system. 1% SDS was added to each probe to dequench. Fluorescence recovery in mouse serum was calculated by the following equation: (Fluorescence signal in mouse serum—Fluorescence signal in PBS)/(Fluorescence signal in SDS—Fluorescence signal in PBS) .
2.5. Cell Culture
A PSMA transfected PC3 cell line PC3-PSMA+(PC3pip) and a control blank-vector transfected PC3 cell line PC3-PSMA−(PC3flu) were used for PSMA targeting studies with ICG derivatives conjugated PSMA-Cys-Db. Both cell lines were established at the Cleveland Clinic Foundation. All cell lines were grown in RPMI 1640 medium (Life Technologies, Gaithersburg, Maryland) containing 10% fetal bovine serum (Life Technologies) and 1% Pen-Strep (Biofluids, Camarillo, California). All cell cultures were maintained in 5% carbon dioxide at 37°C in a humidified incubator.
2.6. Fluorescence Microscopy Studies
PC3-PSMA+ or PC3-PSMA− cells () were plated on a covered glass-bottomed culture well and incubated for 16 h. PSMA-Cys-Db-ICG, PSMA-Cys-Db-PEG4-ICG, and PSMA-Cys-Db-PEG8-ICG () were then added to cells and incubated for either 1 or 8 h, followed by washing once with PBS, and fluorescence microscopy was performed using an Olympus BX81 microscope (Olympus America Inc., Melville, New York) equipped with the following filters: excitation wavelength 672.5 to 747.5 nm, emission wavelength 765 to 855 nm for ICG. Transmitted light differential interference contrast images were also acquired.
2.7. Tumor Model
All in vivo procedures were conducted in compliance with the Guide for the Care and Use of Laboratory Animal Resources (1996), U.S. National Research Council, and approved by the local Animal Care and Use Committee. Six-to-eight-week-old female homozygous athymic nude mice were purchased from Charles River (NCI-Frederick, Frederick, Maryland). During the procedure, mice were anesthetized with isoflurane. PC3-flu cells () were injected subcutaneously into the left dorsum of each mouse, and three days later (because they grow faster), PC3-pip cells () were injected into the right dorsum of the same mouse. Mice were imaged when tumors grew to about 7 to 8 mm, as reported previously.12
2.8. In Vivo Imaging Studies
Each probe (PSMA-Cys-Db-ICG, PSMA-Cys-Db-PEG4-ICG, PSMA-Cys-Db-PEG8-ICG, PSMA-Cys-Db-IR700, and J591-ICG) ( in PBS/mouse) was administered via tail vein into tumor-bearing mice (PC3-PSMA+ and PC3-PSMA−). The mice were anesthetized with isoflurane, and fluorescence imaging data were obtained at 24 h with a Pearl Imager (LI-COR) using the 700 and 800 nm fluorescence channel for IR700 and ICG, respectively. ROIs were placed on ICG spectrum images with reference to white light images to measure fluorescence intensities of PC3-PSMA+, PC3-PSMA− tumor, and liver at every time point up to 24 h. The software Pearl Cam (LI-COR Biosciences) was used for calculating ROI signal data of each point. After acquisition of images at 24 h, mice were sacrificed with carbon dioxide. Ex vivo images of resected tumors, liver, and kidneys were obtained.
2.9. Biodistribution Study
PC3-pip (PSMA+) and PC3-flu (PSMA−) bearing mice were divided into two groups ( to 4) with approximately equal distributions of tumor sizes on the day of study. -PSMA-Cys-Db-ICG was prepared using the Iodo-Gen procedure and purified with a PD-10 size exclusion column. -PSMA-Cys-Db was also prepared as control to confirm the alteration of biodistribution of PSMA-Cys-Db after conjugation with ICG. The specific activities of the radiolabeled Dbs were for PSMA-Cys-Db and for PSMA-Cys-Db-ICG. -PSMA-Cys-Db or -PSMA-Cys-Db-ICG ( in PBS/mouse) was injected via tail vein, and the biodistribution was determined at 1, 6, and 24 h postinjection. Organs of interest were excised, weighed, and the radioactivity counts were determined with an NaI well-type scintillation counter (ARC-370M, Aloka, Tokyo, Japan), using the injected dose as a standard. Data were calculated as the percentage injected dose per gram of tissue (%ID/g).
2.10. Statistical Analysis
Quantitative data were expressed as Means were compared using two-way repeated measures analysis of variance with the Bonferroni correction of multiple comparisons. value of was considered statistically significant.
3. Results
3.1. Characterization of PSMA-Cys-Db Modified with ICG Derivatives
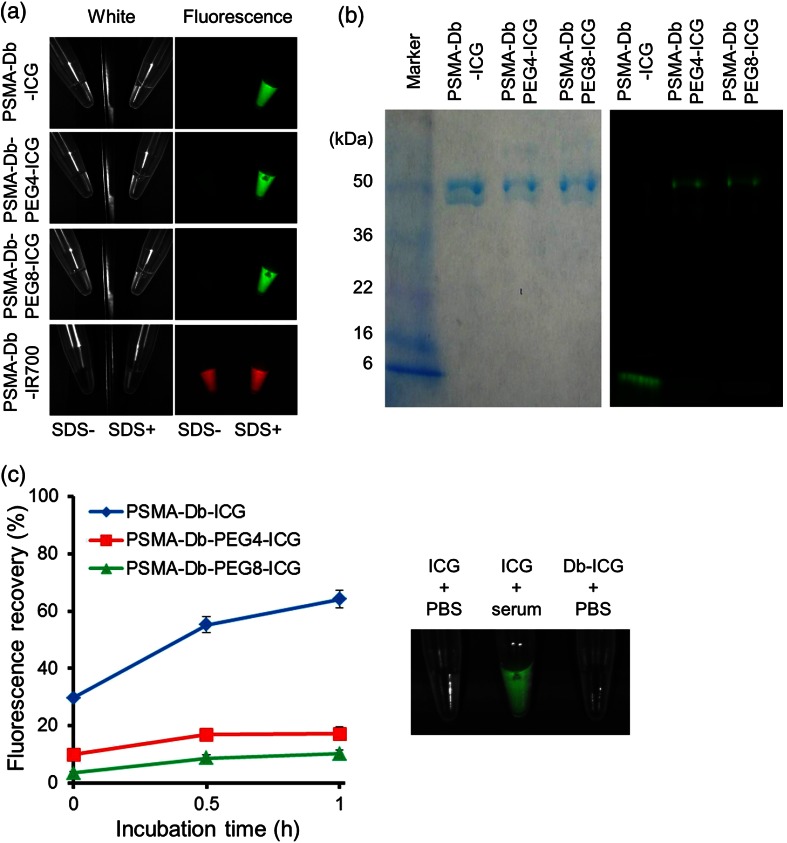
By adding 1% SDS to dye-conjugated antibodies, the following dequenching capacities were observed: 37.4-, 10.5-, 16.7-, and 2.5-fold for PSMA-Cys-Db-ICG, PSMA-Cys-Db-PEG4-ICG, PSMA-Cys-Db-PEG8-ICG, and PSMA-Cys-Db-IR700, respectively [Fig. 1(a)]. As defined by SDS-PAGE, the fractions of covalently bound ICG to PSMA-Cys-Db were 4.1, 72.1, and 79.3% for PSMA-Cys-Db-ICG, PSMA-Cys-Db-PEG4-ICG, and PSMA-Cys-Db-PEG8-ICG, respectively [Fig. 1(b)]. Furthermore, PSMA-Cys-Db-ICG showed a 64.1% increase in fluorescence intensity 1 h after incubation in mouse serum [Fig. 1(c)], suggesting significantly lower in vivo stability, compared with PSMA-Cys-Db-PEG4-ICG and PSMA-Cys-Db-PEG8-ICG (17.1% and 10.2%, respectively). The fluorescence of free ICG was dequenched in mouse serum.
Fig. 1.
(a) Quenched (left) and chemically dequenched (right) PSMA-Cys-Db-ICG, PSMA-Cys-Db-PEG4-ICG, PSMA-Cys-Db-PEG8-ICG, and PSMA-Cys-Db-IR700. (b) Validation of the covalent conjugation of ICG to antibody by SDS-PAGE (left: colloidal blue staining, right: fluorescence). (c) Stability of probes in mouse serum. Fluorescence recovery was calculated by the following equation: (Fluorescence signal in mouse serum − Fluorescence signal in PBS)/(Fluorescence signal in SDS/PBS–Fluorescence signal in PBS) . Data are presented as The fluorescence of free ICG can be dequenched in mouse serum.
3.2. Fluorescence Microscopy Studies
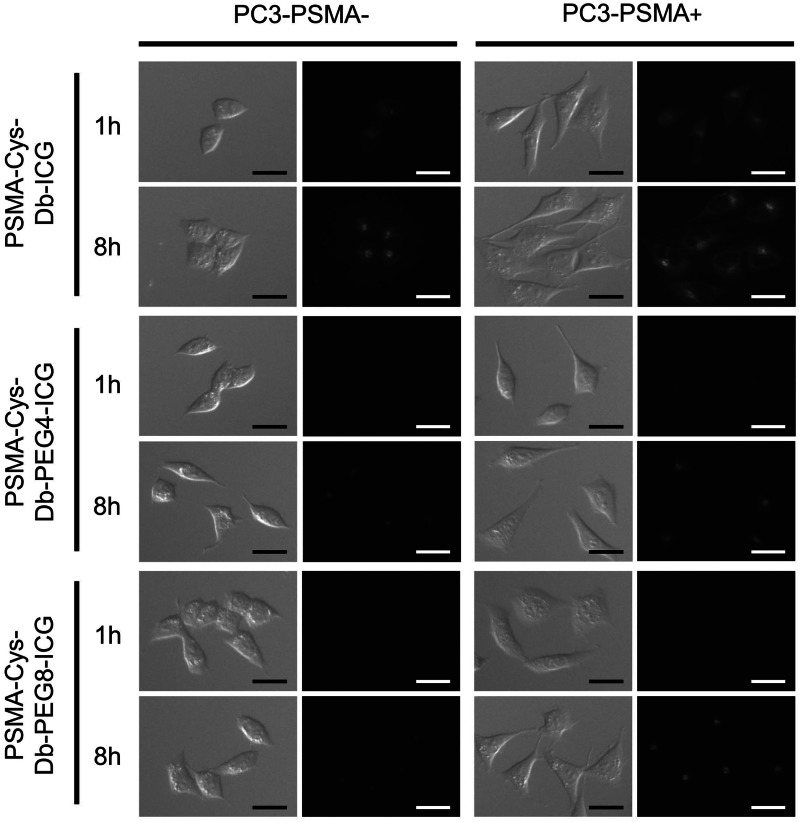
Microscopy studies (Fig. 2) using PSMA-Cys-Db-ICG showed intense fluorescence signal within the PC3-PSMA+ and PC3-PSMA− cells 1 and 8 h after incubation regardless of the high dequenching capacity of PSMA-Cys-Db-ICG. On the other hand, PSMA-Cys-Db-PEG4-ICG and PSMA-Cys-Db-PEG8-ICG showed minimal signal 1 h after incubation in both cells and significantly higher signal in PC3-PSMA+ cells than in PC3-PSMA− cells 8 h after incubation.
Fig. 2.
PC3-PSMA+ and PC3-PSMA− cells were incubated with PSMA-Cys-Db-ICG, PSMA-Cys-Db-PEG4-ICG, and PSMA-Cys-Db-PEG8-ICG for 1 or 8 h. Although high nonspecific signal was observed in PC3-PSMA− cells when PSMA-Cys-Db-ICG was used, PSMA-Cys-Db-PEG4-ICG and PSMA-Cys-Db-PEG8-ICG demonstrated the specific uptake by PSMA positive cells. Scale .
3.3. In Vivo Imaging Studies Targeting for PSMA
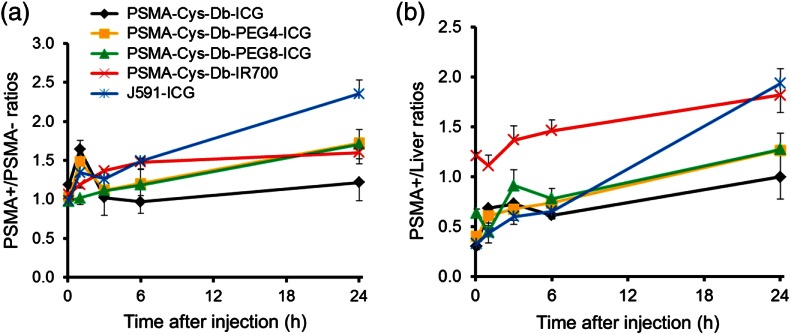
Figures 3 and 4 show the imaging and quantitative assessment of tumor-bearing mice (PC3-PSMA+ and PC3-PSMA−) administered with PSMA-Cys-Db-ICG, PSMA-Cys-Db-PEG4-ICG, PSMA-Cys-Db-PEG8-ICG, PSMA-Cys-Db-IR700, and J591-ICG using the 700 and 800 nm fluorescence channel of the fluorescence camera for IR700 and ICG, respectively. Covalent conjugation of ICG with short PEG linkers successfully reduced the nonspecific uptake in the liver at early time intervals after injection unlike PSMA-Cys-Db labeled with the original ICG-Sulfo-OSu, which had high liver uptake. However, unexpectedly, there was prolonged high background activity especially in the kidneys, liver, and circulation at 1, 3, and 6 h postinjection with PEG linkers. This resulted in low fluorescence ratios (1.0 to 1.7) of PSMA+ to PSMA− cells for PSMA-Cys-Db-ICG, PSMA-Cys-Db-PEG4-ICG, and PSMA-Cys-Db-PEG8-ICG, although there was a slight improvement in target-to-background ratios after introduction of short PEG linkers to ICG. On the other hand, PSMA-Cys-Db-IR700 (always-on probe) mainly accumulated in the kidneys, but there was low uptake in the liver, which was similar to the biodistribution of intact Cys-Db reported previously.15 The fluorescence ratios of PSMA+ to PSMA− tumors were increased on PSMA-Cys-Db-IR700 and improved over time. As a comparison, J591-ICG selectively accumulated in PC3-PSMA+ tumors within 24 h with low background signal, except in the liver and bowel. The fluorescence intensity in PC3-PSMA+ tumors was maintained on day 3, as reported previously12 (data not shown).
Fig. 3.
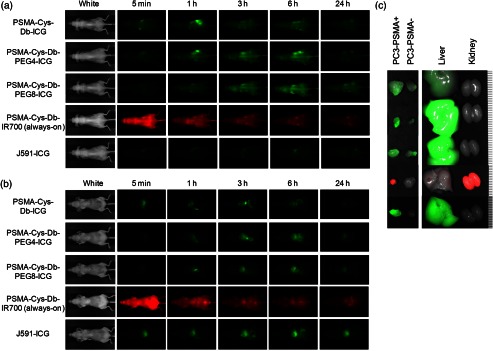
(a) In vivo serial fluorescence images of PC3-PSMA+ (right dorsum) and PC3-PSMA− tumor (left dorsum) bearing mice injected with PSMA-Cys-Db-ICG, PSMA-Cys-Db-PEG4-ICG, PSMA-Cys-Db-PEG8-ICG, PSMA-Cys-Db-IR700, and J591-ICG. (b) Abdominal side of in vivo fluorescence images. (c) Ex vivo fluorescence images of PC3-PSMA+, PC3-PSMA−, liver, and kidneys obtained 24 h (72 h for J591-ICG) after injection of probes. Smallest scale bar indicates 1 mm.
Fig. 4.
(a) PSMA+ tumor-to-PSMA and (b) tumor-to-liver signal intensity ratios. PEGylation of ICG could improve the PSMA+ tumor to PSMA− tumor ratios, which was comparable to nonactivatable always-on PSMA-Cys-Db-IR700. J591-ICG achieved the highest target tumor-to-background ratios among five probes. Data are represented as .
3.4. Biodistribution of PSMA-Cys-Db and PSMA-Cys-Db-ICG
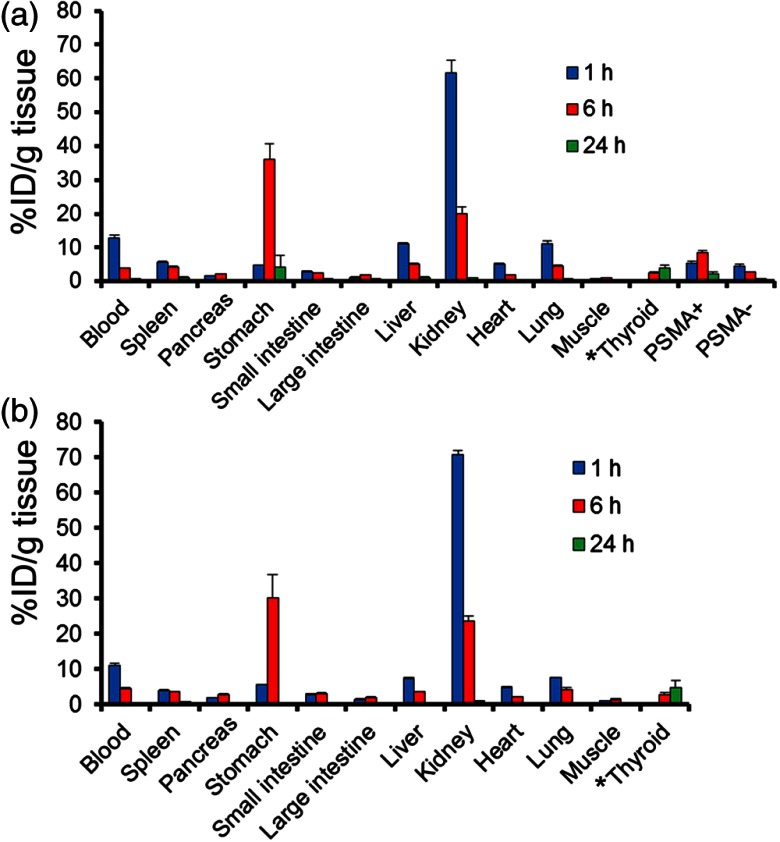
Results of in vivo biodistribution studies of -PSMA-Cys-Db and -PSMA-Cys-Db-ICG are summarized in Fig. 5. -PSMA-Cys-Db-ICG showed a biodistribution similar to -PSMA-Cys-Db. -PSMA-Cys-Db-ICG was rapidly taken up by the kidneys within 1 h postinjection and showed a fast blood clearance and significantly higher accumulation in PSMA positive tumors than in PSMA negative tumors at 6 and 24 h after probe administration. Notably, the radioactivity observed in the kidneys was sharply reduced within 6 h, while that in the stomach was dramatically increased. These results suggest that the cys-diabody is dehalogenated and possibly catabolized in the kidneys, and the fragment of cys-diabody including the iodine ion can be slowly released into the circulation followed by gradual uptake in the stomach and thyroid.
Fig. 5.
In vivo biodistribution of radioactivity at 1, 6, and 24 h after injection of -PSMA-Cys-Db (a) and -PSMA-Cys-Db-ICG (b) into mice bearing PC3-PSMA+ and PC3-PSMA− tumors, expressed as % injected dose/g of tissue. Data are represented as to 4. * % injected dose for thyroid.
4. Discussion
The optimization of pharmacokinetics and stability of activatable optical probes is important for successful implementation. We have shown that ICG with short PEG linkers can be covalently conjugated to IgG with superior efficacy compared with ICG-Sulfo-OSu without a PEG linker.14 When ICG-Sulfo-OSu was conjugated directly without a PEG linker, there was less covalent binding, resulting in higher liver uptake. By inserting PEG linkers, the activation capacity was slightly reduced due to decreasing quenching efficacy probably because of increased distances between ICG and aromatic residues on mAb molecules.11,14 However, an activation capacity of at least 10-fold was retained for both PSMA-Cys-Db-PEG4-ICG and PSMA-Cys-Db-PEG8-ICG.
In in vivo fluorescence imaging studies, PSMA-Cys-Db covalently conjugated with ICG with short PEG linkers showed little nonspecific uptake in the liver immediately (5 min) after injection compared with PSMA-Cys-Db conjugated with ICG-Sulfo-OSu. However, an unanticipated increase in background signal was observed especially in the kidneys, liver, and circulation from 1 h to 1 day after administration. The biodistribution study using -labeled PSMA-Cys-Db and PSMA-Cys-Db-ICG were similar with relatively rapid clearance through the kidneys that is consistent with previous reports. The biodistribution study suggested rapid renal catabolism and deiodination of probes followed by intense accumulation of free radioiodine in the stomach by 6 h after injection. Cys-diabody fragments particularly were subjected to filtration through glomerulus, reabsorption by the proximal convoluted tubule (PCT), and dehalogenated upon internalization in the PCT cells according to the previous reports.16,17 ICG could be expected to undergo similar catabolism, albeit with a slower release than free iodine. ICG would be released after catabolism of the conjugate within the lysosome. Released ICG would bind to plasma proteins, resulting in increased fluorescence as shown in Fig. 1(c), would then circulate in the blood bound to protein, and would then gradually accumulate into the liver and finally be excreted via the hepatobiliary system as nonconjugate ICG does. Therefore, these fluorescently activated catabolites of ICG, which are formed within a day after injection, persistently increase the background signal in fluorescent images.
PSMA-Cys-Db-IR700 (always-on probe) immediately accumulated in the kidneys by glomerular filtration after injection and then was reabsorbed by PCT similar to radiolabeled diabodies. The difference in the pathway after metabolism in the kidneys between PSMA-Cys-Db-ICG and PSMA-Cys-Db-IR700 might be attributed to the difference in the chemical characteristics of fluorophores. After degradation and release into the circulation, ICG can bind to plasma protein and be excreted into the bile through the liver, whereas IR700 is rapidly excreted into the urine.18 Therefore, although PSMA-Cys-Db-IR700 is an always-on probe, background activity of IR700 decreases more rapidly than that of ICG. ICG has been approved for human use for 50 years with a good safety profile and is a practical fluorophore for clinical application. However, when conjugated with small proteins such as diabodies, which are catabolized in the kidneys, fluorescently activated ICG and derivatives can be recirculated and excreted through the liver, leading to a prolonged increased background in abdomen on fluorescence images. Therefore, J591(whole IgG)-ICG is apparently a better activatable probe for the PSMA-specific cancer detection than diabody-ICG probes.
In conclusion, optimal design of activatable optical probes should consider the excretion pathway of fluorescent catabolites. A large proportion of such agents can be catabolized in the kidney and, therefore, not reach the target in large amounts. From this point of view, activatable labeling of imaging probes with ICG is better for somewhat larger proteins such as IgG, F(ab)’2, and minibody, which are not filtered through the glomerulus, however, it is relatively inferior for small proteins including cys-diabody, Fab, and Fv fragments, which are filtered rapidly through the glomerulus. When small proteins are used as targeting moieties, we might have to consider more hydrophilic and, therefore, more readily urinary excretable fluorophores such as IR700 for activatable labeling.
Acknowledgments
This research was supported by the Intramural Research Program of the National Institutes of Health, National Cancer Institute, Center for Cancer Research. This project has been funded in part with federal funds from the National Cancer Institute, National Institutes of Health, under Contract No. HHSN261200800001E. The content of this publication does not necessarily reflect the views or policies of the Department of Health and Human Services, nor does mention of trade names, commercial products, or organizations imply endorsement by the U.S. Government.
References
- 1.Waldmann T. A., “Immunotherapy: past, present and future,” Nat. Med. 9(3), 269–277 (2003). 10.1038/nm0303-269 [DOI] [PubMed] [Google Scholar]
- 2.Reichert J. M., et al. , “Monoclonal antibody successes in the clinic,” Nat. Biotechnol. 23(9), 1073–1078 (2005). 10.1038/nbt0905-1073 [DOI] [PubMed] [Google Scholar]
- 3.Wu A. M., “Antibodies and antimatter: the resurgence of immuno-PET,” J. Nucl. Med. 50(1), 2–5 (2009). 10.2967/jnumed.108.056887 [DOI] [PubMed] [Google Scholar]
- 4.Boswell C. A., Brechbiel M. W., “Development of radioimmunotherapeutic and diagnostic antibodies: an inside-out view,” Nucl. Med. Biol. 34(7), 757–778 (2007). 10.1016/j.nucmedbio.2007.04.001 [DOI] [PMC free article] [PubMed] [Google Scholar]
- 5.Wu A. M., Olafsen T., “Antibodies for molecular imaging of cancer,” Cancer J. 14(3), 191–197 (2008). 10.1097/PPO.0b013e31817b07ae [DOI] [PubMed] [Google Scholar]
- 6.Colcher D., et al. , “Pharmacokinetics and biodistribution of genetically-engineered antibodies,” Q. J. Nucl. Med. 42(4), 225–241 (1998). 10.1016/S0958-1669(02)00352-X [DOI] [PubMed] [Google Scholar]
- 7.Wu A. M., Senter P. D., “Arming antibodies: prospects and challenges for immunoconjugates,” Nat. Biotechnol. 23(9), 1137–1146 (2005). 10.1038/nbt1141 [DOI] [PubMed] [Google Scholar]
- 8.Kobayashi H., et al. , “New strategies for fluorescent probe design in medical diagnostic imaging,” Chem. Rev. 110(5), 2620–2640 (2010). 10.1021/cr900263j [DOI] [PMC free article] [PubMed] [Google Scholar]
- 9.Kobayashi H., et al. , “Rational chemical design of the next generation of molecular imaging probes based on physics and biology: mixing modalities, colors and signals,” Chem. Soc. Rev. 40(9), 4626–4648 (2011). 10.1039/c1cs15077d [DOI] [PMC free article] [PubMed] [Google Scholar]
- 10.Kobayashi H., Choyke P. L., “Target-cancer-cell-specific activatable fluorescence imaging probes: rational design and in vivo applications,” Acc. Chem. Res. 44(2), 83–90 (2011). 10.1021/ar1000633 [DOI] [PMC free article] [PubMed] [Google Scholar]
- 11.Ogawa M., et al. , “In vivo molecular imaging of cancer with a quenching near-infrared fluorescent probe using conjugates of monoclonal antibodies and indocyanine green,” Cancer Res. 69(4), 1268–1272 (2009). 10.1158/0008-5472.CAN-08-3116 [DOI] [PMC free article] [PubMed] [Google Scholar]
- 12.Nakajima T., et al. , “Targeted, activatable, in vivo fluorescence imaging of prostate-specific membrane antigen (PSMA) positive tumors using the quenched humanized J591 antibody-indocyanine green (ICG) conjugate,” Bioconjug. Chem. 22(8), 1700–1705 (2011). 10.1021/bc2002715 [DOI] [PMC free article] [PubMed] [Google Scholar]
- 13.Sano K., et al. , “In vivo breast cancer characterization imaging using two monoclonal antibodies activatably labeled with near infrared fluorophores,” Breast Cancer Res. 14(2), R61 (2012). 10.1186/bcr3167 [DOI] [PMC free article] [PubMed] [Google Scholar]
- 14.Sano K., et al. , “Short PEG-linkers improve the performance of targeted, activatable monoclonal antibody-indocyanine green optical imaging probes,” Bioconjug. Chem. 24(5), 811–816 (2013). 10.1021/bc400050k [DOI] [PMC free article] [PubMed] [Google Scholar]
- 15.Li L., et al. , “Reduction of kidney uptake in radiometal labeled peptide linkers conjugated to recombinant antibody fragments. Site-specific conjugation of DOTA-peptides to a Cys-diabody,” Bioconjug. Chem. 13(5), 985–995 (2002). 10.1021/bc025565u [DOI] [PubMed] [Google Scholar]
- 16.Rogers B. E., et al. , “Identification of metabolites of 111In-diethylenetriaminepentaacetic acid-monoclonal antibodies and antibody fragments in vivo,” Cancer Res. 55(23 Suppl), 5714s–5720s (1995). [PubMed] [Google Scholar]
- 17.Wu C., et al. , “Biodistribution and catabolism of Ga-67-labeled anti-Tac dsFv fragment,” Bioconjug. Chem. 8(3), 365–369 (1997). 10.1021/bc970032k [DOI] [PubMed] [Google Scholar]
- 18.Mitsunaga M., et al. , “Cancer cell-selective in vivo near infrared photoimmunotherapy targeting specific membrane molecules,” Nat. Med. 17(12), 1685–1691 (2011). 10.1038/nm.2554 [DOI] [PMC free article] [PubMed] [Google Scholar]


