

Abstract
Light is the most important environmental signal that entrains the circadian clock located in the hypothalamic suprachiasmatic nucleus (SCN). The retinohypothalamic tract (RHT) was stimulated to simulate the light intensity-dependent discharges of intrinsically photosensitive retinal ganglion cells projecting axons to the hypothalamus. EPSCs were evoked by paired-pulse stimulation or by application of stimulus trains, and recorded from SCN neurons in rat brain slices. Initial release probability (Pr) and synaptic plasticity changes depended on the strength of GABAB receptor (GABABR)-mediated presynaptic inhibition and could be different at the same GABABR agonist concentration. Facilitation caused by frequency-dependent relief of GABABR-mediated inhibition was observed when the initial Pr was decreased to less than 15% of control during strong activation of presynaptic GABAB receptors by (±)baclofen (10 μm), GABA (≥2 mm) or by GABA uptake inhibitor nipecotic acid (≥5 mm). In contrast, short-term synaptic depression appeared during baclofen (10 μm) application when initial Pr was greater than 30% of control. Block of 4-aminopyridine-sensitive K+ currents increased the amplitude and time constant of decay of evoked EPSCs (eEPSCs), and decreased the GABABR-mediated presynaptic inhibition. The GABAB receptor antagonist CGP55845 (3 μm) increased the eEPSCs amplitude 30% throughout the light−dark cycle. During light and dark phases the RHT inputs to 55% and 33% of recorded neurons, respectively, were under GABAB inhibitory control indicating that the tonic inhibition induced by local changes of endogenous GABA concentration contributes to the circadian variation of RHT transmitter release. We conclude that GABABR-mediated presynaptic inhibition decreased with increasing frequency and broadening of presynaptic action potentials, and depended on the sensitivity of RHT terminals to GABABR agonists, and diurnal changes of the extracellular GABA concentration around RHT axon terminals in the SCN.
Key points
Light entrains the circadian clock by activating intrinsically photosensitive retinal ganglion cells projecting axons through the retinohypothalamic tract (RHT) to the hypothalamic suprachiasmatic nucleus (SCN).
Initial release probability and synaptic plasticity changes in RHT-SCN synapses depended on the strength of GABAB receptor (GABABR)-mediated presynaptic inhibition.
The RHT axon terminals are under the tonic inhibitory control of GABAB receptors. CGP55845 (3 μm) application increased the evoked excitatory postsynaptic current amplitude 30% throughout the light–dark cycle.
During the light and dark phases the RHT inputs to 55% and 33% of recorded neurons, respectively, were under GABAB inhibitory control indicating that the tonic GABA inhibition contributes to the circadian variation of transmitter release.
GABABR-mediated presynaptic inhibition depended on the sensitivity of RHT terminals to GABABR agonists and diurnal changes of the extracellular GABA concentration around RHT axon terminals in the SCN, and decreased with increasing frequency of RHT stimulation.
Introduction
The molecular circadian clock located in the hypothalamic suprachiasmatic nucleus (SCN) receives environmental light intensity information directly from the retina via the retinohypothalamic tract (RHT) and indirectly through a projection from the intergeniculate leaflet (Pickard et al. 1987). Light activates intrinsically photosensitive retinal ganglion cells (ipRGCs) whose axons project to the SCN through the RHT. ipRGCs fire action potentials, which induce glutamate release from RHT terminals for the duration of a light exposure with the frequency determined by the light intensity (Wong, 2012; Hu et al. 2013).
Light pulses applied in the early night or the late night, respectively, phase delay or phase advance the locomotor activity rhythms (Daan & Pittendrigh, 1976). This mechanism adjusts the circadian clock to seasonal changes of light duration. Light-induced phase shifts are strongly regulated by G protein-coupled presynaptic receptors (Ralph & Menaker, 1989; Gillespie et al. 1997, 1999; Pickard et al. 1999; Sollars et al. 2006). GABAB receptors (GABABRs) were unambiguously identified in retinal terminals (Belenky et al. 2008). Microinjection of the GABAB receptor (GABABR) agonist baclofen into the SCN of freely-moving animals reduced light-induced phase shifts and c-Fos immunoreactivity during the early and late subjective night (Ralph & Menaker, 1989; Gillespie et al. 1997, 1999; Novak et al. 2004). The phase shift reduction was thought to be due to the presynaptic inhibitory effect of baclofen on RHT synaptic transmission, though GABABRs located on GABAergic axonal terminals, and on the cell membrane of SCN neurons could also play a role (Jiang et al. 1995; Chen & Van den Pol, 1998). Baclofen activates presynaptic GABABRs and attenuates glutamate release by inhibiting voltage-dependent Ca2+ channels (VDCCs) located on RHT terminals (Jiang et al. 1995; Moldavan et al. 2006). During activation of G protein-coupled receptors Gβγ subunits directly inhibit VDCCs, shifting them from an easily activated ‘willing’ state to a more difficult to activate ‘reluctant’ state (Herlitze et al. 2001). G protein-mediated inhibition was relieved when the binding of the βγ subunits to VDCCs was reduced by strong prepulse cell membrane depolarization (Isaacson, 1998; Herlitze et al. 2001; Kajikawa et al. 2001), by broadening of action potential waveforms (Brody et al. 1997), or by high-frequency stimulation of presynaptic axons (Brenowitz et al. 1998; Brenowitz & Trussell, 2001). During high-frequency stimulation the relief of G protein-mediated inhibition was significantly stronger for P/Q-type compared to N-type VDCCs (Brody & Yue, 2000). These observations predict that G protein-mediated inhibition will predominate at low firing frequencies playing the role of a high-pass filter, in contrast to vesicle depletion, which is significant at high frequencies acting as a low-pass filter (Bertram, 2001; Fortune & Rose, 2001). The interplay between these two mechanisms controlling glutamate release from RHT terminals could be critical for the transmission of light entraining signals. The frequency-dependent relief of GABABR-mediated inhibition significantly enhances synaptic strength allowing transmission to persist at higher rates of synaptic activity, as occurred at the calyceal synapses (Brenowitz et al. 1998; Brenowitz & Trussell, 2001), in hippocampal neurons (Brody & Yue, 2000), and in the rat spinal cord (Lev-Tov & Pinco, 1992). As GABA is the most abundant neurotransmitter in the SCN it was important to study how endogenous GABA modulates RHT synaptic transmission and affects synaptic plasticity (Moore & Speh, 1993). Our goal was to examine the concentration and frequency dependence of synaptic plasticity at RHT synapses induced by activation of presynaptic GABABRs.
Our data indicate that short-term synaptic depression (STD) and GABABR-mediated presynaptic inhibition are distinct phenomena that cooperatively regulate RHT synaptic transmission and demonstrate an opposite frequency dependence. The magnitude of initial transmitter release as well as the strength of GABABR-mediated presynaptic inhibition defined the frequency-dependent changes in synaptic plasticity. Endogenous GABA inhibited more RHT terminals projecting on to SCN neurons during subjective day than at night. However, due to GABA uptake mechanisms the average value of GABABR-mediated tonic inhibition does not change during a diurnal cycle.
Methods
Animal entrainment and preparation of brain slices
The Institutional Animal Care and Use Committee of OHSU approved all experimental procedures involving animals and all efforts were made to minimize pain and the number of animals used. Male Sprague–Dawley rats (n= 61, 4–6 weeks old; Charles River Labs, Wilmington, MA, USA) were housed in an environmental chamber (Percival Scientific, Perry, IA, USA) maintained at 20–21°C on a 12:12 h light/dark (LD) cycle, with free access to food and water. Recordings were made during subjective day. Only the effect of endogenous GABA was studied during both the light and dark phases. For subjective day recordings lights-on was at 08.00 h; for night recordings lights-on was at 23.00 h. Zeitgeber time (ZT) was used to define light and dark phases during the LD cycle. By convention, ZT12 was defined as lights-off. During the light phase, rats were deeply anaesthetized with isoflurane (Hospira, Inc., Lake Forest, IL, USA), their brains removed and submerged in an ice-cold Krebs solution consisting of (in mm): NaCl 126, KCl 2.5, NaH2PO4 1.2, MgCl2 4.0, CaCl2 0.5, glucose 11, NaHCO3 26, saturated with 95% O2 and 5% CO2 (pH 7.3–7.4, 301–303 mosmol l−1). Coronal (250 μm thick) or horizontal (∼500 μm thick) brain slices containing the SCN were cut with a vibrating-blade microtome (Leica VT 1000 S, Leica Biosystems GmbH, Nussloch, Germany). The slices were maintained in a chamber at 30°C for 1.5–2 h before beginning the recordings.
Whole cell patch clamp recording
Recordings were made at 28°C using the whole cell patch clamp technique (Moldavan & Allen, 2010). The artificial cerebrospinal fluid (ACSF) used for the recordings consisted of (in mm): NaCl 132.5, KCl 2.5, NaH2PO4 1.2, CaCl2, 2.4, MgCl2 1.2, glucose 11, NaHCO3 22, saturated with 95% O2 and 5% CO2 (pH 7.3–7.4, 300–305 mosmol l−1). Microelectrodes with resistances of 7–9 MΩ were pulled from borosilicate glass capillaries (World Precision Instruments, Inc., Sarasota, FL, USA) and filled with a solution containing (in mm): CH3O3SCs 102, CsCl 20, CaCl2 1, Hepes 10, EGTA 11, CsOH 28, MgATP 3, Tris-GTP 0.3, QX-314 5. Lidocaine N-ethyl chloride (QX-314) was included in the patch pipette solution to block voltage-dependent Na+ channels. Cs+ was used to block postsynaptic K+ channels, including GABAB-activated K+ channels (Jiang et al. 1995). To prevent activation of GABAA receptors (GABAARs), the GABAA receptor (GABAAR) antagonist picrotoxin (50 μm) was added to the external solution in all experiments. The inclusion of ion channel blockers in the internal solution as well as voltage clamping at –60 mV prevented the activation of voltage-dependent ionic currents in SCN neurons. Individual SCN neurons were visualized with infrared illumination and differential interference contrast optics using a Leica DMLFS (Leica Biosystems GmbH, Nussloch, Germany) microscope with video camera and display (Sony, Tokyo, Japan). On-line data collection and analysis were performed using an EPC-7 patch clamp amplifier (HEKA Electronik, Lambrecht/Pfalz, Germany), a Macintosh G3 or Mac mini computers, Pulse and Patchmaster programs (HEKA Electronik, Lambrecht/Pfalz, Germany). The records were filtered at 3 kHz and digitized at 10 kHz. To allow equilibration between the pipette solution and the cell cytoplasm, whole cell patch clamp recording started ∼10 min after rupturing the membrane. A small voltage step (2 mV, 5 ms) was applied before optic chiasm or optic nerve stimulation to monitor the series resistance (Moldavan et al. 2006). Recordings were made from the ventrolateral part of SCN.
Optic nerve and optic chiasm stimulation
EPSCs were evoked by electrical stimulation of the optic chiasm or optic nerve with a Grass S88 stimulator connected to a stimulus isolation unit (model SIU5B, Grass Medical Instruments, Quincy, MA, USA). The optic nerve was stimulated with a suction electrode in horizontal brain slices with both optic nerves attached (Moldavan & Allen, 2010) and the evoked EPSC (eEPSC) was recorded from neurons located in the ipsilateral SCN (Jiang et al. 1995). The optic chiasm was stimulated in the coronal brain slice with a concentric bipolar tungsten microelectrode (outer pole diameter 125 μm; catalogue no. CBASC75, FHC, Bowdoinham, ME, USA). The stimulating electrode was placed in the middle part of the optic chiasm as far as possible from the SCN. The stimulus pulse duration was 0.17 ms and the stimulation intensity 19.1 ± 0.7 V (range 9–28 V, n= 43) was set 1.5 times higher than that needed to evoke a threshold response. Paired-pulse stimulation (PPS) and stimulus trains were applied to simulate the discharge frequencies characteristic of ipRGCs. Trains of 25 stimuli (square pulses, 0.08–25 Hz, separated by 40 s intervals between trains) or PPS (2–100 Hz, 3 s interval between paired pulses) were used to study STD and frequency-dependent facilitation induced by relief of baclofen-mediated inhibition. If an alternate PPS protocol was used it was indicated in the text.
Test agent application
All test agents were bath applied by perfusion with ACSF containing the final concentration of the compound. A complete change of the external solution in the recording chamber (volume ∼600 μl) took less than 30 s at a flow rate of 1.5–2 ml min−1. (±)Baclofen, picrotoxin, GABA, 6-cyano-7-nitroquinoxaline-2,3-dione (CNQX), and QX-314, (±)Nipecotic acid (3-Piperidinecarboxylic acid) were purchased from Sigma (St Louis, MO, USA). (2S)-3-[[(1S)-1-(3,4-Dichlorophenyl]amino-2-hydroxy-propyl](phenylmethyl)phosphinic acid (CGP55845), (-)-Bicuculline methochloride, and 4-aminopyridine (4-AP) were purchased from Tocris Cookson Inc. (Ellisville, MO, USA). Appropriate stocks were made and diluted with ACSF just before application. CGP55845 and 4-AP were dissolved in DMSO. The final concentrations of DMSO in the recording solution during CGP55845 and 4-AP application were 0.01% and 0.5%, respectively. Picrotoxin was dissolved in ethanol. The final concentration of ethanol was 0.1%.
Statistical analysis
eEPSC amplitude was measured as the difference between the peak eEPSC current and the baseline before or after the stimulus artefact, when the optic chiasm or the optic nerve was stimulated, respectively. During PPS the paired-pulse ratio (PPR) was calculated as the ratio (mean eEPSC2/mean eEPSC1) of the mean peak amplitude of the second eEPSC (eEPSC2) to the mean peak amplitude of the first eEPSC (eEPSC1) (Kim & Alger, 2001). To estimate the magnitude of the drug effect the amplitude of each successive eEPSC (eEPSCn) in the stimulus train was normalized (in %) to the control eEPSC1 amplitude (ratio eEPSCn/eEPSC1). The ratio described changes of synaptic transmission with reference to the initial transmitter release. The steady-state eEPSC amplitude was calculated as the mean of the amplitude of last 10 eEPSCs in the stimulus train at each stimulus frequency, averaged across all recorded neurons (n) and plotted against stimulus frequency (Hz) (Moldavan & Allen, 2010). To compare the magnitude of STD or facilitation between different conditions (control, drug application) the eEPSCn amplitude was normalized (in %) to the eEPSC1 amplitude for each condition and the steady-state amplitude was calculated. Given the variability of the initial transmitter release the mean eEPSC1 amplitude was calculated from two to three stimulus trains at each stimulus frequency. Short-term synaptic plasticity was defined as facilitation when the ratio eEPSCn/eEPSC1 was greater than 1, and as synaptic depression when the ratio eEPSCn/eEPSC1 progressively decreased to less than 1 during stimulus trains or PPS. The time constant tau (τ) that characterized the decay phase of eEPSC was calculated using the single exponential equation: I(t) =I0+Aexp [–(t–t0)/τ], where I(t) is the current at any given time t; I0 is the residual current, A is the amplitude at time 0, t is the given time, t0 the initial time (t= 0) and τ the time constant. The concentration–response curve for GABABR-mediated inhibition of eEPSC induced by the GABA application was fit with the Hill equation; I=Imax– (Imax–Ibase)/[1 + (EC50/[agonist])nH], where [agonist] is the GABA concentration, Imax is the maximal eEPSC response when [agonist] is 0, Ibase is the eEPSC amplitude at maximal [agonist], EC50 is the effective [agonist] that induced a 50% reduction of eEPSC amplitude and nH is the Hill coefficient. Student's paired or unpaired t tests (two-tailed) or extra sum of squares F test were used for statistical analysis as appropriate to compare the data sets recorded under different conditions. A confidence level of 95% was used to determine statistical significance. P values are reported throughout the text. Data were averaged across recorded neurons (n) and presented as means ±s.e.m. Igor Pro (Version 5.03; Wave Metrics, Inc., Lake Oswego, OR, USA), KaleidaGraph™ (version 3.6; Synergy Software, Reading, PA, USA) and Excel 11.6.5 (or 14.1.3) (Microsoft Co., Redmond, WA, USA) were used for curve fitting, data analysis and graphic presentation.
Results
The activation of presynaptic GABABRs defined the magnitude of initial transmitter release and frequency-dependent changes of synaptic plasticity
STD occurs when the initial release probability (Pr) is high and facilitation when the initial Pr is low (Del Castillo & Katz, 1954; Millar et al. 2002). Reduction of presynaptic Ca2+ influx decreases initial Pr and may induce facilitation during repetitive stimulation (Lev-Tov & Pinco, 1992; Brenowitz & Trussell, 2001; Zucker & Regehr, 2002; Moldavan & Allen, 2010). We predicted that inhibiting presynaptic VDCCs with baclofen would decrease the initial Pr in RHT terminals and induce facilitation in contrast to the STD observed in control (Moldavan & Allen, 2010). We designed experiments to study the frequency-dependent GABABR-mediated synaptic plasticity. The optic chiasm or optic nerve was stimulated with stimulus trains or paired-pulses to simulate discharges of ipRGCs. RHT stimulation induced AMPA receptor-mediated eEPSCs in SCN neurons (Moldavan & Allen, 2010). At 0.08 Hz PPS (40 s between paired pulses) the PPR was approximately 1.0 and changes in synaptic plasticity were not observed in control or during baclofen application. Increasing the PPS frequency to 2–100 Hz induced STD in control experiments (n= 8, Fig. 1A and C). The PPR progressively decreased from ∼1.0 to 0.7 at the highest stimuli frequencies (50, 100 Hz) due to reduction of the eEPSC2 amplitude. In contrast, baclofen (10 μm) significantly increased the PPR in a frequency-dependent manner (F test: F3,8= 72.0; P < 0.001, n= 8; Fig. 1A and B, paired t test, P values are shown on Fig. 1A). The facilitation was observed when baclofen (10 μm) decreased eEPSC1 amplitude to 14.8% of control (157.6 ± 20.8 pA in control and 23.3 ± 4.6 pA during baclofen application, n= 8) that corresponded to nearly maximal baclofen-mediated presynaptic inhibition (Moldavan et al. 2006). The facilitation was maximal at 100 Hz (∼2-fold increase of PPR).
Figure 1. Relief of baclofen-mediated inhibition during paired-pulse stimulation causes frequency-dependent facilitation in retinohypothamic tract synapses.
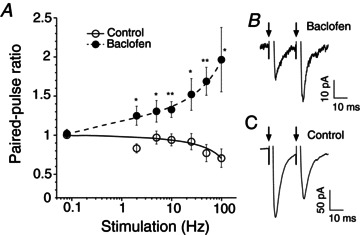
A–C, paired-pulse stimulation of the optic chiasm. A, paired-pulse ratio plotted against stimulus frequency (control, baclofen 10 μm, n= 8). The paired-pulse ratio equals the mean eEPSC2/mean eEPSC1, where the eEPSC1 and eEPSC2 are the first and the second eEPSC in the pair of stimuli, respectively. Short-term synaptic depression was observed in control, while frequency-dependent facilitation was observed during baclofen application. B and C, eEPSC recordings made from the same neuron in control (C) and during baclofen application (B); 50 Hz paired-pulse stimulation, arrows – stimuli application. *P ≤ 0.05, **P ≤ 0.01 (paired t test, two-way). eEPSC, evoked excitatory postsynaptic current.
Baclofen (10 μm) application decreased the initial Pr and enhanced synaptic strength (Fig. 2A–F). Baclofen decreased the eEPSC1 amplitude during 50 Hz optic nerve PPS (12 s between paired pulses (Fig. 2A and B). The PPR exceeded the control level three times during the entire period of baclofen application and about 20 min of washout (Fig. 2C and D).
Figure 2. Baclofen-mediated presynaptic inhibition in retinohypothamic tract synapses increased synaptic strength.
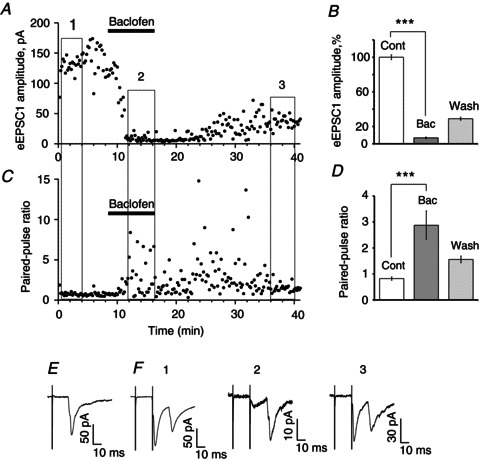
A, the amplitude of the first eEPSC (eEPSC1) evoked by 50 Hz PPS of the optic nerve was plotted. At 12 s intervals between pairs of stimuli the eEPSC1 amplitude remained relatively stable [control (1)]. eEPSC1 amplitude decreased during baclofen (10 μm) application (2) and partially recovered during washout (3). B, mean eEPSC1 amplitude is shown for three specified intervals: control, baclofen (10 μm) and washout (average of 20 sweeps, % of control). C and D, 50 Hz PPS revealed an increase of synaptic strength (facilitation) during baclofen application. C, baclofen application increased paired-pulse ratio. D, paired-pulse ratio (mean eEPSC2/mean eEPSC1): control, baclofen, washout (average of 20 sweeps). Paired t test, two tail, ***P < 0.001. E and F, recordings of eEPSC made from the same neuron. E, 0.08 Hz stimulation (average of n= 4 sweeps). F, PPS: control (1), baclofen (2) and washout (3); average of 15 sweeps. Numbers correspond to specified periods (1, 2, 3) on (A) and (C). Bac, baclofen; Cont, control; eEPSC, evoked excitatory postsynaptic current; PPS, paired-pulse stimulation.
Stimulus train application induced STD in the majority of recorded SCN neurons (Moldavan & Allen 2010). During repetitive stimulation the ratio of the amplitude of each successive eEPSC to the amplitude of the first eEPSC (eEPSCn/eEPSC1) progressively decreased until it reached steady state (Fig. 3A). STD was not observed during the 0.08 Hz stimulation, thus 12 s intervals between stimuli were sufficient for eEPSC1 recovery (Fig. 3B). The magnitude of STD was higher during stimulus train application than during PPS due to activity-dependent vesicle depletion (Moldavan & Allen, 2010). Baclofen (10 μm)-mediated inhibition was relieved by fast (50 Hz) repetitive stimulation (Fig. 3A and C). In contrast, during low-frequency stimulation (0.08 Hz) the eEPSCn/eEPSC1 ratio was not changed indicating a frequency dependence of relief of baclofen-mediated inhibition (Fig. 3B). The baseline current remained stable even at high stimulus frequencies and, therefore, did not significantly contribute to the measured change of the eEPSC amplitude. For example, during 25 Hz stimulation the negative baseline shift was 8.95 ± 0.90 pA and 4.27 ± 1.10 pA (or 4.42 ± 0.78% and 2.29 ± 0.75% of the eEPSC1 amplitude, n= 10) in control and during baclofen (10 μm) application, respectively.
Figure 3. Relief of baclofen-mediated inhibition during high-frequency repetitive stimulation.
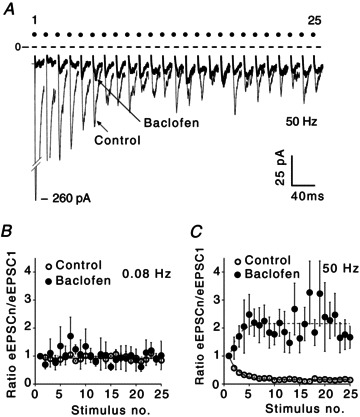
A, eEPSCs recordings during stimulus train application [50 Hz, optic chiasm stimulation, 25 stimuli in the train; control, baclofen (10 μm), average of 10 sweeps]. Note: these records are not shown on a time scale (each dot shows the stimulus number). B and C, ratio of eEPSCn/eEPSC1 amplitude: (B) 0.08 Hz, average of three sweeps (control), five sweeps (baclofen); (C) 50 Hz stimulation, average of five sweeps (control), 10 sweeps (baclofen). eEPSC1 is the amplitude of the first eEPSC; eEPSCn is the amplitude of the each successive eEPSC in the train. eEPSC, evoked excitatory postsynaptic current.
Next, we studied how the frequency-dependent relief from the baclofen-mediated inhibition depends on the magnitude of the initial transmitter release. To reduce the initial Pr, baclofen concentrations that induced near maximal (10 μm) or half-maximal (1 μm) inhibition of the eEPSC amplitude were applied (Moldavan et al. 2006).
Following baclofen (10 μm) application functional criteria were used to separate recorded neurons into two groups. The first group (Group I) included neurons demonstrating facilitation of eEPSCs caused by frequency-dependent relief of baclofen-mediated inhibition during stimulus train application. Records were obtained during optic nerve (n= 4) or optic chiasm (n= 8) stimulation (Fig. 4A–D). The second group (Group II) of neurons showed activity-dependent STD during baclofen application (n= 6, optic chiasm stimulation, Fig. 4E and F). The eEPSC1 amplitude (% of control) then was measured for each group to evaluate the magnitude of baclofen-mediated presynaptic inhibition (i.e. the reduction of initial Pr). In addition, the steady-state eEPSC amplitude was measured over a range of stimulus frequencies during optic nerve or optic chiasm stimulation with stimulus trains (Fig. 4).
Figure 4. Synaptic plasticity depends on the sensitivity of retinohypothamic tract terminals to GABABR agonist and its concentration.
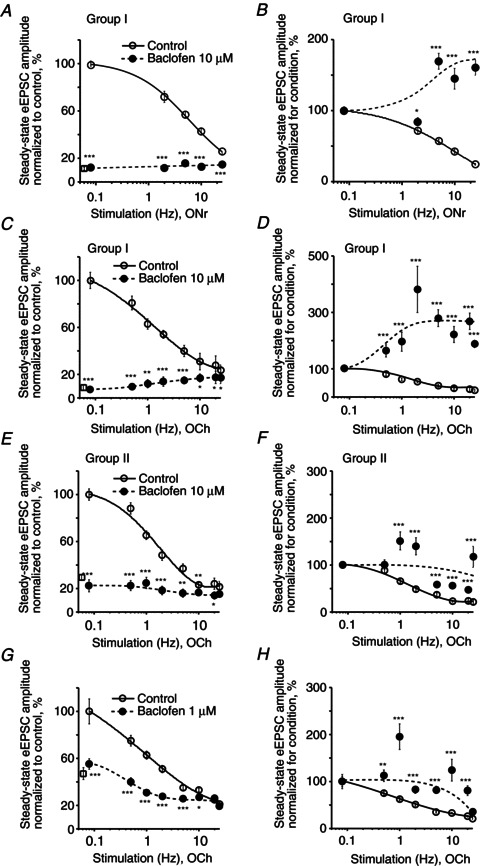
A–H, frequency dependence of the steady-state eEPSC amplitude during 0.5–25 Hz stimulus train application (control, baclofen). A–D, Group I neurons. E and F, Group II neurons. A and B, baclofen 10 μm, ONr stimulation, n= 4 neurons; C and D, baclofen 10 μm, OCh stimulation, n= 8; E and F, baclofen 10 μm, OCh stimulation, n= 6; G and H, baclofen 1 μm, OCh stimulation, n= 4. A, C, E and G, to compare the magnitude of the baclofen-mediated inhibition at each stimulus frequency, the amplitude of each successive eEPSC in the stimulus train was normalized (%) to the eEPSC1 amplitude in control, than the steady-state eEPSC amplitude was plotted (open circles, control; closed circles, baclofen). The mean eEPSC1 amplitude (% of control) recorded over the range of stimulus frequencies during baclofen application is shown as an open square near the Y-axis. Short-term synaptic depression was observed in control. The eEPSC amplitude during baclofen application did not exceed the steady-state amplitude in control. B, D, F and H, to compare changes in synaptic plasticity between conditions (control, baclofen) the same data were normalized (%) to the eEPSC1 amplitude for each condition. Paired t test, two tail, *P < 0.05, **P < 0.01, ***P < 0.001. eEPSC, evoked excitatory postsynaptic current; OCh, optic chiasm; ONr, optic nerve.
In Group I, repetitive stimulation significantly relieved the presynaptic baclofen-mediated inhibition during optic nerve (Fig. 4A and B) or optic chiasm (Fig. 4C and D) stimulation. When the optic nerve was stimulated, baclofen inhibited the eEPSC1 to 11.02 ± 0.02% (range 6.4–16.9%) of control (eEPSC1 was 14.0 ± 2.9 pA during baclofen application versus 127.0 ± 16.7 pA in control, n= 4, Fig. 4A). During optic chiasm stimulation baclofen inhibited the eEPSC1 to 7.96 ± 0.02% (range 2.8–25.0%) of control (eEPSC1 was 18.3 ± 4.1 pA during baclofen application versus 230.0 ± 47.2 pA in control, n= 8, Fig. 4C). The steady-state eEPSC amplitude was attenuated by baclofen over the entire range of applied stimulus frequencies during optic nerve (F test: F3,2= 309.3, P < 0.01; paired t test, P < 0.001) or optic chiasm (F test: F3,8= 190.6, P < 0.001; paired t test, P < 0.05) stimulation. Under these conditions, the eEPSCn amplitude increased in a frequency-dependent manner and reached a maximum at 25 Hz. The increased eEPSCn amplitude indicated a relief of baclofen-mediated inhibition. To compare changes in synaptic plasticity, the same data were normalized to the eEPSC1 for each condition (control, baclofen, Fig. 4B and D). During baclofen (10 μm) application the eEPSCn amplitude progressively increased to 1.5–2.5 times the eEPSC1 amplitude demonstrating maximal facilitation during 5–25 Hz stimulation of the optic nerve (n= 4, F test: F3,2= 37.2, P < 0.05; paired t test, P < 0.001 at 5–25 Hz, Fig. 4B) or the optic chiasm (n= 8, F test: F3,8= 4.0, P < 0.05; paired t test, P < 0.001, Fig. 4D).
In Group II, where stimulus trains produced only modest relief of baclofen (10 μm)-mediated inhibition, STD was observed. Baclofen inhibited the eEPSC1 to 30.19 ± 0.10% of control (eEPSC1 was 53.2 ± 18.1 pA during baclofen application versus 176.2 ± 30.6 pA in control, n= 6, Fig. 4E). Under these conditions no facilitation was observed (Fig. 4F). These data indicate that RHT inputs on to recorded neurons in Group II were less sensitive to baclofen than in Group I.
Similarly, a moderate decrease of STD was observed when baclofen (1 μm) reduced the eEPSC1 amplitude to 46.5 ± 0.2% of control (66.5 ± 27.5 pA during baclofen application versus 143.0 ± 26.8 pA in control (n= 4, paired t test, P < 0.01, Fig. 4G and H).
Our data clearly show that synaptic plasticity depends on the initial Pr and could be different even at the same baclofen concentration. The magnitude of the reduction of initial Pr by baclofen determined the frequency-dependent changes of synaptic plasticity.
GABA activating presynaptic GABABRs modulated retinohypothamic tract synaptic transmission in a concentration- and frequency-dependent manner
We wondered what concentration of GABA is needed to activate GABABRs to decrease the eEPSC1 amplitude to about 10% of control to produce the largest frequency-dependent relief of GABABR-mediated inhibition of synaptic transmission. To block GABAARs, picrotoxin (50 μm) or bicuculline (20 μm) were applied together with GABA. The concentration–response curve for GABA was fitted with a Hill equation (EC50= 0.49 ± 0.04 mm, Hill coefficient = 1.86, n= 15, see Methods, Fig. 5A). Only GABA concentrations greater than or equal to 2 mm decreased the eEPSC1 amplitude to less than 10% of control. GABA (5 mm) reduced the eEPSC1 amplitude to 5.9 ± 0.7% of control and strongly attenuated the steady-state eEPSC amplitude over the range of stimulus frequencies (F test: F3,2= 28.0, P < 0.05; paired t test, P < 0.001, n= 4, Fig. 5B). The same data normalized for each condition (control, GABA) demonstrated frequency-dependent relief of GABABR-mediated presynaptic inhibition during GABA (5 mm) application (paired t test, P < 0.001 at 1–25 Hz, n= 4, Fig. 5C).
Figure 5. GABA concentration- and frequency-dependent modulated synaptic transmission at retinohypothamic tract synapses by activating presynaptic GABABRs.
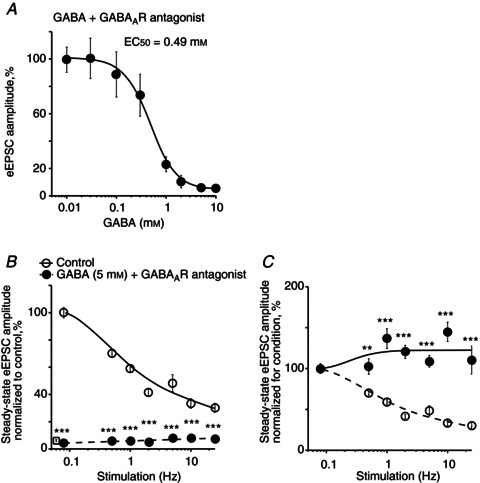
A, GABA activated presynaptic GABABRs and reduced the eEPSC amplitude in a concentration-dependent manner. GABA was applied together with the GABAAR antagonists: picrotoxin (50 μm) or bicuculline (20 μm). eEPSC amplitude (% of control) was measured during 0.08 Hz stimulation. The concentration–response curve was fitted with a Hill equation (EC50= 0.49 ± 0.04 mm, Hill coefficient = 1.86, n= 15). B, frequency dependence of the steady-state eEPSC amplitude during optic chiasm stimulation with stimulus trains (control, GABA (5 mm) together with GABAAR antagonists). Amplitude of each successive eEPSC in the stimulus train was normalized (%) to the eEPSC1 amplitude in control. The mean eEPSC1 amplitude recorded over the range of stimulus frequencies during GABA application is shown as an open square near Y-axis (5.9 ± 0.7% of control, n= 4). C, the same data normalized to the eEPSC1 amplitude for each condition (control, GABA) demonstrated short-term synaptic depression in control and, frequency-dependent relief of GABABR-mediated inhibition during GABA application. Paired t test, two tail, **P < 0.01, ***P < 0.001. eEPSC, evoked excitatory postsynaptic current.
Blockade of GABA uptake increased GABABR-mediated presynaptic inhibition
We applied nipecotic acid, a transportable blocker of all types of GABA transporters, to inhibit the GABA uptake. As the rate of GABA uptake increases directly proportional to the increase of temperature (Binda et al. 2002), experiments were performed at physiological temperature (35°C). Picrotoxin (50 μm) was applied to block the GABAA current. Nipecotic acid (40 mm) fully blocked the eEPSC (Fig. 6A). The inhibition induced by nipecotic acid (20 mm) was completely reversed by the GABABR antagonist CGP55845 (3 μm) (Fig. 6B). Thus, inhibition of GABA uptake by nipecotic acid caused an accumulation of extracellular GABA that activated presynaptic GABABRs inhibiting the eEPSC.
Figure 6. Inhibition of GABA uptake increased extracellular GABA concentration that activated presynaptic GABABRs and inhibited retinohypothamic tract synaptic transmission.
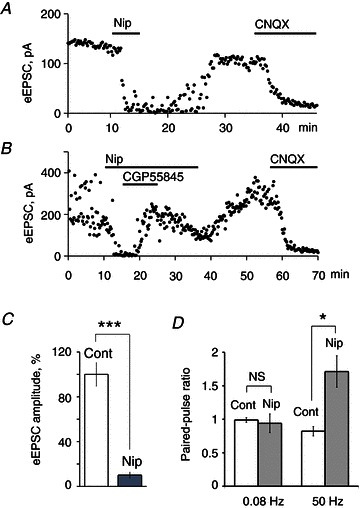
A, inhibition of eEPSC by nipecotic acid (40 mm), a non-selective transportable GABA uptake inhibitor. Nipecotic acid increased the extracellular GABA concentration. In turn, GABA in the presence of the GABAAR antagonist picrotoxin (50 μm) activated presynaptic GABABRs and inhibited RHT synaptic transmission. B, GABABRs antagonist CGP55845 (3 μm) recovered eEPSC inhibited by nipecotic acid (20 mm). A and B, CNQX (20 μm) blocked eEPSC induced by optic chiasm stimulation (0.08 Hz). C, nipecotic acid (5 mm) decreased the eEPSC amplitude to about 10% of control (n= 9). D, nipecotic acid (5 mm) induced a frequency-dependent facilitation during 50 Hz paired-pulse stimulation: paired-pulse ratio increased 1.7 times versus paired-pulse ratio in control or during low frequency (0.08 Hz) stimulation (n= 8). A–D, nipecotic acid was applied together with picrotoxin (50 μm). Paired t test, two tail, *P < 0.05, ***P < 0.001; NS, non-significant changes. CNQX, 6-cyano-7-nitroquinoxaline-2,3-dione; eEPSC, evoked excitatory postsynaptic current; Nip, nipecotic acid.
Nipecotic acid (5 mm) decreased the eEPSC amplitude to 10.0 ± 2.6% of control (two-tailed t test P < 0.001. n= 9, Fig. 6C). At 0.08 Hz PPS, no difference was found in synaptic plasticity in control and during nipecotic acid application (PPR: 0.99 ± 0.03 and 0.94 ± 0.14 for control and nipecotic acid, respectively; two-tailed t test P = 0.74, n= 8, Fig. 6D). In contrast, at 50 Hz PPS synaptic depression was observed in control (PPR 0.82 ± 0.07) and facilitation (PPR 1.71 ± 0.23) during nipecotic acid application (two-tailed t test P < 0.02, n= 8). Thus, when GABA uptake was inhibited, accumulated GABA strongly activated presynaptic GABABRs, and decreased initial transmitter release from RHT terminals. Under these conditions high-frequency stimulation relieved GABABR-mediated inhibition.
Inhibition of the 4-aminopyridine-sensitive K+ currents increased initial Pr and restored synaptic transmission altered by baclofen
Increasing the duration of action potential-like depolarizing waveforms in HEK 293 cells relieved G protein-mediated inhibition (Brody et al. 1997). Therefore, we predicted that broadening the presynaptic action potential would relieve the baclofen-mediated inhibition of VDCCs in RHT terminals. To broaden the presynaptic action potential, 4-AP (5 mm), a blocker of transient A-type potassium currents, was applied. 4-AP broadened the action potential and induced a slow Ca2+ transient followed by the fast transient in the optic nerve (Sun & Chiu, 1999). The elongation of the Ca2+ influx induced by 4-AP increased the amplitude (189.2 ± 30.5% of control, t test: P < 0.01, n= 8) and slowed the decay of the eEPSC during 0.08 Hz stimulation of the optic chiasm (Fig. 7A). The eEPSC demonstrated an exponential decay and the time constant (tau) was increased 46.1 ± 20.6% of control (7.0 ± 1.2 ms during 4-AP application vs. 4.7 ± 0.8 ms in control, two-tailed t test: P < 0.001, n= 7, Fig. 7C). Baclofen (10 μm) decreased the eEPSC amplitude to 6.5 ± 1.4% of control (n= 10, Fig. 7B). Baclofen did not alter the presynaptic action potential properties (Isaacson, 1998) and did not significantly affect the decay of eEPSC, tau: 4.5 ± 0.6 ms vs. 5.2 ± 0.6 ms in control (tau 86.6 ± 6.5% of control; two-tailed t test: P = 0.75, n= 5; baclofen 10 μm). Application of 4-AP relieved the baclofen-mediated inhibition and increased the eEPSC amplitude to 108.3 ± 21.5% of control (t test: P = 0.70, n= 10, Fig. 7D). Being applied together with baclofen (10 μm), 4-AP broadened the eEPSC and increased the tau 142.4 ± 12.8% of control (6.8 ± 1.5 ms vs. 4.7 ± 0.8 ms in control, two-tailed t test P < 0.01, n= 7).
Figure 7. 4-AP restored synaptic transmission altered by baclofen.
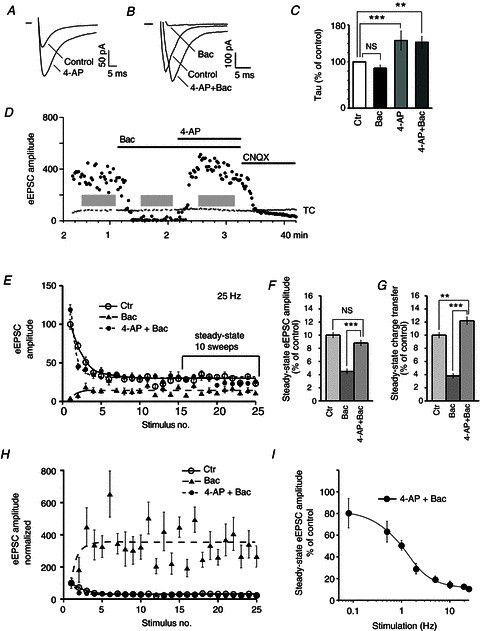
A and B, EPSCs evoked by 0.08 Hz optic chiasm stimulation. A, 4-AP (5 mm) increased the amplitude and the decay time of the eEPSC (average of 25 trials). B, eEPSCs were inhibited by baclofen (10 μm). 4-AP applied together with baclofen increased the eEPSC amplitude and lengthened the decay time of eEPSC (average of nine trials). C, time constant of the eEPSC decay calculated for conditions: baclofen, 4-AP, and 4-AP+baclofen applications. The eEPSC decay was fit with single exponential curve and the resulting time constants were compared (% of control, mean of seven eEPSCs for each neuron, n= 7 neurons). D, eEPSC was blocked by baclofen and recovered after 4-AP application (0.08 Hz stimulation). The eEPSC was induced by AMPA receptor activation and was blocked by CNQX (20 μm). E, activity-dependent changes of eEPSC amplitude (control, baclofen, 4-AP and baclofen together). eEPSC amplitude normalized (%) to the control eEPSC1 amplitude (eEPSC1, the first eEPSC in the train). F and G, eEPSC amplitude (F) and charge transfer (G) were analysed during steady state (last 10 sweeps in the train). H, eEPSC amplitude normalized (%) to the eEPSC1 amplitude for each condition (control, baclofen, 4-AP and baclofen together). I, frequency-dependent decrease of the steady-state eEPSC amplitude during joint 4-AP and baclofen application (0.08–25 Hz stimulation). Unpaired (C) or paired (F and G) t test, two tail: **P < 0.01, ***P < 0.001. 4-AP, 4-aminopyridine; Bac, baclofen; CNQX, 6-cyano-7-nitroquinoxaline-2,3-dione; Ctr, control; eEPSC, evoked excitatory postsynaptic current; TC, test current; grey rectangles (D), stimulation with stimulus trains (optic chiasm stimulation, 25 Hz, 25 stimulus in the train).
The broadening of presynaptic action potential combined with high-frequency stimulation should maximally relieve the baclofen-mediated inhibition. In addition, this will allow us to answer the question: Does the maximal relief of G protein-mediated inhibition overwhelm vesicle depletion? To test this idea we used 25 Hz stimulus trains to induce frequency-dependent relief of baclofen-mediated inhibition and applied 4-AP to broaden the action potentials. eEPSC amplitude and the charge transfer were analysed during the last 10 sweeps in the train when the eEPSCn amplitude reached the steady state, and vesicle depletion was maximal for each stimulus frequency. To compare the steady-state amplitude between different conditions [control, baclofen (10 μm), joint baclofen and 4-AP application], it was normalized (%) to the eEPSC1 in control (Fig. 7E). Twenty-five Hz stimulation relieved baclofen-mediated inhibition and induced maximal facilitation (eEPSCn amplitude was normalized of eEPSC1 at each condition, Fig. 7H). 4-AP applied together with baclofen increased initial Pr (eEPSC1 amplitude) and produced STD during high-frequency stimulation (Fig. 7E and H). During joint 4-AP and baclofen application the steady-state eEPSC amplitude and charge transfer were similar to or higher than control, and significantly exceeded those parameters during baclofen application alone (Fig. 7F and G). Despite the fact that the broadening of action potential by 4-AP in combination with high-frequency stimulation would maximally relieve the baclofen-mediated inhibition, the steady-state eEPSC amplitude demonstrated a frequency-dependent decrease (Fig. 7I).
Thus, even during maximal relief of baclofen-mediated inhibition induced by high-frequency stimulation and by broadening of the presynaptic action potential the steady-state eEPSC amplitude and charge transfer were attenuated by vesicle depletion.
Endogenous GABA modulates the EPSC evoked by retinohypothalamic tract stimulation
The data describing the GABA content and GAD activity in the rat SCN during the LD cycle are controversial. It was reported that they are minimal during the light phase and maximal during the dark phase at ZT 16.00 h (Aguilar-Roblero et al. 1993). Though in earlier studies the peak of GABA levels in the rat hypothalamus was detected during the lights-on period (Cattabeni et al. 1978). In these studies the diurnal changes of GABA content in the SCN were reported but the extracellular GABA level was not determined. Therefore, to investigate how extracellular GABA modulates RHT synaptic transmission during the LD cycle, CGP55845 (3 μm) was applied to block presynaptic GABABRs and the eEPSC was recorded (Fig. 8C). To confirm that GABABRs were completely blocked, baclofen (10 μm) was applied after CGP55845. Under these conditions, baclofen did not inhibit eEPSCs because GABABRs remained blocked at least 30 min after ending CGP55845 application. To confirm that eEPSCs were induced by activation of AMPA receptors, 6-cyano-7-nitroquinoxaline-2,3-dione (20 μm) was applied after each recording. During light and dark phases the eEPSC was recorded, respectively, from 22 and 21 neurons located in the ventrolateral SCN (Fig. 8B). eEPSC amplitude was measured at 0.08 Hz stimulation that does not induce STD (Moldavan & Allen, 2010). During the light phase (ZT 5.00–9.00 h) CGP55845 increased the eEPSC amplitude 28.2 ± 9.1% of control (168.3 ± 9.6 pA) in 55% (12 of 22) neurons and decreased the amplitude 28.4 ± 5.8% of control (176.4 ± 18.0 pA) in 45% (10 of 22) cells (Fig. 8A and B, left column). During the dark phase (ZT 15.00–18.00 h) CGP55845 increased the eEPSC amplitude 30.8 ± 16.2% of control (153.1 ± 12.9 pA) in 33% (seven of 21) neurons and decreased the amplitude 21.6 ± 3.9% of control (145.0 ± 12.6 pA) in 67% (14 of 21) cells (Fig. 8A and B, right column). Thus, CGP55845 similarly increased eEPSC amplitudes during both light and dark phases (two-tailed t test, P = 0.89, n= 19). At the same time, a significant diversity in the tonic activation of GABABRs located on RHT terminals was observed during the LD cycle: CGP55845 increased the eEPSC amplitude in the range 2.5–116.8% of control (the average 29.1 ± 8.0%, two-tailed t test, P < 0.016, n= 19) (Fig. 8E).
Figure 8. Presynaptic GABABR-mediated tonic inhibition of retinohypothamic tract synaptic transmission induced by endogenous GABA.
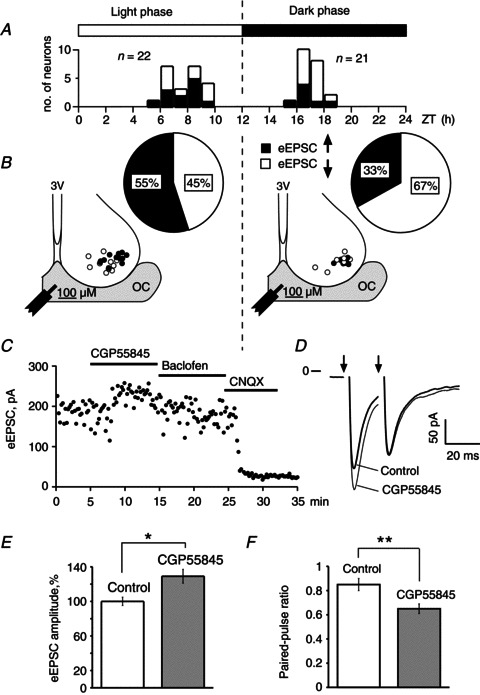
A, ZT scale was used to show the time when eEPSC recordings were performed. Distribution of neurons recorded during light and dark phase is shown. n is the quantity of neurons. B, sector diagrams: the ratio (%) of neurons in which the eEPSC amplitude increased (black) or decreased (white) during GABABR antagonist CGP55845 (3 μm) application. Recorded neurons were located in the ventrolateral region of the suprachiasmatic nucleus (coronal slice); OC, optic chiasm; 3V, third ventricle; filled circles, neurons whose retinohypothamic tract inputs were under tonic inhibitory control of endogenous GABA; open circles, neurons whose retinohypothamic tract inputs were not inhibited by endogenous GABA; the tip of the stimulus electrode was located in the middle part of the OC. C, eEPSC recording during successive application of CGP55845, baclofen (10 μm) and CNQX (20 μm). D, eEPSC recordings during paired-pulse stimulation (50 Hz): control, CGP55845 application; average of 25 sweeps; arrows are stimuli applications. E, eEPSC amplitude was increased by CGP55845 (n= 19). F, CGP55845 decreased the paired-pulse ratio due to an increase of the eEPSC1 amplitude (paired-pulse stimulation, 50 Hz, n= 19). Paired t test, two tail, *P < 0.05, **P < 0.01. CNQX, 6-cyano-7-nitroquinoxaline-2,3-dione; eEPSC, evoked excitatory postsynaptic current; ZT, Zeitgeber.
We also checked the possibility that stronger electrical stimuli may induce a greater GABA release resulting in more extracellular GABA due to spillover. Therefore, we compared the strength of electric stimuli used to evoke EPSC in two groups of neurons that demonstrated the increase or decrease of eEPSC amplitude, respectively, during CGP55845 application. The magnitude of stimulation was not significantly different between those groups: 20.3 ± 1.1 V (ratio stimulus/threshold = 1.6, n= 19) versus 18.3 ± 0.9 V (ratio stimulus/threshold = 1.5, n= 24) for neurons that increased and decreased the eEPSC amplitudes, respectively (two-tailed t test, P= 0.17, n= 43). Thus, the increase of eEPSC amplitude during CGP55845 application was not caused by an increase of the stimulus intensity. Both groups of neurons had similar locations in the SCN. Many of the neurons that showed increased eEPSC amplitude were located even farther from the stimulating electrode than neurons in which the eEPSC amplitude was decreased. Thus, the RHT inputs to the neurons that demonstrate an increase of eEPSC amplitude during CGP55845 application were under the tonic inhibitory control of endogenous GABA that activated presynaptic GABABRs on RHT terminals.
To study how endogenous GABA modulates synaptic plasticity, the 50 Hz optic chiasm PPS was applied. In neurons under tonic inhibitory control of endogenous GABA (i.e. demonstrated an increase of the eEPSC1 amplitude during CGP55845 application) the PPR significantly decreased to 0.65 ± 0.04 after CGP55845 application versus 0.85 ± 0.05 in control (two-tailed t test, P < 0.002, n= 19, Fig. 8F). The PPR decreased mainly due to a change of the eEPSC1 but not eEPSC2 amplitude (Fig. 8D). During CGP55845 application the eEPSC1 amplitude increased 29.1 ± 8.0% while the eEPSC2 amplitude decreased only 2.8 ± 4.9%. Thus, blocking GABABRs increased the initial Pr and the magnitude of STD. Or, in other words, the activation of presynaptic GABABRs by endogenous GABA attenuates initial Pr and decreases STD. In the rest of the neurons, in which CGP55845 decreased the eEPSC amplitude, the PPR did not change significantly: 0.8 ± 0.07 and 0.78 ± 0.07 in control and during CGP55845 application, respectively (two-tailed t test, P= 0.83, n= 24).
Discussion
Frequency and concentration dependence of GABABR-mediated synaptic plasticity
The maximal action potential firing rate of ipRGCs varied between the different types of cells and can exceed 100 Hz (Wong, 2012; Hu et al. 2013). Repetitive stimulation of the optic nerve or optic chiasm that simulate the firing of ipRGCs induced a frequency-dependent STD in most RHT synapses on to SCN neurons that reflects activity-dependent reduction of transmitter release when the initial Pr is high (Del Castillo & Katz, 1954; Millar et al. 2002; Moldavan & Allen, 2010). We predicted that activation of GABABRs on RHT terminals would decrease Pr and increase synaptic strength during high-frequency stimulation. The expression of VDCCs, GABABRs, G proteins and extent of modulation of different Ca2+ channel subtypes will define the sensitivity of RHT terminals to GABABR agonists (Brenowitz & Trussell, 2001; Moldavan et al. 2006). The synaptic strength was enhanced by baclofen decreasing the initial Pr. Strong activation of GABABRs by baclofen (10 μm) reduced the eEPSC1 amplitude to less than 15% of control and induced frequency-dependent facilitation in RHT synapses during PPS or stimulus train application. The maximal facilitation was observed during 25–100 Hz stimulation. Some terminals were under the weaker GABAB inhibitory control, therefore baclofen (10 μm) reduced the eEPSC1 amplitude only to 30% of control and STD was observed. The initial Pr was higher at the lower baclofen concentration (1 μm), when the eEPSC1 amplitude decreased to only 43% of control, and stimulation induced STD. Thus, the value of the Pr and synaptic plasticity depended on the sensitivity of RHT terminals to baclofen. If the eEPSC1 amplitude exceeded 30% of control, STD instead of facilitation was observed. GABA (>2 mm) applied by bath or accumulated due to GABA uptake inhibition decreased the eEPSC1 amplitude to 10% of control producing a frequency-dependent relief of GABABR-mediated inhibition.
Our data agree with previous studies on the calyceal synapse and the spinal cord showing the relief of G protein-mediated inhibition at high stimulus frequencies during strong activation of presynaptic GABABRs (Lev-Tov & Pinco, 1992; Brenowitz & Trussell, 2001). In the presence of baclofen, the maximal eEPSCn amplitude during the facilitation did not exceed the steady-state amplitude observed during STD in control. This indicates that in RHT synapses frequency-dependent facilitation caused by relief of G protein-mediated inhibition does not overcome vesicle depletion.
The functional and behavioural relevance of the relief from G protein-mediated inhibition induced at faster stimulation frequencies is not clear. In contrast to vesicle depletion, which acts as a low-pass filter, the activation of G protein-coupled presynaptic GABABRs act as a high-pass filter by increasing the Pr at faster stimulus frequencies (Forsythe et al. 1998; Brody & Yue, 2000; Bertram, 2001; Fortune & Rose, 2001). We agree with Brenowitz et al. (1998) that: ‘The ability to modulate release probability by presynaptic receptors may represent an adaptation to control the rate of vesicle depletion and receptor desensitization in order to maintain maximal synaptic strength at different stimulus rates’.
Blockade of transient A-type potassium currents reversed inhibitory effect of baclofen on eEPSCs
Baclofen-mediated inhibition of presynaptic VDCCs is voltage-dependent. Therefore, strong prepulse depolarization of the presynaptic terminal as well as widening of action potential-shaped waveforms during repetitive stimulation relieved GABABR-mediated inhibition (Brody et al. 1997; Isaacson, 1998). 4-AP, a blocker of the transient A-type potassium currents, broadens the action potential, induces the delayed depolarization and slows repolarization in the rat optic nerve (Gordon et al. 1988; Sun & Chiu, 1999). We predicted, that broadening of the presynaptic action potential by 4-AP in combination with high-frequency stimulation would strongly relieve the baclofen-mediated inhibition in RHT terminals. 4-AP increased the Pr and substantially diminished the baclofen-mediated inhibition in RHT synapses, even during strong activation of presynaptic GABABRs (Brody & Yue, 2000; Moldavan et al. 2006). Baclofen-mediated inhibition may be altered by several mechanisms. Baclofen does not activate voltage-gated K+ channels in the rat optic nerve, in the RHT, or other glutamatergic presynaptic terminals (Takahashi et al. 1998; Sun & Chiu, 1999; Moldavan et al. 2006) and does not change presynaptic action potential properties (Isaacson, 1998; Sun & Chiu, 1999). Therefore, blocking of 4-AP-sensitive K+ currents would not directly alter the baclofen-mediated inhibition. Because the baclofen effect is voltage-dependent, the broadening of presynaptic action potential will relieve baclofen-mediated inhibition. 4-AP delays repolarization of presynaptic action potentials, which increased Ca2+ entry and may activate VDCCs that were not inhibited by baclofen (Sun & Chiu, 1999; Brody & Yue, 2000; Moldavan et al. 2006; Wu et al. 2009). Baclofen strongly decreased initial Pr; therefore, during high-frequency repetitive stimulation the ratio eEPSCn/eEPSC1 was higher than 1, consistent with frequency-mediated facilitation. 4-AP enhanced the eEPSC1 amplitude and the time constant of eEPSC1 decay. When 4-AP increased the initial Pr, the ratio eEPSCn/eEPSC1 was less than 1 and STD was observed. We compared the eEPSCn induced by prolonged high-frequency stimulation, when STD or frequency-dependent relief of baclofen-mediated inhibition were maximal. During STD (in control or joint 4-AP and baclofen application), eEPSCn was even higher than during facilitation when baclofen was applied alone. Our data are consistent with previous studies where baclofen in high Ca2+/4-AP extracellular solutions caused only small changes in short-term plasticity that casts doubt on changes in the maximal Pr as the mechanism of facilitation (Brody & Yue, 2000). Even under conditions, when baclofen-mediated inhibition was relieved by high-frequency stimulation and by broadening of presynaptic action potential, the eEPSC amplitude and the charge transfer during steady state were in the range observed in control. Thus, the relief of baclofen-mediated inhibition could not overcome the gain control introduced by vesicle depletion in RHT synapses, in contrast to synapses designed for conduction of high-frequency action potentials (Brenowitz et al. 1998; Bertram, 2001). Our data are consistent with the idea that baclofen blocking presynaptic VDCCs regulates transmitter release upstream of the vesicle release mechanism.
Endogenous GABA induces tonic GABABR-mediated inhibition of retinohypothalamic tract synaptic transmission
Direct synaptic connections between GABAergic and retinal terminals have not been described in the SCN, although those terminals are located in close proximity to each other (Belenky et al. 2008). Therefore, presynaptic GABABRs on RHT terminals could be activated by GABA that diffuses from local GABAergic synapses (Moore & Speh, 1993; Sollars et al. 2006; Belenky et al. 2008) including afferents from the intergeniculate leaflet (Pickard et al. 1987; Morin et al. 1992) and surrounding hypothalamic tissue (Castel & Morris, 2000). The extracellular GABA concentration in the hypothalamus was detected by microdialysis in the range 0.05–0.07 μm (Yananli et al. 2008). The low endogenous GABA concentration and, therefore relatively weak activation of GABABRs might explain why microinjection of GABAB antagonists neither alters phase shifts during the subjective night or increases c-Fos expression in the SCN when administered before light exposure, nor induce phase shifts when given alone (Gillespie et al. 1997, 1999).
Considering our data, we propose the hypothesis that two mechanisms co-operate regulating extrasynaptic GABA in the SCN. The first is the activity of GABAergic neurons in SCN and, possibly, some external GABAergic inputs and, the second, the GABA uptake mechanism. Recordings in freely moving rats showed that SCN neurons increased their discharge twofold in the day and decreased activity at night (Meijer et al. 1998). The firing frequency of SCN neurons recorded from rat brain slices also peaked near midday and gradually decreased during subjective night (Green & Gillette, 1982; Jobst & Allen, 2002; Gribkoff et al. 2003). In addition, a larger proportion of SCN neurons are silent during subjective night than during the day. For example, the percentage of silent cells in SCN increased up to ∼40% during subjective night in comparison to 20% of the population during the day (Schaap et al. 1999; Jobst & Allen, 2002). Thus, more SCN neurons are active and fire faster during the subjective day. Because most SCN neurons are GABAergic the release and synaptic spillover of GABA would be predicted to be stronger during the day than at night. This conclusion is confirmed by measurement of the glutamic acid decarboxylase (GAD65) mRNA level in the rat SCN that was significantly higher in the light than in the dark (Huhman et al. 1996). Our data are in a good agreement with these findings. In our experiments, CGP55845 application increased the eEPSC amplitude in 55% of studied SCN neurons during the subjective day and in 33% during the night. This indicates that more RHT terminals projecting on to SCN neurons are under the inhibitory control of endogenous GABA during the light than during the dark phase. In contrast, baclofen activating presynaptic GABABRs inhibited eEPSCs in a concentration-dependent way in almost all studied SCN neurons, and the rate of inhibition was not significantly different during subjective day and night (Moldavan et al. 2006). Baclofen is not a substrate for GABA uptake carriers (Ong & Kerr, 1998). Therefore, baclofen could not be removed from the extracellular space by GABA transporters and activates GABABRs on all RHT terminals. We suggest that GABA spillover from GABAergic synapses is limited by GABA uptake mechanisms. Therefore, synaptically released GABA activated only GABABRs on RHT terminals located in close proximity to GABAergic synapses and did not activate ones on remote RHT terminals. Thus, RHT inputs to 45–67% of SCN neurons were not inhibited by endogenous GABA during the LD cycle but could be inhibited by baclofen. The important role of GABA uptake was confirmed in our experiments. Nipecotic acid blocked GABA uptake, significantly increasing GABA diffusion into the extrasynaptic space and the extracellular GABA concentration. As a result, the eEPSC amplitude was strongly decreased during nipecotic acid application in all studied SCN neurons. Recently we observed expression of GAT-3 and GAT-1 in the SCN that would limit the diffusion of GABA from synaptic cleft (Moldavan et al. 2012). GAT-1, -2 and -3 mRNA transcripts found within the neonatal and mature rat optic nerve also indicate the important role of GABA transporters (Howd et al. 1997). Because of a strong GABA uptake in the SCN, a high GABA concentration (EC50= 0.49 mm in the presence of picrotoxin) was required to block the eEPSC (Fig. 5). The half-maximal effective concentration of GABA in our experiments was much higher than that required to block Ca2+ transient in the trunk of the optic nerve (Sun & Chiu, 1999). This indicates an important role of synaptic and extrasynaptic GABA uptake in the vicinity of RHT terminals.
Despite the variability among SCN neurons, the average increase of eEPSC amplitude during CGP55845 application was similar during subjective day and night. This indicates a relatively stable endogenous GABA concentration around RHT terminals during the LD cycle that is maintained by the GABA uptake mechanism. CGP55845 blocking presynaptic GABABRs increased the initial Pr (eEPSC1 amplitude was on average increased to approximately 30% of control) and enhanced STD. In other words, the endogenous GABA activating presynaptic GABABRs decreased the initial Pr and relieved STD.
Conclusion
The GABA content in the SCN is higher during the day and lower at night (Cattabeni et al. 1978; Huhman et al. 1996). We demonstrated that despite this variation the average magnitude of the presynaptic tonic GABABR-mediated inhibition in RHT synapses did not change during the LD cycle. Considering our data, we propose a hypothesis that explains this paradox. The number of active GABAergic SCN neurons is higher during the day and their discharges are stronger than during the night. The possible role of GABAergic inputs to the SCN also could not be rejected. More GABA is released and accumulates in the extracellular space in certain locations in the SCN during the day than at night. As a result, the total GABA concentration in the SCN would increase. Owing to an increase of locations where GABA is released and spills over, the number of RHT inputs inhibited by endogenous GABA also increases. Despite the increased GABA release during the day, strong GABA uptake keeps the concentration of endogenous GABA in the vicinity of RHT terminals in these locations at a relatively consistent level during the LD cycle. Owing to this mechanism, GABABR-mediated tonic inhibition was observed in much smaller number (in ∼30–60%) of RHT inputs than those that express GABABRs, and could be activated by baclofen. Activity-dependent changes of RHT synaptic plasticity were generally dependent on the initial Pr that was defined by sensitivity of RHT terminals to GABABR agonists.
Acknowledgments
We thank Dr Viktor Derkach for advice concerning the data analysis. The work was supported by grant NS036607 from the National Institutes of Health.
Glossary
- 4-AP
4-aminopyridine
- eEPSC(s)
evoked EPSC(s)
- PPS
paired-pulse stimulation
- eEPSC1
first eEPSC during PPS or stimulus train application
- eEPSC2
second eEPSC during PPS or stimulus train application
- eEPSCn
successive eEPSC in the stimulus train
- GABAARs
GABAA receptors
- GABABRs
GABAB receptors
- ipRGCs
intrinsically photosensitive retinal ganglion cells
- LD cycle
light/dark cycle
- Pr
release probability
- PPR
paired-pulse ratio
- STD
short-term synaptic depression
- SCN
suprachiasmatic nucleus
- RHT
retinohypothalamic tract
- VDCCs
voltage-dependent Ca2+ channels
Author contributions
M.G.M. and C.N.A. conceived and designed the experiments, M.G.M. performed the electrophysiological experiments, collected, and analysed the data, M.G.M. and C.N.A. interpreted the data and wrote and revised the manuscript. The experiments were performed in the laboratory of C.N.A. at the Center for Research on Occupational and Environmental Toxicology, Oregon Health & Science University, Portland, OR, USA. All authors read and approved the final version of the manuscript.
References
- Aguilar-Roblero R, Verduzco-Carbajal L, Rodríguez C, Mendez-Franco J, Morán J, Perez de la Mora M. Circadian rhythmicity in the GABAergic system in the suprachiasmatic nuclei of the rat. Neurosci Lett. 1993;157:199–202. doi: 10.1016/0304-3940(93)90736-5. [DOI] [PubMed] [Google Scholar]
- Belenky MA, Yarom Y, Pickard GE. Heterogeneous expression of gamma-aminobutyric acid and gamma-aminobutyric acid-associated receptors and transporters in the rat suprachiasmatic nucleus. J Comp Neurol. 2008;506:708–732. doi: 10.1002/cne.21553. [DOI] [PubMed] [Google Scholar]
- Bertram R. Differential filtering of two presynaptic depression mechanisms. Neural Comput. 2001;13:69–85. doi: 10.1162/089976601300014637. [DOI] [PubMed] [Google Scholar]
- Binda F, Bossi E, Giovannardi S, Forlani G, Peres A. Temperature effects on the presteady-state and transport-associated currents of GABA cotransporter rGAT1. FEBS Lett. 2002;512:303–307. doi: 10.1016/s0014-5793(02)02271-8. [DOI] [PubMed] [Google Scholar]
- Brenowitz S, Trussell LO. Minimizing synaptic depression by control of release probability. J Neurosci. 2001;21:1857–1867. doi: 10.1523/JNEUROSCI.21-06-01857.2001. [DOI] [PMC free article] [PubMed] [Google Scholar]
- Brenowitz S, David J, Trussell LO. Enhancement of synaptic efficacy by presynaptic GABAB receptors. Neuron. 1998;20:135–141. doi: 10.1016/s0896-6273(00)80441-9. [DOI] [PubMed] [Google Scholar]
- Brody DL, Patil PG, Mulle JG, Snutch TP, Yue DT. Bursts of action potential waveforms relieve G-protein inhibition of recombinant P/Q-type Ca2+ channels in HEK 293 cells. J Physiol. 1997;499(Pt 3):637–644. doi: 10.1113/jphysiol.1997.sp021956. [DOI] [PMC free article] [PubMed] [Google Scholar]
- Brody DL, Yue DT. Relief of G-protein inhibition of calcium channels and short-term synaptic facilitation in cultured hippocampal neurons. J Neurosci. 2000;20:889–898. doi: 10.1523/JNEUROSCI.20-03-00889.2000. [DOI] [PMC free article] [PubMed] [Google Scholar]
- Castel M, Morris JF. Morphological heterogeneity of the GABAergic network in the suprachiasmatic nucleus, the brain's circadian pacemaker. J Anat. 2000;196:1–13. doi: 10.1046/j.1469-7580.2000.19610001.x. [DOI] [PMC free article] [PubMed] [Google Scholar]
- Cattabeni F, Maggi A, Monduzzi M, De Angelis L, Racagni G. GABA: circadian fluctuations in rat hypothalamus. J Neurochem. 1978;31:565–5667. doi: 10.1111/j.1471-4159.1978.tb02676.x. [DOI] [PubMed] [Google Scholar]
- Chen G, Van den Pol AN. Presynaptic GABAB autoreceptor modulation of P/Q-type calcium channels and GABA release in rat suprachiasmatic nucleus neurons. J Neurosci. 1998;18:1913–1922. doi: 10.1523/JNEUROSCI.18-05-01913.1998. [DOI] [PMC free article] [PubMed] [Google Scholar]
- Daan S, Pittendrigh CS. A functional analysis of circadian pacemakers in nocturnal rodents. J Comp Physiol A. 1976;106:267–290. [Google Scholar]
- Del Castillo J, Katz B. Quantal components of the end-plate potential. J Physiol. 1954;124:560–573. doi: 10.1113/jphysiol.1954.sp005129. [DOI] [PMC free article] [PubMed] [Google Scholar]
- Forsythe ID, Tsujimoto T, Barnes-Davies M, Cuttle MF, Takahashi T. Inactivation of presynaptic calcium current contributes to synaptic depression at a fast central synapse. Neuron. 1998;20:797–807. doi: 10.1016/s0896-6273(00)81017-x. [DOI] [PubMed] [Google Scholar]
- Fortune ES, Rose GJ. Short-term synaptic plasticity as a temporal filter. TINS. 2001;24:381–385. doi: 10.1016/s0166-2236(00)01835-x. [DOI] [PubMed] [Google Scholar]
- Gillespie CF, Mintz EM, Marvel CL, Huhman KL, Albers HE. GABAA and GABAB agonists and antagonists alter the phase-shifting effects of light when microinjected into the suprachiasmatic region. Brain Res. 1997;759:181–189. doi: 10.1016/s0006-8993(97)00235-7. [DOI] [PubMed] [Google Scholar]
- Gillespie CF, Van der Beek EM, Mintz EM, Mickley NC, Jasnow AM, Huhman KL, Albers HE. GABAergic regulation of light-induced c-Fos immunoreactivity within the suprachiasmatic nucleus. J Comp Neurol. 1999;411:683–692. [PubMed] [Google Scholar]
- Gordon TR, Kocsis JD, Waxman SG. Evidence for the presence of two types of potassium channels in the rat optic nerve. Brain Res. 1988;447:1–9. doi: 10.1016/0006-8993(88)90959-6. [DOI] [PubMed] [Google Scholar]
- Green DJ, Gillette R. Circadian rhythm of firing rate recorded from single cells in the rat suprachiasmatic brain slice. Brain Res. 1982;245:198–200. doi: 10.1016/0006-8993(82)90361-4. [DOI] [PubMed] [Google Scholar]
- Gribkoff VK, Pieschl RL, Dudek FE. GABA receptor-mediated inhibition of neuronal activity in rat SCN in vitro: Pharmacology and influence of circadian phase. J Neurophysiol. 2003;90:1438–1448. doi: 10.1152/jn.01082.2002. [DOI] [PubMed] [Google Scholar]
- Herlitze S, Zhong H, Scheuer T, Catterall WA. Allosteric modulation of Ca2+ channels by G proteins, voltage-dependent facilitation, protein kinase C, and Ca(v)beta subunits. Proc Natl Acad Sci U S A. 2001;98:4699–4704. doi: 10.1073/pnas.051628998. [DOI] [PMC free article] [PubMed] [Google Scholar]
- Howd AG, Rattray M, Butt AM. Expression of GABA transporter mRNAs in the developing and adult rat optic nerve. Neurosci Lett. 1997;235:98–100. doi: 10.1016/s0304-3940(97)00699-x. [DOI] [PubMed] [Google Scholar]
- Hu C, Hill DD, Wong KY. Intrinsic physiological properties of the five types of mouse ganglion-cell photoreceptors. J Neurophysiol. 2013 doi: 10.1152/jn.00579.2012. . DOI: 10.1152/jn.00579.2012. [DOI] [PMC free article] [PubMed] [Google Scholar]
- Huhman KL, Hennessey AC, Albers HE. Rhythms of glutamic acid decarboxylase mRNA in the suprachiasmatic nucleus. J Biol Rhythms. 1996;11:311–316. doi: 10.1177/074873049601100404. [DOI] [PubMed] [Google Scholar]
- Isaacson JS. GABAB receptor-mediated modulation of presynaptic currents and excitatory transmission at a fast central synapse. J Neurophysiol. 1998;80:1571–1576. doi: 10.1152/jn.1998.80.3.1571. [DOI] [PubMed] [Google Scholar]
- Jiang Z-G, Allen CN, North RA. Presynaptic inhibition by baclofen of retinohypothalamic excitatory synaptic transmission in rat suprachiasmatic nucleus. Neurosci. 1995;64:813–819. doi: 10.1016/0306-4522(94)00429-9. [DOI] [PubMed] [Google Scholar]
- Jobst EE, Allen CN. Calbindin neurons in the hamster suprachiasmatic nucleus do not exhibit a circadian variation in spontaneous firing rate. Eur J Neurosci. 2002;16:2469–2474. doi: 10.1046/j.1460-9568.2002.02309.x. [DOI] [PubMed] [Google Scholar]
- Kajikawa Y, Saitoh N, Takahashi T. GTP-binding protein beta gamma subunits mediate presynaptic calcium current inhibition by GABAB receptor. Proc Natl Acad Sci U S A. 2001;98:8054–8058. doi: 10.1073/pnas.141031298. [DOI] [PMC free article] [PubMed] [Google Scholar]
- Kim J, Alger BE. Random response fluctuations lead to spurious paired-pulse facilitation. J Neurosci. 2001;21:9608–9618. doi: 10.1523/JNEUROSCI.21-24-09608.2001. [DOI] [PMC free article] [PubMed] [Google Scholar]
- Lev-Tov A, Pinco M. In vitro studies of prolonged synaptic depression in the neonatal rat spinal cord. J Physiol. 1992;447:149–169. doi: 10.1113/jphysiol.1992.sp018996. [DOI] [PMC free article] [PubMed] [Google Scholar]
- Meijer JH, Watanabe K, Schaap J, Albus H, Détári L. Light responsiveness of the suprachiasmatic nucleus: Long-term multiunit and single-unit recordings in freely moving rats. J Neurosci. 1998;18:9078–9087. doi: 10.1523/JNEUROSCI.18-21-09078.1998. [DOI] [PMC free article] [PubMed] [Google Scholar]
- Millar AG, Bradacs H, Charlton MP, Atwood HL. Inverse relationship between release probability and readily releasable vesicles in depressing and facilitating synapses. J Neurosci. 2002;22:9661–9667. doi: 10.1523/JNEUROSCI.22-22-09661.2002. [DOI] [PMC free article] [PubMed] [Google Scholar]
- Moldavan MG, Allen CN. Retinohypothalamic tract synapses in the rat suprachiasmatic nucleus demonstrate short-term synaptic plasticity. J Neurophysiol. 2010;103:2390–2399. doi: 10.1152/jn.00695.2009. [DOI] [PMC free article] [PubMed] [Google Scholar]
- Moldavan MG, Irwin RP, Allen CN. Presynaptic GABAB receptors regulate retinohypothalamic tract synaptic transmission by inhibiting voltage-gated Ca2+ channels. J Neurophysiol. 2006;95:3727–3741. doi: 10.1152/jn.00909.2005. [DOI] [PubMed] [Google Scholar]
- Moldavan MG, Cravetchi OV, Allen CN. GABA transporter activity in the suprachiasmatic nucleus. Soc Neurosci Abs. 2012 536.19. [Google Scholar]
- Moore RY, Speh JC. GABA is the principal neurotransmitter of the circadian system. Neurosci Lett. 1993;150:112–116. doi: 10.1016/0304-3940(93)90120-a. [DOI] [PubMed] [Google Scholar]
- Morin LP, Blanchard JH, Moore RY. Intergeniculate leaflet and suprachiasmatic nucleus organization and connections in the hamster. Vis Neurosci. 1992;8:219–230. doi: 10.1017/s095252380000287x. [DOI] [PubMed] [Google Scholar]
- Novak CM, Ehlen JC, Huhman KL, Albers HE. GABAB receptor activation in the suprachiasmatic nucleus of diurnal and nocturnal rodents. Brain Res Bull. 2004;63:531–535. doi: 10.1016/j.brainresbull.2004.05.001. [DOI] [PubMed] [Google Scholar]
- Ong J, Kerr DI. The gamma-aminobutyric acid uptake inhibitor NO-711 potentiates 3-aminopropylphosphinic acid-induced actions in rat neocortical slices. Eur J Pharmacol. 1998;347:197–200. doi: 10.1016/s0014-2999(98)00175-7. [DOI] [PubMed] [Google Scholar]
- Pickard GE, Ralph MR, Menaker M. The intergeniculate leaflet partially mediates effects of light on circadian rhythms. J Biol Rhythms. 1987;2:35–56. doi: 10.1177/074873048700200104. [DOI] [PubMed] [Google Scholar]
- Pickard GE, Smith BN, Belenky M, Rea MA, Dudek FE, Sollars PJ. 5-HT1B receptor-mediated presynaptic inhibition of retinal input to the suprachiasmatic nucleus. J Neurosci. 1999;19:4034–4045. doi: 10.1523/JNEUROSCI.19-10-04034.1999. [DOI] [PMC free article] [PubMed] [Google Scholar]
- Ralph MR, Menaker M. GABA regulation of circadian responses to light. I. Involvement of GABAA-benzodiazepine and GABAB receptors. J Neurosci. 1989;9:2858–2865. doi: 10.1523/JNEUROSCI.09-08-02858.1989. [DOI] [PMC free article] [PubMed] [Google Scholar]
- Schaap J, Bos NPA, De Jeu MTG, Geurtsen AMS, Meijer JH, Pennartz CMA. Neurons of the rat suprachiasmatic nucleus show a circadian rhythm in membrane properties that is lost during prolonged whole-cell recording. Brain Res. 1999;815:154–166. doi: 10.1016/s0006-8993(98)01025-7. [DOI] [PubMed] [Google Scholar]
- Sollars PJ, Ogilvie MD, Simpson AM, Pickard GE. Photic entrainment is altered in the 5-HT1B receptor knockout mouse. J Biol Rhythms. 2006;21:1–12. doi: 10.1177/0748730405283765. [DOI] [PubMed] [Google Scholar]
- Sun BB, Chiu SY. N-type calcium channels and their regulation by GABAB receptors in axons of neonatal rat optic nerve. J Neurosci. 1999;19:5185–5194. doi: 10.1523/JNEUROSCI.19-13-05185.1999. [DOI] [PMC free article] [PubMed] [Google Scholar]
- Takahashi T, Kajikawa Y, Tsujimoto T. G-Protein-coupled modulation of presynaptic calcium currents and transmitter release by a GABAB receptor. J Neurosci. 1998;18:3138–3146. doi: 10.1523/JNEUROSCI.18-09-03138.1998. [DOI] [PMC free article] [PubMed] [Google Scholar]
- Wong KY. A retinal ganglion cell that can signal irradiance continuously for 10 hours. J Neurosci. 2012;32:11478–11485. doi: 10.1523/JNEUROSCI.1423-12.2012. [DOI] [PMC free article] [PubMed] [Google Scholar]
- Wu ZZ, Li DP, Chen SR, Pan HL. Aminopyridines potentiate synaptic and neuromuscular transmission by targeting the voltage-activated calcium channel beta subunit. J Biol Chem. 2009;284:36453–36461. doi: 10.1074/jbc.M109.075523. [DOI] [PMC free article] [PubMed] [Google Scholar]
- Yananli HR, Terzioglu B, Goren MZ, Aker RG, Aypak C, Onat FY. Extracellular hypothalamic gamma-aminobutyric acid (GABA) and L-glutamic acid concentrations in response to bicuculline in a genetic absence epilepsy rat model. J Pharmacol Sci. 2008;106:301–309. doi: 10.1254/jphs.fp0071709. [DOI] [PubMed] [Google Scholar]
- Zucker RS, Regehr WG. Short-term synaptic plasticity. Annu Rev Physiol. 2002;64:355–405. doi: 10.1146/annurev.physiol.64.092501.114547. [DOI] [PubMed] [Google Scholar]