

Abstract
NMDA receptor-dependent, intrinsic membrane potential oscillations are an important element in the operation of the lamprey locomotor network. They involve a cyclic influx of calcium, leading to an activation of calcium-activated potassium (KCa) channels that in turn contributes to the termination of the depolarized plateau and membrane repolarization. In this study, we have investigated the calcium dynamics in different regions of lamprey spinal neurons during membrane potential oscillations, using confocal calcium imaging in combination with intracellular recordings. Calcium fluctuations were observed in both soma and dendrites, timed to the oscillations. The calcium level increased sharply at the onset of membrane depolarization, to reach its maximum by the end of the plateau. The calcium peak in distal dendrites typically occurred earlier than in the soma during the oscillatory cycle. The L-type calcium channel blocker nimodipine increased the duration of the depolarized plateau phase in most cells tested, whereas the agonist Bay K 8644 decreased plateau duration. Bay K 8644 increased the amplitude of calcium fluctuations, particularly in distal dendrites, whereas nimodipine caused a decrease, suggesting that L-type low-voltage-activated calcium channels are mainly localized in these regions. Our results thus indicate that dendritic CaV1.3-like calcium channels are activated during NMDA-mediated membrane potential oscillations. This calcium influx activates KCa channels involved in plateau termination.
Key points
Intrinsic NMDA-induced oscillations of membrane potential are important for the operation of the spinal locomotor network in the lamprey, and involve a cyclic influx of calcium.
The spatial and temporal calcium dynamics during oscillations were investigated, using calcium imaging combined with intracellular recordings.
Calcium fluctuations were observed in both soma and dendrites, timed to the membrane potential oscillations, with the peak in distal dendritic locations typically occurring earlier than in the soma.
The L-type calcium channel antagonist nimodipine prolonged the plateau phase of membrane potential oscillations, whereas the agonist Bay K 8644 shortened the plateau. Bay K 8644 also increased the amplitude of calcium fluctuations, particularly in distal dendrites. On the contrary, nimodipine decreased calcium fluctuation amplitudes.
Low-voltage-activated L-type (CaV1.3-like) calcium channels at distal dendrites are activated during membrane potential oscillations. The resulting calcium influx contributes to the activation of calcium-activated potassium channels and thereby the control of the plateau duration during oscillations.
Introduction
NMDA receptor-dependent membrane potential oscillations occur in lamprey spinal neurons even after a blockade of Na+ channels with tetrodotoxin (Wallén & Grillner, 1987). These oscillations also appear to play an important role during fictive locomotion in the lamprey. The oscillations range between approximately −70 and −40 mV, and the underlying ionic mechanisms have been elucidated to a large extent (Grillner & Wallén, 1985; Wallén & Grillner, 1987; Grillner, 2003). At the onset of the depolarizing phase of the NMDA-induced oscillations, calcium will enter the cell both via NMDA channels and via voltage-gated calcium channels, primarily of the low-voltage-activated (LVA) type. During the plateau phase, voltage-dependent K+ channels contribute to setting the plateau level (Grillner & Wallén, 1985; Wallén & Grillner, 1987), and the calcium that accumulates will subsequently activate calcium-dependent potassium (KCa) channels, which contribute to maintenance of the plateau (by preventing further depolarization) and to the subsequent repolarization (El Manira et al. 1994; Grillner et al. 2001; see also Alpert & Alford, 2011).
The oscillations involve a cyclic influx of calcium (Viana Di Prisco et al. 2001; cf. Bacskai et al. 1995). The spatial and temporal calcium dynamics during the oscillatory process, including the sources of calcium influx along the soma–dendritic membrane have, however, not been explored in detail. To gain further insight into this central aspect of the cellular mechanisms underlying rhythm generation in the lamprey locomotor network, we have used live-cell confocal calcium imaging in combination with intracellular recordings from the same neuron in the isolated lamprey spinal cord preparation. Targeted measurements of the local calcium fluorescence in different portions of the neuron revealed that calcium fluctuations were most prominent in distal dendrites, followed by proximal dendrites and the soma. In general, the peak of the calcium oscillation in distal dendrites occurred at an earlier phase of the cycle than the peak in the soma.
To investigate the role of LVA-type calcium channels, and in particular the L-subtype CaV1.3 (Koschak et al. 2001), we also performed pharmacological experiments in combination with calcium imaging and intracellular recordings of membrane potential oscillations. The results indicate that CaV1.3-like calcium channels contribute to the calcium influx during NMDA-induced oscillations, and that they may be primarily localized to distal dendrites. Parts of these findings have previously been presented in abstract form (Wang et al. 2008, 2009).
Methods
Ethical approval
All experimental procedures were approved by Stockholm Norra Försöksdjursetiska Nämnd, according to the Swedish regulations for the care and use of laboratory animals. Upon removal of the tissue, the animals were killed by decapitation while still deeply anaesthetized (MS-222, tricaine methane sulphonate, 100 mg l−1, dissolved in water; Sigma, St Louis, MO, USA).
In vitro lamprey spinal cord preparation
Experiments were performed using isolated spinal cord preparations of the lamprey (Lampetra fluviatilis; n= 20). A spinal cord piece comprising eight to 14 segments was dissected from a region caudal to the gills. The spinal cord (thickness ∼300 μm) was isolated from the notochord and placed with the ventral side up into a Sylgard-lined (Dow Corning, Midland, MI, USA) microscope chamber that had a coverslip as its bottom. The chamber was continuously perfused with oxygenated lamprey physiological solution containing (mm): 138 NaCl, 2.1 KCl, 1.8 CaCl2, 1.2 MgCl2, 4 glucose, 2 Hepes and 0.5 l-glutamine, bubbled with O2 and adjusted to pH 7.4 with NaOH. The microscope stage and experimental chamber were cooled to maintain the preparation at 4–10°C.
Pharmacological experiments
Drugs used were NMDA (Tocris, Bristol, UK), TTX (Sigma), the L-type calcium channel antagonist nimodipine (1,4-dihydro-2,6-dimethyl-4- (3-nitrophenyl)-3,5-pyridine dicarboxylic acid 2-methyloxyethyl 1-methylethyl ester; Tocris) and the L-type calcium channel agonist Bay K 8644 (1,4-dihydro-2,6-dimethyl-5-nitro-4-(2-(trifluoromethyl) phenyl) pyridine-3-carboxylic acid methyl ester; Sigma). Nimodipine and Bay K 8644 were prepared immediately prior to bath application in 10 and 1 mm stock solutions with ethanol and then diluted to 10 and 2 μm, respectively, in physiological solution. Control experiments revealed that the amount of ethanol used to dissolve nimodipine and Bay K 8644 did not affect cellular or synaptic properties (Wikström & El Manira, 1998; Krieger et al. 1999).
Electrophysiology
To induce NMDA receptor-dependent, TTX-resistant oscillations, NMDA (150 μm) and TTX (1.5 μm) were added in the physiological solution (Wallén & Grillner, 1987). For intracellular recordings, sharp microelectrodes were filled with 3 m potassium acetate and 0.1 m KCl (resistance 30–50 MΩ), and with 5 mm fluo-4 pentapotassium salt (Molecular Probes, Invitrogen, Eugene, OR, USA) for calcium imaging experiments. Cells were recorded in current-clamp mode using an Axoclamp 2B amplifier (Molecular Devices, Sunnyvale, CA, USA), and all experiments were performed in discontinuous current-clamp mode. The general membrane potential level was maintained constant by injection of direct current when needed. Intracellular injection of the fluo-4 calcium indicator was accomplished by using pressure pulses and/or iontophoresis by applying negative direct current of 1–2 nA for periods of up to 30 min, until fluorescence was detectable in dendrites. In some cases, recorded cells could be identified as motoneurons, using morphological criteria, while the other recorded cells were considered ‘motoneuron like’, based on the size, shape and location of the soma.
Confocal laser scanning microscopy and calcium imaging
Live imaging of calcium dynamics was performed on a Zeiss LSM 510 NLO microscope system (Carl Zeiss, Jena, Germany) adapted for simultaneous electrophysiological recordings. After intracellular injection of fluo-4 from the recording microelectrode, membrane potential oscillations were induced by addition of NMDA–TTX and recorded during simultaneous imaging using the 488 nm line of an argon laser for fluorophore excitation. Imaging was typically performed with a ×40 water-dipping objective (NA 0.8) at 8 frames s−1. Focus was adjusted to allow imaging of the soma/proximal dendrites and of distal dendrites, respectively, of the same neuron. For high-speed imaging, fast line scanning (500 Hz) was performed over preselected parts of the cell.
For time synchronization of acquired images and recorded membrane potential oscillations, marker pulses indicating the occurrence of each frame were obtained from the imaging system and recorded together with the intracellular signal using pClamp software (Axon Instruments Inc.). Time series of images were acquired and stored using LSM software (Carl Zeiss). Time course plots were generated by averaging the pixel intensities within several regions of interest (ROIs) for successive images. The recorded intensity signals are presented as relative changes of fluorescence in each of the selected ROIs and expressed as arbitrary units rather than being normalized to baseline, because a true measure of baseline fluorescence, taken when the cell was at rest in the absence of oscillatory activity, was not performed. All investigated cells were first brought to their oscillatory state by the application of NMDA and TTX, and most often by slight adjustment of the membrane potential by direct current injection (cf. Wallén & Grillner, 1987), before imaging of calcium fluorescence was started in parallel with the recording of the oscillating membrane potential.
Analysis
All imaging data were analysed under LSM 510 (Carl Zeiss) and Spike2 (Cambridge Electronic Design, Cambridge, UK) software protocols. Each cycle average trace was compiled from from at least 10 cycles of recording, with the peak of the membrane potential oscillation used as the cycle origin. The cycle average is represented as a continuous line with ±SEM represented as dotted lines. The timing of the calcium signal from each ROI in relation to the membrane potential recording was adjusted with respect to the position of the ROI within the image frame as well as to the frame rate.
Results
Localized imaging of calcium dynamics during NMDA-induced membrane potential oscillations
In the first set of experiments, we investigated the occurrence of calcium fluctuations at different soma–dendritic locations in lamprey spinal neurons during NMDA-induced membrane potential oscillations, using confocal laser scanning microscopy combined with intracellular current-clamp recordings. Both 150 μm NMDA and 1.5 μm TTX were bath applied to the isolated lamprey spinal cord preparation to induce membrane potential oscillations, sometimes with the addition of minor negative or positive direct current injection (Grillner & Wallén, 1985). To allow imaging of calcium dynamics in different locations of the cell, the focus was adjusted to the soma/proximal dendrite level and the distal dendrites, respectively, of the same neuron. The focal distance between these two levels varied between ∼40 and 80 μm. Recorded cells were either morphologically identified motoneurons or were ‘motoneuron like’ (see Methods). Fluctuations of fluorescence intensity in different selected ROIs were analysed off-line throughout the time series of recorded images.
In all of 16 neurons tested, calcium fluctuations were observed both in the soma/proximal dendrite regions and in distal dendrites of the cell, timed to the membrane potential oscillations (Fig. 1). Comparatively small calcium oscillations were observed at the soma level in two locations, in synchrony with the membrane potential oscillations (Fig. 1A), while the calcium oscillations increased in amplitude in the proximal dendrites (Fig. 1B), to become largest in the six different distal dendritic locations (Fig. 1C). Similar results were obtained in all cells (n= 16).
Figure 1. Live imaging of calcium dynamics during NMDA oscillations.
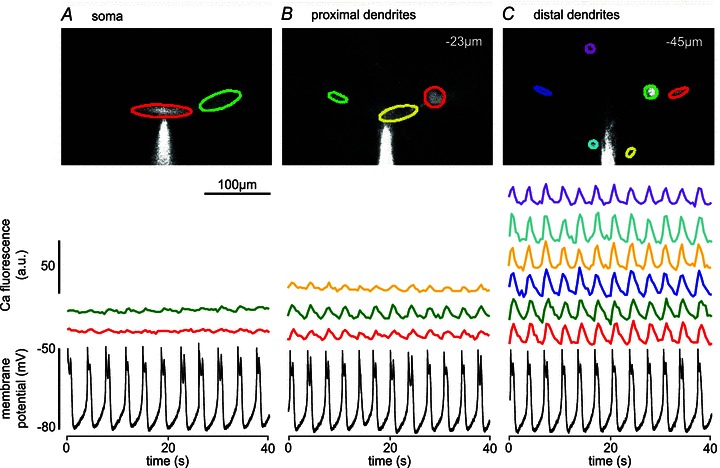
Calcium fluorescence fluctuations in several regions of interest (ROIs; different colours) of the soma (A), proximal dendrites (B) and distal dendrites (C) of the same lamprey spinal cord neuron in the presence of NMDA (150 μm) and TTX (1.5 μm), plotted together with simultaneously recorded membrane potential oscillations (bottom traces). During NMDA-induced membrane potential oscillations, calcium fluctuations were detected in all analysed regions of the neuron, and they were more prominent in distal dendrites than in proximal dendrites and the soma. The vertical scale bar in A, indicating relative fluorescence intensity (a.u., arbitrary units in this and subsequent figures), applies to all ROI traces in A–C. Traces of fluorescence intensity fluctuations were not normalized to baseline fluorescence (this applies to all figures; see Methods).
Timing of calcium fluctuations in dendrites and soma, in relation to membrane potential oscillations
In order to investigate the temporal dynamics of the calcium fluctuations further during NMDA-induced oscillations, we also used fast line scanning (500 Hz) over preselected parts of the cell (n= 6). Figure 2A shows one example of fast line scanning over two distal dendrites of the same neuron. The distance between these two dendritic ROIs was about 100 μm. The calcium fluctuations at the two dendritic locations were time locked with the membrane potential oscillations and they were also synchronous, as seen in the cycle averages illustrated in Fig. 2B. Following the sharp rise of the membrane potential, the calcium level continued to increase during the depolarized plateau phase of the membrane potential oscillation, to reach its maximum by the end of the plateau. The time of occurrence of the calcium peak during the cycle was the same irrespective of whether high-speed line scanning or frame scanning was performed. Frame scanning was therefore used for the subsequent analysis.
Figure 2. Fast line scanning over distal dendrites during NMDA oscillations.
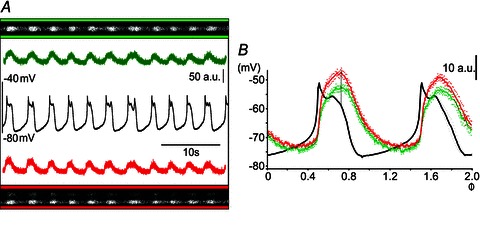
A, portions of two different distal dendrites (the distance between them was about 100 μm) from the same neuron were line scanned at 500 Hz. Fluctuations in the brightness of the fluorescence of the two dendritic portions (green and red) are displayed over time, together with simultaneously recorded NMDA-induced membrane potential oscillations. B, timing of calcium fluctuations in the two distal dendritic portions, in relation to the NMDA membrane potential oscillations. Traces are the averages over two cycles from the records in A, using the peak of the membrane potential oscillation as the origin (set as phase value Φ= 0.5). Timed with the onset of membrane depolarization, calcium levels increase sharply to reach the maximum by the end of the depolarized plateau, synchronously in the two dendritic locations in this case. At this time, the activation of calcium-activated potassium (KCa) channels and the closure of NMDA channels will terminate the plateau, and the membrane potential will again hyperpolarize.
To compare the timing of calcium fluctuations in different parts of the neuron, cycle averages were made of the calcium fluctuations at different soma–dendritic locations, in relation to the averaged membrane potential oscillation cycle (see Methods). Figure 3A shows the average calcium fluctuations in different compartments of the same cell, in relation to the peak of the membrane potential oscillation. The calcium fluctuation in the soma (bottom, black trace) peaks at around the end of the depolarized plateau of the membrane potential oscillation, while the calcium peaks in several different ROIs at distal dendritic locations (ROIs 1–8) occurred before or simultaneously with the peak in the soma. The average of the peak phase values at these eight ROIs occurred significantly earlier in the cycle than the peak phase value in the soma (0.64 vs. 0.68; P < 0.05; one-sample t test). Also, the onset of the calcium rise started significantly earlier in the distal dendrites than in the soma (0.38 vs. 0.43; P < 0.001). Figure 3B illustrates corresponding calcium measurements from another neuron; here, the average of the calcium peaks in 10 ROIs at distal dendrites occurred at a significantly earlier phase in the cycle than in the soma (0.66 vs. 0.78; P < 0.001), as did the onset of the calcium rise (0.34 vs. 0.37; P < 0.001). In the cell illustrated in Fig. 3C, the membrane potential oscillations had a broader depolarized plateau phase, and the calcium fluctuations were more heterogeneous. The calcium oscillations in the soma also had a broader peak, with two maxima in the cycle average. At two of the distal dendritic locations recorded from in this cell (ROIs 4 and 5), the calcium fluctuations peaked at around the sharp onset of the depolarized plateau of the membrane potential oscillation and well before the first maximum of the calcium oscillation in the soma. The calcium fluctuations at three other distal dendritic locations (ROIs 1–3) peaked later during the plateau depolarization, in between the maxima of the somatic calcium peak.
Figure 3. Timing of calcium fluctuations during NMDA-induced membrane potential oscillations.

Cycle averages of calcium fluctuations in distal dendrites during NMDA-induced membrane potential oscillations; records from three representative neurons (A–C). Each continuous trace is the average of at least 10 cycles of membrane potential and calcium fluorescence fluctuations (dashed traces are ±SEM), and has been plotted with respect to the peak of the membrane potential oscillation (vertical interrupted lines; set as origin, phase value Φ= 0.5). A, the average of the calcium peaks at eight different dendritic ROIs (indicated by vertical short lines) occurred significantly earlier in the cycle than the peak phase value in the soma (indicated by vertical dashed line; 0.64 vs. 0.68; *P < 0.05; one-sample t test). The onset of the calcium rise also started significantly earlier in the distal dendrites (vertical lines) than in the soma (vertical dashed line; 0.38 vs. 0.43; ***P < 0.001). Same cell as in Figs 1 and 2. B, another neuron, where the average of the calcium peaks in 10 ROIs at distal dendrites occurred at a significantly earlier phase in the cycle than in the soma (0.66 vs. 0.78; ***P < 0.001), as did the onset of the calcium rise (0.34 vs. 0.37; ***P < 0.001). C, a cell with a broad depolarization phase, showing a correspondingly broad calcium oscillation in the soma, with two peaks detectable, and with dendritic calcium fluctuations peaking early as well as late during the depolarized plateau phase. Scale bars for fluorescence intensities are indicated to the left of all ROI traces in A–C, with the same unit value being valid for the trace with the short vertical arrow and all traces above.
Figure 4 summarizes the analysis of the timing of calcium fluctuations, and shows that the calcium peaks in distal dendrites (black dots) occurred earlier than in the soma (crosses) in five out of six cells, and that the soma peaks occurred towards the end of the plateau phase.
Figure 4. Summary of timing analysis of calcium fluctuations in distal dendrites and soma, in relation to the membrane potential oscillation.
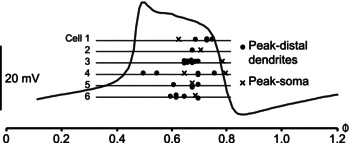
In five of six tested neurons (nos 2–6) the peak calcium fluctuation in distal dendrites (filled circles) occurred at an earlier phase than the calcium peak measured at the soma (crosses). In one cell, two peaks of the somatic calcium fluctuation could be discerned (cell 4; same as in Fig. 3C).
Involvement of L-type, CaV1.3-like Ca2+ channels during NMDA-induced membrane potential oscillations
During NMDA-induced oscillations, calcium will enter the cell via voltage-activated calcium channels, as well as via NMDA-receptor channels (Wallén & Grillner, 1987; cf. Bacskai et al. 1995; Viana Di Prisco et al. 2001). With the membrane potential oscillations occurring between approximately −70 to −40 mV, primarily LVA calcium channels will be activated, in contrast to high-voltage-activated (HVA) calcium channels.
Lamprey spinal neurons possess L-type LVA calcium channels (CaV1.3 like), which contribute to the postinhibitory rebound depolarization following a period of inhibition/hyperpolarization (Wang et al. 2011). We therefore investigated the involvement of L-type LVA calcium channels during NMDA-induced membrane potential oscillations, and first observed the effects of both its antagonist nimodipine and the agonist Bay K 8644. In 13 of 20 neurons tested, nimodipine (10 μm) prolonged the membrane potential oscillation plateaus (Fig. 5A and B), presumably due to a less efficient activation of KCa channels and a delayed onset of repolarization (El Manira et al. 1994). In the remaining seven neurons, the oscillations decreased in amplitude and frequency and deteriorated (Fig. 5C), and tended to cease at the hyperpolarized potential level. This latter effect of L-type channel blockade may reflect a larger contribution of calcium to the depolarizing current of the oscillations that was apparent in this subset of tested neurons.
Figure 5. Effects of the L-type calcium channel antagonist nimodipine (Nimo) and the agonist Bay K 8644 (BayK) on NMDA-induced membrane potential oscillations.
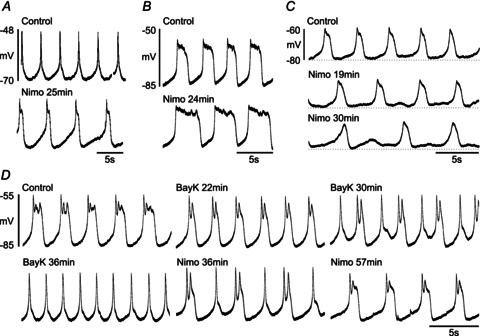
A–C illustrate effects of nimodipine in three different neurons. A and B show examples of spike-like and plateau-like oscillations, respectively. In both cases, nimodipine (10 μm) caused a prolongation of the depolarized phase. C, after nimodipine (10 μm), the NMDA-induced oscillations were reduced in amplitude and tended to cease at the hyperpolarized potential level. D, continuous recording from one neuron in one trial. The depolarized plateau phase of the oscillation was first shortened by Bay K 8644 (2 μm) and was then prolonged by nimodipine (10 μm).
We also tested the effect of the L-type channel agonist Bay K 8644 on the membrane potential oscillations, either alone or in combination with nimodipine. Figure 5D illustrates one example, where Bay K 8644 first decreased the plateau duration of the NMDA-induced oscillations to become more spike like. This was counteracted by nimodipine, which increased the plateau duration (n= 8). This suggests that an enhanced calcium entry via L-type channels, caused by Bay K 8644, will lead to a more prominent and earlier activation of KCa channels that then terminates the plateau.
NMDA-induced membrane potential oscillations commonly have a clear depolarized plateau phase (see, e.g. Fig. 5B and D, control), but they may also appear more ‘spike like’, without a plateau phase (Fig. 5A, control). Interestingly, as illustrated in Fig. 5A, nimodipine may cause a transition from the ‘spike-like’ appearance to ‘plateau-like’ oscillations. Correspondingly, Bay K 8644 may cause a transition in the opposite direction (Fig. 5D).
Effects of Bay K 8644 and nimodipine on calcium fluctuations
In order to study further the participation of CaV1.3-like, L-type calcium channels during NMDA-induced oscillations and the spatial distribution of these channels, we performed calcium imaging combined with simultaneous intracellular recordings and tested the effects of bath-applied Bay K 8644 and nimodipine. We focused on different compartments of the neuron and observed changes in calcium fluctuations in the presence of the two drugs.
In the neuron of Fig. 6, Bay K 8644 markedly increased the amplitude of the calcium fluctuation in four ROIs of distal dendrites (Fig. 6A), as well as in two ROIs of proximal dendrites (Fig. 6B), albeit to a smaller degree. No clear change could, however, be observed in the region of the soma (Fig. 6B). Concomitant with the increase in calcium entry, a clear shortening of the membrane potential plateau was seen (Fig. 6A and B; cf. Fig. 5). An increase of the calcium oscillation amplitude in the presence of Bay K 8644 was seen in all of the five tested neurons (Fig. 6C; P < 0.05). The augmenting effect of Bay K 8644 indicates that L-type calcium channels contributed to a substantial fraction of the total calcium influx measured in the selected ROIs, particularly in distal dendrites.
Figure 6. Augmenting effect of Bay K 8644 on calcium fluctuation amplitude.
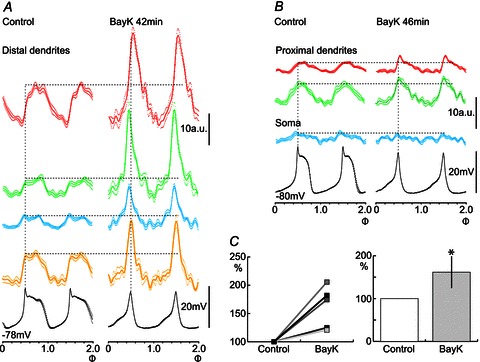
Calcium fluorescence imaging from four ROIs of distal dendrites (A) and three ROIs of proximal dendrites (red and green) and the soma (blue ROI; B), all in the same neuron (a motoneuron in this case). After Bay K 8644, the amplitude of calcium fluctuations was markedly increased in all four ROIs of distal dendrites, and with a slightly increased amplitude in proximal dendrites, but not in the soma. Concomitantly, the membrane potential oscillation plateau duration was dramatically decreased. C, calcium fluctuation amplitudes were increased in the presence of Bay K 8644 in all cells tested (n= 5; *P < 0.05, Student′s unpaired t test).
In the neuron illustrated in Fig. 7A, application of nimodipine caused, as described in the previous subsection, a prolongation of the membrane potential plateau (Fig. 7A), and a decrease in the amplitude of calcium oscillations could be seen in distal dendrites (Fig. 7A1). A decrease of the calcium fluctuation amplitude with nimodipine was seen at distal dendritic locations in all of the nine tested neurons (Fig. 7C; P < 0.01), again indicating that L-type calcium channels contribute to a substantial fraction of the total calcium influx in the selected ROIs where an amplitude decrease was seen (see, however, next paragraph). As exemplified in Fig. 5C, nimodipine may also reduce the amplitude and frequency of the NMDA-induced membrane potential oscillations. A corresponding reduction in the amplitude and frequency of calcium fluctuations was found in three neurons (not illustrated).
Figure 7. Effects of nimodipine on calcium fluctuation amplitudes in different locations along individual distal dendrites.
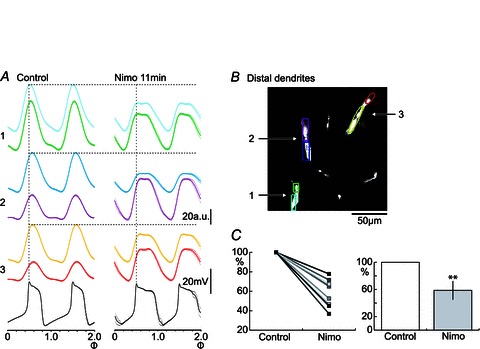
A, cycle averages of calcium fluctuations in six ROIs of three distal dendrites from the same spinal neuron, each dendrite with two separate ROIs as indicated in B. After nimodipine (10 μm), calcium fluctuation amplitudes decreased in both ROIs of dendrite no. 1 (light blue and green), while in the other two recorded dendrites (nos 2 and 3), effects were opposite in the two ROIs. C, a decrease in amplitude of the calcium fluctuation following nimodipine application was seen in all cells tested (n= 9; **P < 0.01, Student′s unpaired t test).
We also analysed and compared the effects of nimodipine on calcium fluctuations in different dendrites from the same neuron. In addition to the decrease in the amplitude of calcium fluctuations described above, a subset of the dendrites could instead show an increase. We even separated the calcium signal from a single dendrite by using two adjacent ROIs for analysis. As illustrated in Fig. 7A and B, two closely located subregions within a single dendrite could show opposite effects upon nimodipine application, with one increasing and the other decreasing in calcium fluctuation amplitude (dendrite 2 with a purple and a dark blue ROI, and dendrite 3 with a yellow and a red ROI). These results may indicate a non-uniform distribution of L-type (CaV1.3-like) calcium channels, and may also reflect complex local interactions between different types of ion channels and other membrane properties in distal dendrites. The nature of such interactions remains unclear at present (see also Discussion).
Discussion
In the present study, we have examined the spatial and temporal characteristics of calcium dynamics during NMDA-induced membrane potential oscillations in single lamprey spinal neurons by using confocal calcium imaging in combination with intracellular recordings of membrane potential. We have also investigated the contribution of L-type (CaV1.3-like) calcium channels to the NMDA-induced membrane oscillations and the accompanying calcium fluctuations. The main findings are as follows: (i) calcium fluctuations occur in both the soma/proximal dendritic regions and in distal dendrites, timed to the NMDA-induced membrane potential oscillations; (ii) calcium fluctuations are more prominent in distal dendrites than in proximal dendrites and the soma; (iii) the timing of the calcium peak in distal dendrites typically occurred at an earlier phase in the oscillation cycle than the peak measured at the soma, and the timing among different distal dendrites in the same neuron could differ substantially or be synchronous; (iv) CaV1.3-like, L-type calcium channels are activated during NMDA-mediated membrane potential oscillations, and contribute to the termination of the plateau phase; (v) these calcium channels appear to be located primarily in distal dendritic regions (see Fig. 6); and (vi) these channels presumably have a non-uniform distribution along the dendritic membrane.
Spatial and temporal characteristics of calcium dynamics during NMDA-induced membrane potential oscillations
Periodic fluctuations of calcium concentration, timed to the NMDA-induced membrane potential oscillations, were detected in all regions of the neuron. The finding that the calcium fluctuations were more prominent in distal dendrites than in proximal dendrites and the soma is in accord with previous findings of a larger increase in calcium concentration in distal dendrites (levels reaching up to 450 nm) during NMDA-induced fictive locomotion in the lamprey spinal cord (Viana Di Prisco & Alford, 2004). The local fluctuations of calcium in distal dendritic regions may thus be substantial, and are therefore likely to play a significant role in the generation of the NMDA-induced membrane potential oscillations. Notably, the calcium entering during the depolarizing phase will activate KCa channels, which then leads to membrane repolarization and cessation of the depolarized plateau (Wallén & Grillner, 1987; El Manira et al. 1994). Correspondingly, the calcium level increased during the depolarized phase to reach its maximum by the end of the plateau (cf. Fig. 2).
The peak of the calcium oscillation in distal dendrites in general occurred earlier in the oscillation cycle than the peak measured at the soma (Figs 3 and 4), and likewise, the onset of the oscillation tended to occur earlier in distal dendrites (Fig. 3). This indicates that the calcium oscillations may often start in distal dendritic regions, and are then propagated as a calcium wave towards the soma. Furthermore, the timing of the calcium fluctuations in different distal dendritic regions was not always synchronous, but could differ by at least 10% of the oscillatory cycle. This may suggest that different portions of the dendritic tree could act in a partly independent manner and contribute to different aspects of the oscillatory trajectory (cf. Fig. 3).
Contribution of L-type calcium channels (CaV1.3 like) to NMDA-induced membrane potential oscillations in lamprey spinal neurons
The calcium influx during NMDA-induced membrane potential oscillations occurs via both NMDA-receptor channels and voltage-gated calcium channels (Wallén & Grillner, 1987; cf. Bacskai et al. 1995; Viana Di Prisco et al. 2001; Alpert & Alford, 2011). Both LVA- and HVA-type calcium channels are present in lamprey spinal cord neurons (Matsushima et al. 1993); however, with the oscillations ranging between approximately −70 and −40 mV, primarily LVA-type calcium channels will contribute. The HVA-type calcium channels are mainly activated at more depolarized membrane potentials, above this range (around –30 mV and above; Matsushima et al. 1993; see also Hille, 2001; Lipscombe et al. 2004). Here, we have focused on the involvement of L-type LVA channels, notably the CaV1.3 subtype (cf. Koschak et al. 2001; Lipscombe et al. 2004). This calcium channel subtype has recently been shown to contribute to the postinhibitory rebound depolarization in motoneurons and commissural interneurons in the lamprey spinal cord (Wang et al. 2011; cf. Matsushima et al. 1993; Tegnér et al. 1997). L-Type calcium channels are encoded by CaV1 genes and include four different subtypes, referred to as CaV1.1–CaV1.4 (Catterall, 2000; Lipscombe et al. 2004). The HVA CaV1.2 and LVA CaV1.3 subtypes are expressed in the central nervous system, including the spinal cord (Hell et al. 1993; Ludwig et al. 1997; Lipscombe et al. 2004). Thus, the LVA CaV1.3 subtype is the one relevant here. It may be noted, however, that the existence of a variant of the CaV1.2 subtype, activating at more negative membrane potentials (cf. Catterall et al. 2005), in lamprey spinal cord neurons cannot be excluded, because the molecular identity of these channel subtypes, established in mammals, has not been determined in the lamprey. Therefore, the term ‘CaV1.3 subtype’ is here being used with the broader meaning ‘CaV1.3-like subtype’ for the L-type LVA channels investigated [see also Simon et al. 2003 (turtle); Sheets et al. 2012 (zebrafish); and Wang et al. 2011 (lamprey)].
The distribution of Ca2+ channel subtypes in the soma, proximal and distal dendrites of spinal neurons has not yet been analysed in the lamprey. L-Type Ca2+ channels have been shown to be located preferentially in dendrites of mouse spinal motoneurons (Carlin et al. 2000). For CaV1.3 L-type calcium channels, mainly dendritic localizations have been reported in spinal motoneurons of the turtle (Simon et al. 2003) and the mouse (Carlin et al. 2000), and primarily somatic and proximal dendritic localizations in spinal neurons of the rat (Westenbroek et al. 1998; Sukiasyan et al. 2009) and the cat (Zhang et al. 2006, 2008). Dendritic L-type calcium channels in spinal motoneurons, and notably the CaV1.3 subtype, have been implicated in the generation of plateau potentials and membrane bistability, as well as in the amplification of synaptic input (e.g. Hounsgaard & Kiehn, 1989; Carlin et al. 2000; Simon et al. 2003; Zhang et al. 2006; Sukiasyan et al. 2009).
The present findings with Bay K 8644 and nimodipine in combination with localized calcium imaging suggest that CaV1.3 L-type calcium channels may be primarily localized in distal dendrites of lamprey spinal neurons, and that these channels contribute to the membrane potential oscillations. At some dendritic locations, the amplitude of calcium fluctuations decreased upon nimodipine blockade, suggesting a significant contribution by CaV1.3 L-type calcium channels at such locations. In other locations, nimodipine blockade could instead increase calcium fluctuation amplitude. These two opposing effects could occur simultaneously in different locations of the dendritic tree of the same neuron, and even in different, adjacent regions of the same distal dendrite. These findings could possibly reflect local, complex interactions between different types of ion channels, such as NMDA, Ca2+ and KCa channels, and other membrane properties, such as regional differences of membrane potential. The nature of such interactions remains to be elucidated. The findings may also suggest that the distribution of CaV1.3 L-type calcium channels along the dendritic membrane is not uniform, but clustered in certain regions. Interestingly, the dendritic distribution of CaV1.3 channels in cat lumbar motoneurons has been suggested to be non-uniform, and to correspond to that of Ia afferent synaptic contacts (ElBasiouny et al. 2005).
During NMDA-induced membrane potential oscillations, the calcium influx via CaV1.3 L-type calcium channels will contribute to the activation of KCa channels involved in the repolarization after the plateau, and may also contribute to the initiation of depolarization following the hyperpolarized phase (Figs 5 and 8). The latter role may correspond to the contribution of CaV1.3 channels to the postinhibitory rebound, as previously described (Wang et al. 2011). At the onset of depolarization, NMDA-receptor channels will also start to contribute, allowing influx of sodium as well as calcium ions (Fig. 8; see also Wallén & Grillner, 1987). When the voltage-dependent magnesium block of the NMDA channels is released, a rapid depolarization will follow, triggering both an activation of voltage-dependent K+ (KV) channels and the fast increase in calcium influx. The activation of KV channels will counteract and limit the depolarization (cf. Grillner & Wallén, 1985). The calcium influx will then activate KCa channels, which contribute to maintenance of the plateau (by preventing further depolarization) and to the subsequent repolarization and termination of the plateau (Fig. 8). Upon closure of the NMDA channels, due to reinstated Mg2+ block, a rapid hyperpolarization will follow. During the ensuing slow depolarization, calcium levels were here shown to decrease slowly (Figs 2B, 3 and 8), leading to a correspondingly slow decrease of KCa channel activation. This is likely to underlie the slow depolarization before the next oscillation peak starts (Fig. 8, indicated by vertical dashed lines). This new finding thus complements our understanding of the ionic mechanisms underlying the NMDA-induced membrane potential oscillations.
Figure 8. Ion channel dynamics during NMDA-induced membrane potential oscillations.
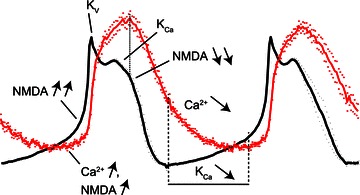
Membrane potential (black trace) and the simultaneously recorded calcium fluctuation (red trace) in a distal dendrite. At the onset of the depolarization phase, NMDA channels and Ca2+ channels start to open, and when the voltage-dependent Mg2+ block of the NMDA channels is released, a rapid depolarization will follow, triggering both an activation of voltage-dependent K+ (KV) channels and the fast increase in calcium influx. The calcium influx will then activate KCa channels, which contribute to maintenance of the plateau (by preventing further depolarization) and to the subsequent repolarization and termination of the plateau. Upon closure of the NMDA channels, due to reinstated Mg2+ block, a rapid hyperpolarization will follow. Calcium levels then continue to decrease slowly, leading to a correspondingly slow decrease of KCa channel activation (indicated by vertical dashed lines), which may underlie the slow depolarization before the next cycle starts.
The KCa channels have been reported to be located close to the CaV1.3 channels (cf. Marrion & Tavalin, 1998; Lu et al. 2007), and the present findings would suggest that the interaction between the two channel types may occur mainly in distal dendrites. In contrast, N-type calcium channels (CaV2.2) seem to be localized primarily to the soma/proximal dendrite regions in lamprey spinal neurons (Tsvyetlynska et al. 2006). The short calcium transients occurring during the action potential are known to trigger the KCa-dependent after-hyperpolarization via HVA N- and P/Q-type but not via L-type calcium channels (Wikström & El Manira, 1998).
In conclusion, the NMDA-induced membrane potential oscillations depend on a number of interacting subtypes of ion channels (Fig. 8; Wallén & Grillner, 1987; El Manira et al. 1994; Alpert & Alford, 2011). We have shown here the timing of the calcium oscillations in different parts of the soma–dendritic membrane, and the contribution of LVA CaV1.3-like channels.
Acknowledgments
We are grateful to Drs Abdel El Manira, Brita Robertson and Russell Hill for their valuable comments on the manuscript. This study was supported by the Swedish Research Council (Medicine, project no. 3026, and Natural and Engineering Sciences, project no. 1496), the European Union (project nos QLG3-CT-2001-01241 and Health-F2-2007-201144, FP7), the Marianne & Marcus Wallenberg Foundation and the Karolinska Institute Foundations. The study was also supported by a grant from the Natural Science Foundation of Liaoning Province, People's Republic of China (grant no. 201202144), a start-up grant from the Scientific Research Foundation for the Returned Overseas Chinese Scholars by Ministry of Human Resources and Social Security of the People's Republic of China (grant no. 2011LX007), a grant from the Scientific Research Foundation for the Returned Overseas Chinese Scholars, State Education Ministry, and a grant from the Science and Technology Program Foundation of Jinzhou City, People's Republic of China (grant no. 11A1E32), received by D.W.
Glossary
- HVA
high-voltage activated
- KCa channel
calcium-activated potassium channel
- KV channel
voltage-dependent K+ channel
- LVA
low-voltage activated
Author contributions
D.W. conducted the experiments and primary data analysis and developed the experimental design together with S.G. and P.W. All authors contributed to the evaluation of the data. P.W. wrote the manuscript in interaction with all authors, who also approved the final version of the manuscript.
References
- Alpert MH, Alford S. Synaptically driven NMDAR-based Ca2+ entry underlies membrane potential oscillations in lamprey ventral horn neurons. Soc Neurosci Abstr. 2011 918.10. [Google Scholar]
- Bacskai BJ, Wallén P, Lev-Ram V, Grillner S, Tsien RY. Activity-related calcium dynamics in lamprey motoneurons as revealed by video-rate confocal microscopy. Neuron. 1995;14:19–28. doi: 10.1016/0896-6273(95)90237-6. [DOI] [PubMed] [Google Scholar]
- Carlin KP, Jones KE, Jiang Z, Jordan L, Brownstone RM. Dendritic L-type calcium currents in mouse spinal motoneurons: implications for bistability. Eur J Neurosci. 2000;12:1635–1646. doi: 10.1046/j.1460-9568.2000.00055.x. [DOI] [PubMed] [Google Scholar]
- Catterall WA. Structure and regulation of voltage-gated Ca2+ channels. Annu Rev Cell Dev Biol. 2000;16:521–555. doi: 10.1146/annurev.cellbio.16.1.521. [DOI] [PubMed] [Google Scholar]
- Catterall WA, Perez-Reyes E, Snutch TP, Striessnig J. International Union of Pharmacology. XLVIII. Nomenclature and structure-function relationships of voltage-gated calcium channels. Pharmacol Rev. 2005;57:411–425. doi: 10.1124/pr.57.4.5. [DOI] [PubMed] [Google Scholar]
- ElBasiouny SM, Bennet DJ, Mushahwar VK. Simulation of dendritic CaV1.3 channels in cat lumbar motoneurons: spatial distribution. J Neurophysiol. 2005;94:3961–3974. doi: 10.1152/jn.00391.2005. [DOI] [PubMed] [Google Scholar]
- El Manira A, Tegnér J, Grillner S. Calcium-dependent potassium channels play a critical role for burst termination in the locomotor network in lamprey. J Neurophysiol. 1994;72:1852–1861. doi: 10.1152/jn.1994.72.4.1852. [DOI] [PubMed] [Google Scholar]
- Grillner S. The motor infrastructure: from ion channels to neuronal networks. Nat Rev Neurosci. 2003;4:573–586. doi: 10.1038/nrn1137. [DOI] [PubMed] [Google Scholar]
- Grillner S, Wallén P. The ionic mechanisms underlying N-methyl-D-aspartate receptor-induced, tetrodotoxin-resistant membrane potential oscillations in lamprey neurons active during locomotion. Neurosci Lett. 1985;60:289–294. doi: 10.1016/0304-3940(85)90592-0. [DOI] [PubMed] [Google Scholar]
- Grillner S, Wallén P, Hill R, Cangiano L, El Manira A. Ion channels of importance for the locomotor pattern generation in the lamprey brainstem–spinal cord. J Physiol. 2001;533:23–30. doi: 10.1111/j.1469-7793.2001.0023b.x. [DOI] [PMC free article] [PubMed] [Google Scholar]
- Hell JW, Westenbroek RE, Warner C, Ahlijanian MK, Prystay W, Gilbert MM, Snutch TP, Catterall WA. Identification and differential subcellular localization of the neuronal class C and class D L-type calcium channel α1 subunits. J Cell Biol. 1993;123:949–962. doi: 10.1083/jcb.123.4.949. [DOI] [PMC free article] [PubMed] [Google Scholar]
- Hille B. Ion Channels of Excitable Membranes. Sunderland, MA, USA: Sinauer Associates Inc; 2001. [Google Scholar]
- Hounsgaard J, Kiehn O. Serotonin-induced bistability of turtle motoneurones caused by a nifedipine-sensitive calcium plateau potential. J Physiol. 1989;414:265–282. doi: 10.1113/jphysiol.1989.sp017687. [DOI] [PMC free article] [PubMed] [Google Scholar]
- Koschak A, Reimer D, Huber I, Grabner M, Glossmann H, Engel J, Striessnig J. α1D (Cav1.3) subunits can form L-type Ca2+ channels activating at negative voltages. J Biol Chem. 2001;276:22100–22106. doi: 10.1074/jbc.M101469200. [DOI] [PubMed] [Google Scholar]
- Krieger P, Buschges A, El Manira A. Calcium channels involved in synaptic transmission from reticulospinal axons in lamprey. J Neurophysiol. 1999;81:1699–1705. doi: 10.1152/jn.1999.81.4.1699. [DOI] [PubMed] [Google Scholar]
- Lipscombe D, Helton TD, Xu W. L-type calcium channels: the low down. J Neurophysiol. 2004;92:2633–2641. doi: 10.1152/jn.00486.2004. [DOI] [PubMed] [Google Scholar]
- Lu L, Zhang Q, Timofeyev V, Zhang Z, Young JN, Shin H-S, Knowlton AA, Chiamvimonvat N. Molecular coupling of a Ca2+-activated K+ channel to L-type Ca2+ channels via α-actinin2. Circ Res. 2007;100:112–120. doi: 10.1161/01.RES.0000253095.44186.72. [DOI] [PubMed] [Google Scholar]
- Ludwig A, Flockerzi V, Hofmann F. Regional expression and cellular localization of the α1 and β subunit of high voltage-activated calcium channels in rat brain. J Neurosci. 1997;17:1339–1349. doi: 10.1523/JNEUROSCI.17-04-01339.1997. [DOI] [PMC free article] [PubMed] [Google Scholar]
- Marrion NV, Tavalin SJ. Selective activation of Ca2+-activated K+ channels by co-localized Ca2+ channels in hippocampal neurons. Nature. 1998;395:900–905. doi: 10.1038/27674. [DOI] [PubMed] [Google Scholar]
- Matsushima T, Tegnér J, Hill RH, Grillner S. GABAB receptor activation causes a depression of low- and high-voltage-activated Ca2+ currents, postinhibitory rebound, and postspike afterhyperpolarization in lamprey neurons. J Neurophysiol. 1993;70:2606–2619. doi: 10.1152/jn.1993.70.6.2606. [DOI] [PubMed] [Google Scholar]
- Sheets L, Kindt KS, Nicolson T. Presynaptic CaV1.3 channels regulate synaptic ribbon size and are required for synaptic maintenance in sensory hair cells. J Neurosci. 2012;32:17273–17286. doi: 10.1523/JNEUROSCI.3005-12.2012. [DOI] [PMC free article] [PubMed] [Google Scholar]
- Simon M, Perrier JF, Hounsgaard J. Subcellular distribution of L-type Ca2+ channels responsible for plateau potentials in motoneurons from the lumbar spinal cord of the turtle. Eur J Neurosci. 2003;18:258–266. doi: 10.1046/j.1460-9568.2003.02783.x. [DOI] [PubMed] [Google Scholar]
- Sukiasyan N, Hultborn H, Zhang M. Distribution of calcium channel CaV1.3 immunoreactivity in the rat spinal cord and brain stem. Neuroscience. 2009;159:217–235. doi: 10.1016/j.neuroscience.2008.12.011. [DOI] [PubMed] [Google Scholar]
- Tegnér J, Hellgren-Kotaleski J, Lansner A, Grillner S. Low-voltage-activated calcium channels in the lamprey locomotor network: simulation and experiment. J Neurophysiol. 1997;77:1795–1812. doi: 10.1152/jn.1997.77.4.1795. [DOI] [PubMed] [Google Scholar]
- Tsvyetlynska N, Grillner S, Wallén P. Differential distribution of N-type Ca channels underlying the Kca component of the slow AHP in lamprey spinal neurons, as revealed by calcium imaging. Soc Neurosci Abstr. 2006 252.28. [Google Scholar]
- Viana Di Prisco G, Alford S. Quantitative investigation of calcium signals for locomotor pattern generation in the lamprey spinal cord. J Neurophysiol. 2004;92:1796–1806. doi: 10.1152/jn.00138.2004. [DOI] [PubMed] [Google Scholar]
- Viana Di Prisco G, Jha A, Alford S. Spatiotemporal dynamics of [Ca2+]i signals in lamprey motoneurons during “fictive” swimming. Soc Neurosci Abstr. 2001:730.1. [Google Scholar]
- Wallén P, Grillner S. N-Methyl-D-aspartate receptor-induced, inherent oscillatory activity in neurons active during fictive locomotion in the lamprey. J Neurosci. 1987;7:2745–2755. doi: 10.1523/JNEUROSCI.07-09-02745.1987. [DOI] [PMC free article] [PubMed] [Google Scholar]
- Wang D, Grillner S, Wallén P. NMDA receptor activation, pacemaker oscillations and localization of HVA calcium channels in neurons of the spinal network for locomotion in lamprey. Soc Neurosci Abstr. 2008 373.10. [Google Scholar]
- Wang D, Grillner S, Wallén P. Real-time imaging of calcium dynamics unravel the contribution of L-type calcium channels to N-methyl-D-aspartate-induced membrane potential oscillations in lamprey spinal neurons. Soc Neurosci Abstr. 2009 177.11. [Google Scholar]
- Wang D, Grillner S, Wallén P. 5-HT and dopamine modulates CaV1.3 calcium channels involved in postinhibitory rebound in the spinal network for locomotion in lamprey. J Neurophysiol. 2011;105:1212–1224. doi: 10.1152/jn.00324.2009. [DOI] [PubMed] [Google Scholar]
- Westenbroek RE, Hoskins L, Catterall WA. Localization of Ca2+ channel subtypes on rat spinal motor neurons, interneurons, and nerve terminals. J Neurosci. 1998;18:6319–6330. doi: 10.1523/JNEUROSCI.18-16-06319.1998. [DOI] [PMC free article] [PubMed] [Google Scholar]
- Wikström MA, El Manira A. Calcium influx through N- and P/Q-type channels activate apamin-sensitive calcium-dependent potassium channels generating the late afterhyperpolarization in lamprey spinal neurons. Eur J Neurosci. 1998;10:1528–1532. doi: 10.1046/j.1460-9568.1998.00194.x. [DOI] [PubMed] [Google Scholar]
- Zhang M, Moller M, Broman J, Sukiasyan N, Wienecke J, Hultborn H. Expression of calcium channel CaV1.3 in cat spinal cord: light and electron microscopic immunohistochemical study. J Comp Neurol. 2008;507:1109–1127. doi: 10.1002/cne.21595. [DOI] [PubMed] [Google Scholar]
- Zhang M, Sukiasyan N, Møller M, Bezprozvanny I, Zhang H, Wienecke J, Hultborn H. Localization of L-type calcium channel CaV1.3 in cat lumbar spinal cord – with emphasis on motoneurons. Neurosci Lett. 2006;407:42–47. doi: 10.1016/j.neulet.2006.07.073. [DOI] [PubMed] [Google Scholar]