Abstract
Excessive stimulation of glutamatergic receptors (GluRs) can overexcite neurons. This can be dampened by KATP channels linking metabolic and neuronal activities, but the cross-talk has not yet been examined on the single channel level. In the brainstem and hippocampal neurons, GluR agonists augmented the open state probability (Popen) of KATP channels with relative efficacy: kainate ≍ AMPA > NMDA > t-ACPD. Inhibition of calcium influx and chelation of intracellular calcium did not modify the effects. Kainate did not augment production of reactive oxygen species measured with roGFP1. H2O2 slightly increased Popen, but GluR effects were not modified. GluR actions were abolished in Na+-free solutions and after blockade of Na+-K+-ATPase. KATP channels in open-cell patch-clamp measurements were inhibited by ATP, stimulated by ADP, and kainate was effective only in the presence of ATP. GluR stimulation enhanced ATP consumption that decreased submembrane ATP levels, whereas metabolic poisoning diminished bulk ATP. Modelling showed strong ATP depletion and ADP accumulation near the membrane, and both effects contributed to Popen increases after GluR stimulation. Kainate and hypoxia activated KATP channels in the functional brainstem slices. Inhibition of aerobic ATP production and GluR stimulation were about equally effective in KATP channel opening during hypoxia. Induction of seizure-like activity in hippocampal slices with Mg2+-free solutions was accompanied by ATP decrease and KATP channel opening. We propose that KATP channels and GluRs are functionally coupled that can regulate long-lasting changes of neuronal activity in the CNS neurons.
Key points
KATP channels can suppress overexcitation of CNS neurons after activation of glutamatergic receptors (GluRs), and we examined this functional interaction in the brainstem and hippocampal neurons.
GluR stimulation increased the activity of single KATP channels that was not mediated by intracellular calcium, reactive oxygen species and osmotic stress, and was abolished after inhibition of sodium influx.
ATP and sodium imaging indicated that functional cross-talk between GluRs and KATP channels is mediated by Na+-K+-ATPase.
GluR contributed to KATP channel opening during hypoxia in functionally intact brainstem slices and seizure-like activity in the hippocampal slices.
We propose that neuronal activity depletes submembrane ATP, and increases ADP levels and promotes KATP channel opening that dampen uncontrolled excitation by glutamate.
Introduction
Glutamate is the predominant excitatory neurotransmitter in the CNS, and over 70% of all nerve endings release this excitatory amino acid (Fonnum, 1984). Glutamatergic transmission plays a key role in the brain, but overstimulation of glutamate receptors (GluRs) may lead to excitotoxicity (Olney & de Gubareff, 1978). It is believed that the first step is prolonged membrane depolarization subsequently allowing the excessive influx of calcium followed by activation of various calcium-dependent enzymes, many of which have the potential to destroy neurons (Mattson et al. 1989; Choi & Rothman, 1990; Nicholls & Budd, 2000; Delorenzo et al. 2005). Reactive oxygen species (ROS; Avshalumov & Rice, 2003; Abramov et al. 2007), disturbances in ion homeostasis with consequent osmotic deregulation, and increased ATP consumption (Erescinska et al. 2005) may also contribute to excitotoxicity. Less acute but still pathological effects were assigned to glutamatergic neurotransmitter systems in epileptogenesis, Alzheimer's disease, amyotrophic lateral sclerosis, Huntington's and Parkinson's diseases, stroke, and hypoxia/ischaemia.
Deleterious long-lasting effects of glutamate may be caused by spillover of glutamate after its release into the synaptic cleft (Rusakov et al. 2011). Glutamate is normally cleared by astrocytic transporters and dissipates through diffusion. Both mechanisms operate slowly, and the long lifetime of glutamate in the extracellular space may overstimulate GluRs. Counteracting inhibitory brakes, acting via membrane hyperpolarization and preventing propagation of the excitatory postsynaptic current, may protect neurons from potentially excitotoxic insults. KATP channels have been thought to represent the perfect candidate, and their activation diminishes the effects of hypoxia/ischaemia (Lipton, 1999; Ben-Ari & Cossart, 2000; Krnjević, 2008). KATP channels downregulate glutamate release (Soundarapandian et al. 2007), and their overexpression has beneficial effects in epilepsy (Yamada et al. 2001) and schizophrenia (Hernández-Sánchez et al. 2001).
KATP channels were first characterized as intrinsic ATP sensors in the heart (Noma, 1983). Their activity is also modulated by various signalling molecules, including ROS (Liu & Gutterman, 2002; Avshalumov & Rice, 2003; Mironov & Langohr, 2007), G-proteins, protein kinases A and C, osmo-mechanical stress (Mironov & Richter, 2000), and membrane phospholipids (Shyng & Nichols, 1998; Mironov & Skorova, 2011). The mechanisms partially overlap with the pathways activated by glutamate, but it is yet unknown whether causal relationships exist.
The issue as to whether and how GluRs can modify activity of KATP channels has been never investigated on the single channel level. We examined KATP channels opening in relation to neuronal activity in brainstem and hippocampal slices, and analysed in detail the mechanisms that can mediate cross-talk between GluR and KATP channels in isolated hippocampal neurons in culture. The study was initiated by the observation that application of 100 μm glutamate for 2 min induced about a threefold increase in the open state probability (Popen) of KATP channels. The effects developed slowly and were long-lasting, and we sought for possible mediators. We verified that intracellular calcium, osmotic stress and ROS were not involved. Stimulation of KATP channels by GluR agonists was abolished in sodium-free solutions and after elimination of ATP-dependent sodium efflux with ouabain. We imaged significant accumulation of sodium after membrane depolarization and GluR stimulation. Measurements of ATP in neurons using Ateam 1.03 showed ATP depletion after activation of GluRs and during seizure-like activity.
In neurons permeabilized with ß-escin, KATP channels were inhibited by ATP and stimulated by ADP. Kainate increased Popen only in the presence of ATP. Modelling ATP homeostasis, we calculated strong decreases in ATP and increases in ADP in submembrane regions after stimulation of Na+/K+-ATPase that contrasted to a uniform ATP decrease after metabolic poisoning. Calculated changes in ATP and ADP were used to estimate Popen that agreed with experimentally measured values.
We propose that even brief periods of neuronal activity may substantially deplete submembrane ATP and increase ADP. Both effects converge to reinforce KATP channel opening that can induce long-lasting changes in neuronal activity and dampen uncontrolled excitation after excessive release of glutamate and minimize its excitatory effects.
Methods
Preparation and solutions
All animals were housed, cared for and killed in accordance with the recommendations of the European Commission (No. L358, ISSN 0378-6978), and protocols were approved by the Committee for Animal Research, Göttingen University. The animals were killed by decapitation, and the fresh brains were used for preparation of acute and organotypic slices.
Cell cultures of hippocampal neurons were prepared from 2- to 4-day-old mice as described previously (Mironov, 1995). Briefly, hippocampi were dissected; the cells were dissociated and plated on coverslips. Patch-clamp recordings and imaging were made in neurons that had spent at least 1 week in culture. The coverslips with hippocampal neurons were placed on the microscope stage in a chamber continuously superfused at 1 ml min−1 at 34°C with bath solution containing (in mm): NaCl, 136; KCl, 5; CaCl2, 1.25; MgCl2, 0.8; glucose, 6; Hepes, 10; pH 7.4.
Functionally intact ‘rhythmic’ slices (thickness, 600 μm) were obtained from the brainstem of P5–P7 mice as described previously (Mironov et al. 2009). Slices were placed in the recording chamber on a nylon mesh and overlaid with a threaded home-made platinum-iridium support for mechanical stability. One of the hypoglossal (XII) rootlets was sucked into a blunt electrode to record the respiratory motor output. The experiments were performed in the slices bathed at 34°C in artificial cerebrospinal fluid (ACSF) containing (in mm): NaCl, 136; KCl, 4; CaCl2, 1.25; MgSO4, 0.8; NaH2PO4, 0.4; K2HPO4, 0.3; NaHCO3, 3.3; glucose, 6; pH 7.4 and saturated with 95% O2–5% CO2.
Organotypic hippocampal slices were prepared and maintained in culture as described by Stoppini et al. (1991), which we applied previously to brainstem slices (Hartelt et al. 2008). Briefly, the animals were prepared at postnatal day P3, and slices were placed on the support membranes (Millicell–CM Inserts, PICMORG50; Millipore). A medium of 1 ml was added to have the surface of the slice continuously exposed to the incubator gas mixture, and the medium (50% MEM with Earle's salts, 25 mm Hepes, 6.5 mg ml−1 glucose, 25% horse serum, 25% Hanks solution buffered with 5 mm Tris and 4 mm NaHCO3, pH 7.3) was changed every 2 days.
All salts and other common substances were from Sigma (Deisenhofen, Germany). GluR agonists and antagonists, voltage-sensitive L-type calcium channel (CaL) modulators and ROS scavengers were purchased from Tocris Bioscience (Bristol, UK). Acetomethoxy (AM) ester forms of fura-2 and Sodium Green were from Invitrogen (Darmstadt, Germany).
Electrophysiology
All patch-clamp experiments were performed in the cell-attached mode. Glass electrodes had 4 MOhm resistances, when filled with the solution (in mm): K+-gluconate, 125; NaCl, 10; MgCl2, 2; Hepes, 10; Na2ATP, 0.5; pH 7.4. Membrane currents were measured with the amplifier EPC-7 (ESF, Friedland, Germany). Single KATP channels were identified by their conductance (75 pS), gating pattern and pharmacology (inhibition by 30 μm glibenclamide and activation by 30 μm diazoxide) as described previously (Mironov et al. 1998; Haller et al. 2001; Mironov & Skorova, 2011). The Popen of KATP channels was calculated as the ratio of mean and unitary currents divided by the number of open channels in the patch estimated from the maximal number of superimposed events during the experiment.
In the ‘open-cell’ (OC) mode, neurons were bathed in calcium-free solution containing (in mm): NaCl, 136; KCl, 5; EGTA, 0.1; Hepes, 10; glucose, 6; pH 7.4. After formation of cell-attached patch the rest of membrane was permeabilized by a single puff of 5 μmβ-escin. The efficacy of the cytoplasmic exchange was assessed in neurons loaded with fura-2 that leaked from the cells within <1 min after addition of β-escin.
Imaging
For calcium-imaging neurons were loaded with 1 μm fura-2/AM for 15 min at 37°C and washed for 30 min. For sodium-imaging neurons were incubated with 12 μm Sodium Green/AM for 45 min at 37°C and washed for 30 min. ROS production was measured with ro-GFP1 (Hanson et al. 2004). ATP levels were assessed with Ateam 1.03 (Imamura et al. 2009). Genetically encoded sensors D3cpv and Ateam 1.03 were modified to selectively express them in neurons. Coding sequences were embedded into recombinant adeno-associated virus vector containing synapsin 1 gene promoter. Neurons were transduced 2 days after preparation using protocols applied previously (Hartelt et al. 2008; Mironov et al. 2009). Near 100% infection efficiency was obtained for adding 100 infectious particles per μl to the growth medium (0.5 ml in one well of a four-well plate). Steady expression was usually attained within 3 days.
The neurons were visualized with a 10× or 40× objective lens of an upright microscope (Axioscope 2, Zeiss). The excitation light from CoolLED (BFI Optilas, Puchheim) was attenuated to 30%. Fura-2 signals were excited at 380 nm and the fluorescence was collected at 535 ± 15 nm. Fluorescence resonance energy transfer (FRET)-based sensors Ateam 1.03 (Imamura et al. 2009) and D3cpv (Palmer & Tsien, 2006) were excited at 425 nm, and their fluorescence was measured at 535 nm (FRET acceptor) and 470 nm (CFP; FRET donor). Images were captured by cooled CCD camera (BFI Optilas, Puchheim) using ANDOR software (500 × 500 pixels at 12-bit resolution). Images for analysis were background subtracted and examined offline with MetaMorph software (Universal Imaging Corp., Downington, PA, USA) and custom-made programs. Mean cytoplasmic ATP and calcium were obtained from FRET/CFP ratios in regions of interest that encircled single neurons. The data were averaged for 8–12 neurons in the image field, and the standard deviation in all cases was <10%.
To calculate intracellular concentrations from fluorescence signals, we used the approach proposed by Grynkiewicz et al. (1985). In equilibrium the measured signals can be related to those from free- and bound forms of the indicator as
where X stands for the FRET/CFP ratio (R; D3cpv and Ateam) or fluorescence at a single wavelength (F; fura-2, Sodium Green), C is the intracellular concentration, K is the dissociation constant of the indicator, and n is the Hill index indicating stoichiometry of the binding. Normalizing the signals as x=X/Xmax and x′=X/Xmin we, respectively, get
and
Limiting values Rmax and Fmax for D3cpv and Sodium Green were determined at the end of each experiment using 5 μm ionomycin and 20 μg ml−1 gramicidin that, respectively, equilibrated calcium and sodium concentrations across the plasma membrane. Calcium concentrations were calculated using the first formula with Rmax/Rmin= 12.5 and K= 0.76 μm, n= 0.74 (D3cpv; Palmer & Tsien, 2006), and for sodium we used Fmax/Fmin= 7.2, K= 21 mm and n= 1 (Sodium Green; Winslow et al. 2002). The value of Rmin for ATeam 1.03 was determined using 1 μm carbonyl cyanide-p-trifluoromethoxyphenylhydrazone (FCCP) that set ATP to zero. The values of Rmax/Rmin= 2.42, K= 3.3 μm and n= 2.1 were taken from Imamura et al. (2009). Calcium levels from fura-2 fluorescence were obtained as described previously (Mironov & Langohr, 2005).
Model of spatio-temporal ATP changes in the cytoplasm
ATP dynamics was described by the reaction-diffusion equation
| (1) |
where C=[ATP], Ct is the time derivative and Δ is the Laplacian representing ATP diffusion (D= 200 μm2 s−1). The boundary condition
| (2) |
described ATP consumption by membrane pumps. The model had only three parameters –K, α and J that, respectively, represented ATP production and consumption in the cytoplasm, and ion pumping out of the cell. The solution of eqn (1) without time-dependent part defines the steady-state ATP profile as
where R is the cell radius and  .
.
The mean cytoplasmic ATP is obtained after integration eqn (1) by the spatial coordinate that gives the ordinary differential equation
| (3) |
It defines the time constant of mean ATP changes as
| (4a) |
and the steady-state ATP level as
| (4b) |
This was used to estimate parameters of ATP handling. For resting [ATP]= 2 mm, ATP production rate K= 25 μm s−1 (Attwell & Laughlin, 2001) and J=α/3 (contribution of Na+/K+-ATPase to the total ATP consumption at rest; Rolfe & Brown, 1997; Ames, 2000), eqn (4b) gives α= 0.01 s−1. We show below that the estimates of K, J and α agree well with values measured experimentally.
Na+/K+-ATPase activity was described by the time-dependent term f(t) in the boundary condition (2). We considered only changes in the pump activity that are caused by sodium accumulation, and set
(Ames, 2000; Krishnan & Bazhenov, 2011). Sodium influx was set to 10 mm min−1 as measured in sodium imaging (Fig. 5, below). After stimulation the pump activity declined exponentially with time constant 30 s, and ATP levels were obtained using eqns (1) and (2).
Figure 5. Activation of ATP-sensitive K+ (KATP) channels by hypoxia and kainate in the functionally intact acute brainstem slices.
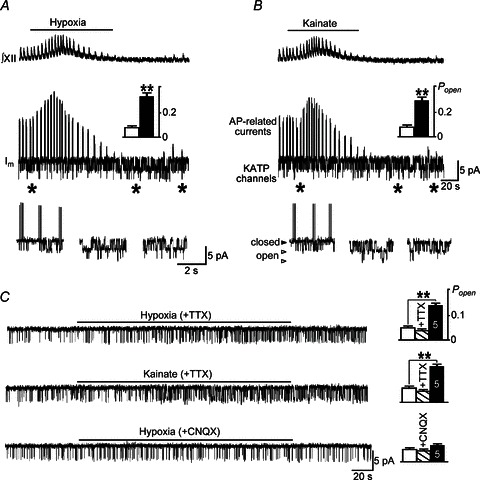
A and B, respiration-related motor output (∫XII) was recorded from the hypoglossal nerve. Cell-attached recordings from preBötC neurons present inspiratory bursts and opening of single KATP channels. Hypoxia and 3 μm kainate first augmented and then depressed rhythmic activity followed by increase in KATP channel opening. The third panel shows episodes of channel activities at the expanded time scale at times indicated by asterisks. C, blockade of sodium voltage-dependent channels with 1 μm TTX diminished increases in KATP channel activity both after hypoxia and kainate (∫XII activity was abolished by TTX and not shown). Hypoxia in the presence of 6-cyano-7-nitroquinoxaline-2,3-dione (CNQX) (10 μm) only slightly increased KATP channel activity. Insets on the right show the mean open state probabilities (Popen) before and 3 min after hypoxia and kainate. TTX and CNQX were added 10 min before measurements and left in the bath.
The value of Popen of KATP channels was calculated using the model of Hopkins et al. (1992) in the formulation of Magnus & Keizer (1998)
 |
(5) |
Here the dissociation constants are Kdd= 17 μm, Ktd= 26 μm and Ktt= 1 μm. [ADP] values were obtained from ATP levels as [ADP]= (2 −[ATP])/4 + 0.01 (mm) that accounts for basal [ADP]= 10 μm and its further hydrolysis (Mironov, 2007).
Statistics
The experiments were made in cultures obtained from 166 mice, and each treatment was performed on preparations obtained from at least three different mice. Experiments used randomly chosen cell batches and in each coverslip only one particular protocol was applied. Data are given as mean ± standard deviation, and significantly different changes are marked as *P < 0.1 and **P < 0.01. They were determined using the non-parametric Mann–Whitney U test. Statistical calculations were done with the Excel software (Office 2003) and Statview (version 5.0.1, SAS Inc., NC, USA).
Results
GluRs augment KATP channel activity in the hippocampal neurons
In dissociated cultured cells GluR agonists slowly increased the frequency of openings of single KATP channels (Fig. 1). Supplementary Fig. S1 presents typical traces of channel activity for each experimental protocol used. AMPA and kainate maximally stimulated KATP channels at 10 μm and 100 μm NMDA, and 0.5 mm t-ACPD induced weaker effects (Figs 2B and S1). Long-term stimulation of single KATP channels by GluR agonists has not been reported previously, and its slow development implies specific intracellular pathways. We sought for possible mediators of GluR effects, and examined roles of calcium, osmotic stress, ROS and ATP. In testing experiments we used 10 μm AMPA and kainate interchangeably, because they induced identical changes in KATP opening.
Figure 1. Augmentation of ATP-sensitive K+ (KATP) channel activity after GluR stimulation.
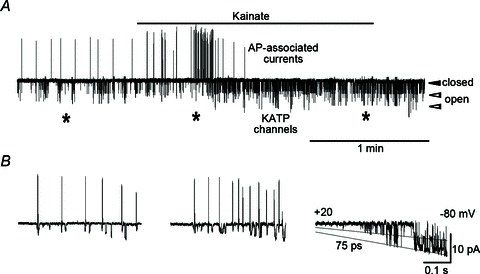
A, measurements were performed in cultured hippocampal neurons. Cell-attached patch was held at −50 mV. Application of 10 μm kainate for 2 min first augmented and then decreased the frequency of action potential (AP)-related currents (upwardly directed declinations) accompanied by activation of KATP channels. B, episodes of neuronal and channel activities at times indicated by asterisks in (A). The traces show voltage ramp recordings from +20 to −80 mV. The two lines in the rightmost panel indicate chord conductances of KATP channels (multiples of 75 pS).
Figure 2. Glutamate receptors (GluRs), intracellular calcium and KATP channels.
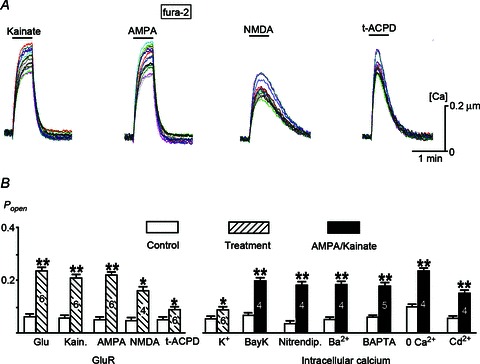
A, GluR-mediated calcium increases in cultured hippocampal neurons. B, open state probability (Popen) of KATP channels in the control (empty bars), after treatments that elevated cytoplasmic calcium (hatched bars) and 3 min after 10 μm AMPA/kainate (filled bars) in the presence of agents that modulated calcium influx. Agents were added 10 min before AMPA/kainate applications and left in the bath. Representative recordings and application conditions are given in Fig. S1. Significant differences in the experiments were shown by **P < 0.01 and *P < 0.1. The numbers of measurements for each experimental protocol are given within histogram bars.
Intracellular calcium
AMPA and kainate (10 μm) increased calcium and reversibly to plateau, and calcium levels recovered fast during washout (Fig. 2A). The effects were abolished by 1 μm TTX (n= 4), this indicated that calcium increase was caused by membrane depolarization and opening of voltage-sensitive calcium channels. NMDA (100 μm) in Mg2+-free solution produced smaller and slower calcium transients. Calcium transients evoked by t-ACPD were typical for IP3-driven calcium release from internal stores (Mironov, 1995). The fast rise and decay of calcium indicated unperturbed calcium homeostasis after GluR stimulation.
When possible effects of intracellular calcium were inhibited by blockade of calcium influx with cadmium, removal of external calcium, its replacement with barium and loading neurons with the calcium chelator BAPTA, the responses of KATP channels to AMPA/kainate were not modified (Figs 2B and S1). They were not changed by nitrendipine and BAY K 8644 that, respectively, inhibit and activate L-type calcium channels (Nowycky et al. 1985).
Osmotic stress
Ion fluxes activated after GluR stimulation may induce swelling of neurons known to potentiate activity of single KATP channels (Mironov & Richter, 2000). Kainate did not change the volume or form of the neurons (Fig. S2). After 2 min in solution with −50% osmolarity, Popen increased by about twofold. Subsequent addition of kainate increased KATP opening in about the same proportion as in the control (Fig. 3A) that indicated independent effects of osmo-mechanical stress and GluR stimulation.
Figure 3. Intracellular pathways and GluR-mediated KATP channel opening.
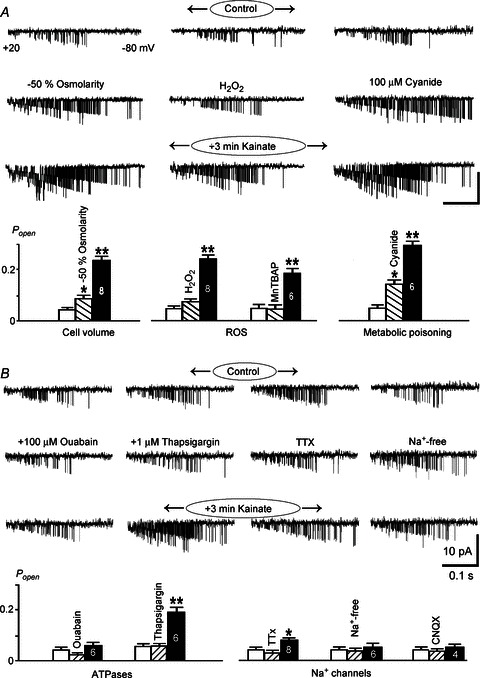
The traces in A and B show the activity of KATP channels during voltage ramps from +20 to −80 mV. Histograms present mean open state probabilities (Popen) in the control (empty bars), 2 min after treatments (hatched bars) and 3 min after applications of 10 μm kainate in the presence of agents (filled bars). A, osmotic stress and cyanide increased Popen, and kainate elevated it further. The channel activity was not significantly changed after treatment of neurons with H2O2 (1 mm, 2 min) and scavenger MnTBAP (50 μm, 30 min; see also Fig. S1). B, effects of ion pumps and sodium influx. The traces present channel activities before, in the presence of ouabain (3 μm, Na+/K+-ATPase blocker), thapsigargin (1 μm, SERCA inhibitor) and TTX (1 μm, blocker of voltage-dependent sodium channels), in sodium-free solutions and after kainate. Significant differences between Popen values in the control and 3 min after 10 μm kainate were shown by **P < 0.01 and *P < 0.1. The numbers of measurements for each experimental protocol are given within histogram bars. CNQX, 6-cyano-7-nitroquinoxaline-2,3-dione; ROS, reactive oxygen species.
ROS
ROS modulate KATP channels (Liu & Gutterman, 2002; Mironov & Langohr, 2007). H2O2 (1 mm) slightly elevated Popen that did not prevent further stimulation of channels by kainate (Figs 3A and S1). In the presence of Mn(III)tetrakis(4-benzoic acid) porphyrin chloride that eliminates ROS effects in skeletal muscle (Martins et al. 2008), the effects of kainate were identical to that in the control (Figs 3A and S1). Imaging ROS levels with ro-GFP1 (Hanson et al. 2004) showed no changes in response to 10 μm kainate (Fig. S3; n= 6).
Sodium accumulation and extrusion
Negative results obtained for calcium, ROS and osmotic stress on GluR-induced changes in KATP activity prompted us to examine the direct modulation of channels through ATP. For a ‘general’ cell (Rolfe & Brown, 1997; Ames, 2000) about 25% of the total ATP synthesis is used by the Na+-K+-ATPase, 5% by the Ca2+-ATPase (SERCA), 5% by the actomyosin ATPase, and the rest for gluconeogenesis, substrate cycling, protein and mRNA synthesis.
Examination of typical ATP consumers showed that inhibition of ATP-dependent actin turnover did not modify GluR effects (Figs S1 and S4). In the presence of 1 μm thapsigargin (SERCA inhibitor), AMPA/kainate effects were slightly smaller than in the control (Fig. 3B). Ouabain (3 μm; Na+/K+-ATPase blocker) completely abrogated GluR-mediated augmentation of channel activity, and in sodium-free solutions the effects were not observed (Fig. 3B). In the presence of 1 μm TTX, GluR stimulation was much less effective than in the control. Ouabain and TTX also slightly increased Popen, which likely reflected the contribution of Na+/K+-ATPase activity to ATP consumption at rest (Fig. 3B).
Changes in intracellular sodium
Using Sodium Green (Winslow et al. 2002) we imaged changes in cytoplasmic sodium during treatments applied to examine KATP channels. Membrane depolarization with 50 mm K+ elevated sodium to a plateau from which it recovered quickly. After 10 μm AMPA, sodium levels recovered slower. NMDA-evoked transients had smaller amplitudes (Fig. 4A). The mean sodium increases and time constants of sodium recovery were 21.4 ± 1.6 mm and 25.6 ± 4.4 s (50 mm K+), 36.6 ± 1.7 mm and 40.1 ± 5.3 s (10 μm AMPA), and 16.4 ± 1.2 mm and 38.0 ± 2.2 s (100 μm NMDA). The values are in the range measured in neurons and synaptic endings (Regehr, 1997; Lamy & Chatton, 2011). Activation of metabotropic GluRs with 0.5 mm t-ACPD produced no observable effects (tested in four different neuron batches, data not shown).
Figure 4. Sodium transients in hippocampal neurons.
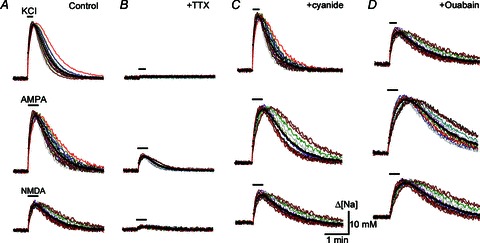
The figure shows the intracellular sodium changes during exposures to 50 mm K+, 10 μm AMPA and 100 μm NMDA in Mg2+-free ACSF in the control (A), 10 min after addition of 1 μm TTX to the bath (B), after 2 min with 100 μm cyanide (C), and after 10 min with 3 μm ouabain (D). The traces present sodium changes in single neurons, and filled circles indicate mean values. Responses are representative for >3 experiments made in different cell batches.
AMPA effects were abolished by the antagonist 6-cyano-7-nitroquinoxaline-2,3-dione (CNQX; 10 μm), and NMDA actions were blocked by the antagonist 5-APV (30 μm, four different cell batches tested). In the presence of 1 μm TTX, the amplitudes of sodium transients were 5.1 ± 0.7% (50 mm K+), 22.6 ± 0.8% (10 μm AMPA) and 6.4 ± 0.6% (100 μm NMDA) of control (Fig. 4B). This indicates that GluR-induced membrane depolarization contributed more to sodium accumulation than permeation through AMPA/kainate- or NMDA-activated channels.
After 2 min with cyanide the amplitudes of sodium transients were about the same and their recovery became slower (Fig. 4C). In the presence of ouabain (3 μm, applied for 10 min and left in the bath during recordings), sodium changes induced by K+, AMPA and NMDA had even slower recovery (Fig. 4D). Cyanide and ouabain also elevated resting sodium levels as indicated by higher baselines before testing applications (Fig. 4C and D).
GluR effects in the functional brainstem slices
We sought for possible functional implications of the cross-talk between GluR and KATP channels. We first examined the pre-Bötzinger complex (preBötC) in the lower brainstem (Smith et al. 1991) that generates respiration-like motor output supported by synchronous activation of glutamatergic pacemaker neurons (Feldman & Del Negro, 2006). preBötC neurons during hypoxia demonstrate the first augmentation of rhythmic activity that is then suppressed in parallel with an increase in KATP channel opening (Mironov et al. 1998). A biphasic response in neuronal activity resembles the effects of GluR stimulation (Fig. 1). Hypoxia induces also a massive release of glutamate in the brainstem (Richter et al. 1999), and we hypothesized that such an effect may contribute to activation of KATP channels during hypoxia.
The effects of hypoxia and kainate in the brainstem were nearly identical (Fig. 5A and B). KATP channel openings due to hypoxia and kainate were distinctly smaller after blockade of neuronal activity with TTX, and further decreased in slices treated with 10 μm CNQX before hypoxia (Fig. 5C). The data suggest that both glutamate release and ATP depletion are about equally important in the activation of KATP channels during hypoxia.
Activation of KATP channels during seizures
GluRs (Werner & Coveñas, 2011) and KATP channels (Yamada et al. 2001) are important players in the development and maintenance of seizures. Mg2+-free solution enables robust seizure-like activity due to disinhibition of NMDA receptors (Avoli et al. 2002). We used functional calcium imaging as readout of network activity (Mironov et al. 2009) to examine changes in ATP levels and KATP channel activity during seizures. Organotypic hippocampal slices were transduced with D3cpv and ATP sensors, respectively. The preparation had typical structure with clearly identified CA1, CA3 and dentate gyrus regions (Fig. 6A).
Figure 6. Calcium, ATP, neuronal activity and KATP channels in organotypic hippocampal slices during seizures.
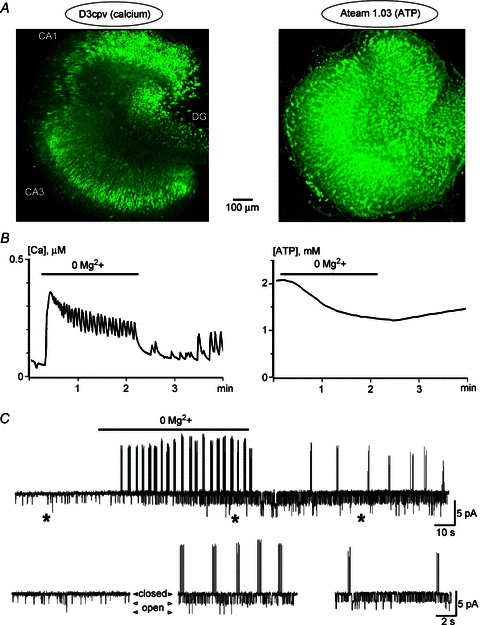
A, images of hippocampal slices transduced with neuron-targeted calcium (D3cpv) and ATP (Ateam 1.03) sensors. B, disinhibition of NMDA receptors after removal of Mg2+ from the bath increased calcium and induced oscillatory activity that disappeared quickly during washout (left). The same treatment slowly decreased ATP levels that recovered slowly (right). C, a continuous trace presents cell-attached recording in CA3 neuron at a holding potential of 0 m. Removal of Mg2+ induced bursts of APs with subsequent activation of KATP channels. The traces below show episodes of channel activities at the expanded time scale at times indicated by asterisks.
After removal of Mg2+ from the bath, calcium levels abruptly increased and oscillatory activity appeared (Fig. 6B). The effects were reversible and subsided quickly during washout. The responses were abolished by 10 μm CNQX, 30 μm 5-APV and 1 μm TTX (n= 4 for all agents tested, data not shown). During seizures ATP levels slowly decreased and recovered even slower (Fig. 6Bb, n= 6). In cell-attached recordings seizure appearance was manifested by bursting activity accompanied by KATP channel opening that time-course matched ATP decrease (Fig. 6C). The results obtained in brainstem and hippocampal preparations support the existence of functional connection between neuronal activity, ATP consumption and KATP channel opening.
OC measurements
To further study the modulation of KATP channels by nucleotides we used the OC configuration (Fig. 7A); a technique designed to examine KATP channels in cardiomyocytes and β-cells (Vandenberg, 1987; Nichols & Lederer, 1990; Carrasco et al. 2001; Tarasov et al. 2006), but not yet applied to neurons. Recordings in the OC mode were stable for 10–60 min, which was sufficient to measure single-channel activities after complete exchange of the cytoplasmic content (<1 min; Methods) and perform several bath applications. In the OC mode KATP channels had 75 pS conductance, showed gating properties and inhibition by glibenclamide (50 μm, n= 4) similar to that observed in the intact cells.
Figure 7. KATP channels in the open-cell (OC) configuration.
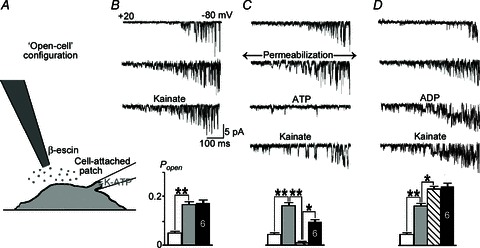
A, experimental design. Neurons were permeabilized using local application of β-escin in ATP- and calcium-free bath solution. B, the activity of KATP channels increased within 1 min after cytoplasmic ATP washed out, and it was not further modified by 10 μm kainate. C, the addition of 1 mm ATP after permeabilization inhibited KATP channels, and subsequent application of kainate increased the open state probability (Popen), but was weaker than in the intact cells (Fig. 2). D, the addition of 1 mm ADP after permeabilization enhanced KATP channel activity, and 10 μm kainate did not change it further. The traces show channel openings during voltage ramps from +20 to −80 mV. The mean slope conductance in all experiments was 75 ± 4 pS. Histograms present the mean values during the treatments in (B–D) and their significance (*P < 0.1; **P < 0.01), with the number of experiments in the bars.
After permeabilization of neurons in calcium- and ATP-free solution, Popen increased and 10 μm kainate did not change it further (Fig. 7B). Elevation of ATP in the bath to 1 mm decreased channel activity. Subsequent application of kainate increased Popen that can be caused by partial relief of ATP-mediated inhibition (Fig. 7C). Kainate effects were smaller than in cell-attached patches from intact neurons (Fig. 2), which can be explained by the weaker activity of Na+/K+-ATPase as observed in ‘broken’ cell preparation (Stone, 1968) and giant patches (Kabakov, 1998). Addition of 1 mm ADP after permeabilization increased Popen, and kainate had no effect on KATP channel opening (Fig. 7D).
ATP imaging
We measured cytoplasmic ATP in neurons selectively transduced with Ateam 1.03. Kainate slowly decreased ATP (Fig. 8A), which was markedly suppressed by 3 μm ouabain (Fig. 8B). Poisoning of mitochondria with cyanide produced faster and bigger ATP decreases that were completely reversible (Fig. 8D). The responses developed more slowly in the presence of 3 μm ouabain (Fig. 8E), and accelerated when kainate was added (Fig. 8C). Cytoplasmic ATP profiles (insets in Fig. 8A and D) indicated that kainate mostly decreased ATP in submembrane regions, whereas cyanide diminished ATP in the bulk.
Figure 8. ATP imaging.
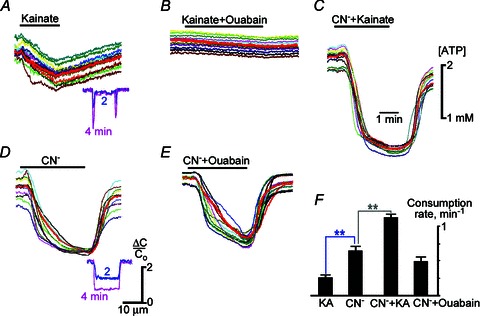
The traces demonstrate ATP changes in single hippocampal neurons, and the thick lines indicate their means. Kainate (10 μm) was applied alone (A), with 3 μm ouabain (B, added 10 min before the experiment and left in the bath) and with 100 μm cyanide (C). Cyanide was applied alone (D) and 10 min after 3 μm ouabain (E). Kainate-induced ATP decrease was suppressed by ouabain (A versus B). The ATP decline produced after cyanide was stronger and faster (D). ATP changes were slower after treatment with ouabain (E) and accelerated in the presence of kainate (C). The insets in A and D show the relative decreases in ATP (ΔC/Co) obtained from line scans (1 μm width) across neurons. Kainate mostly decreased ATP near the membrane (A), and cyanide depleted ATP in the bulk of the cytoplasm (D). The mean rates of ATP consumption shown in (F) were derived from the slopes of ATP decline.
We estimated the rates of ATP consumption from the slopes of ATP decrease. The effects of kainate and cyanide were additive. Ouabain decreased the rate of ATP consumption by about 1/3 (Fig. 8F), close to the assumed contribution of Na+/K+-ATPase to ATP homeostasis (Methods). The results of ATP imaging thus support the notion that submembrane ATP can mediate a functional coupling between GluRs and KATP channels.
Modelling ATP changes and KATP channel activity
We simulated GluR effects on KATP channels using the model of ATP handling described in Methods. Figure 9A shows that sodium accumulation and stimulation of Na+/K+-ATPase induced substantial ATP depletion in submembrane regions, whereas the mean [ATP] decreased only moderately. Poisoning of mitochondria with cyanide produced uniform ATP changes in the cytoplasm (Fig. 9B). Combined application of cyanide and kainate decreased ATP more strongly, especially in submembrane regions (Fig. 9C). Using the model of Hopkins et al. (1992) and ATP and ADP levels, we estimated Popen increases after kainate and cyanide alone and in combination (Fig. 9A–C). The values were close to those measured in the experiments (Figs 2B and 3A). We should also note that stimulation of channels by ADP and relief of ATP blockade contributed about equally to increases in Popen.
Figure 9. Spatio-temporal ATP profiles.
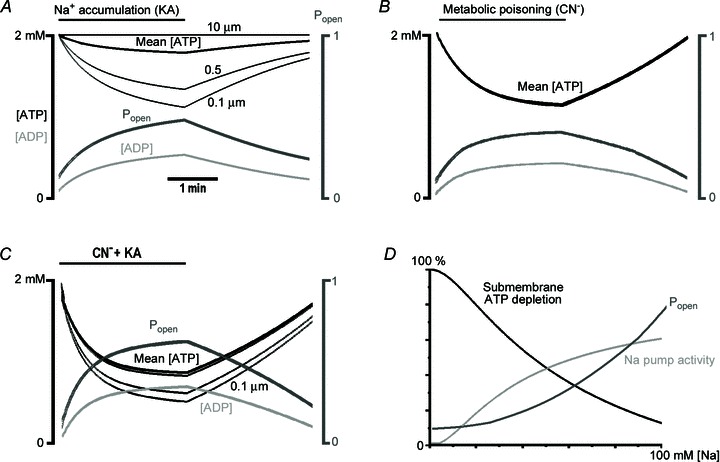
Changes in [ATP], [ADP] and Popen were calculated as described in Methods. Shown are [ATP] values at 0.1 and 0.5 μm underneath the plasma membrane and in the centre of the neuron (10 μm); mean cytoplasmic [ATP] (thick black curves); [ADP] at 0.1 μm under the membrane (light grey curves); and the Popen of KATP channels (thick dark grey curves). A, sodium accumulation after GluR activation and subsequent stimulation of Na+-K+-ATPase induced strong depletion in submembrane ATP. B, during metabolic poisoning with cyanide (CN−), ATP changes were identical in all points of the cytoplasm and coincided with the mean [ATP]. C, combined application of CN− and kainate (KA) produced stronger ATP depletion, ADP accumulation in submembrane regions and bigger increases in Popen. In the three simulations Popen values were close to those measured experimentally (Figs 2 and 3). D, the steady-state relationship between Na+-K+-ATPase activity, submembrane ATP and Popen. The curves were calculated using equations and parameters in Methods, and shown normalized to their maximal values.
Figure 9D presents the steady-state relationship between submembrane ATP depletion, Na+/K+-ATPase activity and Popen of KATP channels. Sodium accumulation steadily increased the pump activity and it was about half-maximal at 100 mm Na+. Submembrane ATP reflected the changes, but Popen increase was initially less steep. Minimal Popen≍ 0.1 was close to that measured at rest and Popen≍ 0.4 at 50 mm Na+. This indicates that measured peak sodium levels (Fig. 4) of about 35 mm (50 mm K+), 50 mm (10 μm AMPA), 25 mm (NMDA) and 15 mm (cyanide) could underline the observed changes in Popen (Figs 2B and 3).
Discussion
During synaptic transmission 90% of glutamate released into the synaptic cleft remains free and is only slowly removed (Rusakov et al. 2011). The prolonged presence of glutamate in the extracellular space can overexcite neurons. In the worst case a massive influx of calcium follows that can overload mitochondria (Mattson et al. 1989; Choi & Rothman, 1990; Abramov et al. 2007; Nicholls & Budd, 2000) and trigger programmed cell death (apoptosis). Milder actions include enhancement of neuronal excitability. CNS networks may then acquire pathological status characteristic, for example, for epilepsy (During & Spencer, 1993) and schizophrenia (Goff & Coyle, 2001).
Glutamate-mediated overexcitation of neurons can be dampened by KATP channels that link metabolic and neuronal activities, and are abundantly present in the brain (Liss & Roeper, 2001). It has formerly been assumed that the protective role of KATP channels is confined to hypoxia and ischaemia when aerobic ATP production ceases (Ben-Ari & Cossart, 2000; Krnjević, 2008). Recent studies indicate a pivotal role of KATP channels in the control of seizures (Hernández-Sánchez et al. 2001; Yamada et al. 2001), formation of contextual memory (Betourne et al. 2009) and novelty-dependent exploratory behaviour (Schiemann et al. 2012).
We observed a slow enhancement of KATP channel opening after stimulation of GluRs. In hippocampal neurons KATP channels were recorded in about every second patch, similar to that observed in the inspiratory brainstem neurons (Mironov et al. 1998). The initial activity was low (Popen < 0.1), such as only one opening level was apparently seen. New conductance levels (up to four) appeared after stimulation of GluRs (Fig. S1). Four open channels in the patch with 5 μm2 surface area correspond to about 103 channels in neurons with 10 μm radius. The value of Popen increases to ∼0.3, which would then correspond to IKATP= 3 nA at −40 mV that must be sufficient to dampen neuronal excitability through membrane hyperpolarization and increase in input resistance.
The functional link between GluRs and KATP channels can be mediated by different mechanisms (Fig. 10). GluRs stimulate signalling pathways related to calcium (Mattson et al. 1989; Choi & Rothman, 1990; Abramov et al. 2007), ROS (Avshalumov & Rice, 2003; Abramov et al. 2007; Bao et al. 2009) and osmotic effects (Delorenzo et al. 2005), but neither of them was involved in the GluR effects observed. Stimulation of KATP opening was abolished after blockade of sodium influx and Na+/K+-ATPase, which is consistent with ATP depletion that disinhibits KATP channels.
Figure 10. Glutamatergic receptors (GluR)-mediated pathways and KATP channels.
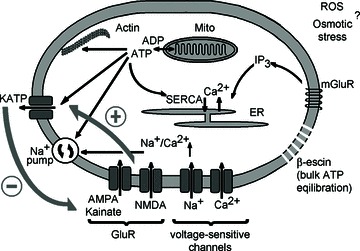
A cartoon depicts intracellular signalling pathways examined in this study. Activation of glutamate receptors induces membrane depolarization, activates calcium and sodium transmembrane fluxes that can cause osmotic stress. Ion homeostasis is restored by Na+-K+- and Ca2+-ATPases, and ATP can be also consumed during actin turnover. Mitochondria produce ATP and can generate reactive oxygen species (ROS) in a calcium-dependent fashion. Permeabilization of neurons with β-escin was used to examine KATP channel activities in clearly defined solution conditions. The thick dark grey arrows on the left indicate short-circuited feedback whereby GluR stimulation enhances KATP channel opening that can in turn dampen GluR-induced membrane depolarization. ER, endoplasmic reticulum.
The rate of ATP consumption in neurons at rest is ∼25 μm s−1, and this can increase by 10-fold when a neuron fires at 1 Hz (Attwell & Laughlin, 2001). Without persistent ATP production, the normal supplies of ATP (2 mm) will be exhausted within <2 min at rest and much faster when neurons fire action potentials (APs) even at moderate frequency. About 1/3 of ATP consumption within the cell is assigned to Na+/K+-ATPase (Rolfe & Brown, 1997; Ames, 2000). Its activation has been proposed to modulating KATP opening in many cell types (Welling, 1995; Ding et al. 1996; Priebe et al. 1996; Urbach et al. 1996; Haruna et al. 1998; Kabakov, 1998). Elevation of intracellular sodium during neuronal activity can activate Na+/K+-ATPase and KATP channels. In the inspiratory neurons the activity of KATP channels follows activity patterns (Haller et al. 2001).
Membrane depolarization stimulates sodium and calcium transmembrane fluxes. K+-depolarization and GluRs increased intracellular sodium by 20–50 mm (Fig. 5). GluRs induce membrane depolarization activating voltage-sensitive sodium channels and provide permeation pathways via AMPA/kainate and NMDA receptors. Blockade of INa by TTX strongly diminished sodium accumulation (Fig. 4B) and KATP channel opening (Fig. 3B), which indicates prevailing depolarization effects. Depolarization-induced calcium increases should impose smaller metabolic demand. Free Ca2+ increases to 1 μm correspond to ∼1 mm elevations in total Ca2+, and recovery to resting levels apparently needs less ATP. This estimate can explain the smaller effects of blockade of SERCA with thapsigargin (Fig. 3B).
We examined cross-talk between GluRs and KATP channels in the soma (cell-attached recordings), but the effects in synapses may be more important. Whole-cell recordings revealed the functional presence of both pre- and postsynaptic KATP channels (Matsumoto et al. 2002; Soundarapandian et al. 2007; Krnjević, 2008). They may sense ATP changes driven by Na+/K+-ATPase after sodium accumulation produced by Na+ channels at the presynaptic side and GluRs at the postsynaptic ending. Both synaptic elements are small (∼0.1 μm3 volume), and single EPSP or presynaptic APs are estimated to increase sodium by ∼0.3 mm and decrease ATP by ∼0.1 mm (Attwell & Laughlin, 2001). Because sodium increases are long lasting (Regehr, 1997; Lamy & Chatton, 2011; Fig. 4), the barrage of EPSPs and APs can activate perisynaptic KATP channels more strongly. Such effects can orchestrate neuronal responses under various physiological and pathological conditions.
Depletion of ATP is not a sole factor that can modulate KATP channels. ATP hydrolysis produces ADP that stimulates the channels (Hopkins et al. 1992). Complex interactions of ATP and ADP with KATP channels have been well documented in many studies (cf. Proks & Ashcroft, 2009 for recent review). Our experiments in the OC configuration indicated synergistic contribution of ATP-mediated inhibition and ADP-induced stimulation in activation of KATP channels (Fig. 7).
Analysis of interdependence between sodium pump activity, ATP, ADP and channel opening was made using the model with a minimum of free parameters. Their values were estimated from the literature and supported by ATP measurements. The model predicted uniform [ATP] decrease after metabolic poisoning. GluR-induced sodium accumulation and concomitant activation of Na+/K+-ATPase produced strong ATP decreases within a 0.1 μm-thick submembrane space. ATP depletion underneath the plasma membrane has been proposed for other cell types (Aw & Jones, 1985; Weiss & Lamp, 1989; Kennedy et al. 1999; Gribble et al. 2000; Alekseev et al. 2012). Our model reasonably explains experimental data, but it is yet oversimplified. Many important factors, such as detailed kinetics of ATP-dependent processes, unstirred submembrane layers, compartmentalization of ATP production and consumption, etc. were not explicitly taken into account. Their consideration at present would complicate the interpretation of data, but aforementioned features can be considered in numerical experiments that will constitute extensive simulation study.
It is plausible to assume that activation of KATP channels during hypoxia is mainly caused by stopping aerobic ATP production within the mitochondria. In the functionally active brainstem slices the effects of hypoxia and kainate were strikingly similar. The data imply about equal effects of GluR stimulation and blockade of aerobic ATP production in activating KATP channels during hypoxia. Seizure-like activity induced Mg2+-free solutions in hippocampal slices was accompanied by ATP decrease and activation of KATP channels. Both AMPA/kainate and NMDA receptors are known to contribute to the onset of seizures (Avoli et al. 2002). Recent simulations (Krishnan & Bazhenov, 2011) propose significant effects of sodium accumulation in termination of seizures. KATP channels would then close the loop GluR→Sodium→Na+/K+-ATPase→ATP/ADP.
In summary, we propose that GluRs enhance KATP channel opening after submembrane depletion of ATP and accumulation of ADP following brief periods of neuronal activity triggered or accompanied by glutamate release. Enhanced ATP turnover will then maintain KATP channel opening until glutamate levels in the extracellular space dissipate and cytoplasmic sodium levels subside to normal. Activation of KATP channels can shape neuronal activity and dampen uncontrolled excitation. This feature may gain special importance in neurons in the brain, with the highest spontaneous activity having the highest metabolic rate. Neurons involved in the generation of persistent motor activity (preBötC), processing and storage of information (hippocampus) and dopaminergic neurons in the substantia nigra (Schiemann et al. 2012) are perhaps the best currently known examples.
Acknowledgments
The authors are grateful to Nicole Hartelt for the expert technical assistance, H. Imamura for a generous gift of ATP sensor, and S. Kügler for help with neuron-specific viral sensors. The work was supported by DFG grant MI 685/2-1 and funded by Deutsche Forschungsgemeinschaft through the DFG-Research Center for Molecular Physiology of the Brain.
Glossary
- ACSF
artificial cerebrospinal fluid
- AM
acetomethoxy
- AP
action potential
- CaL
voltage-sensitive L-type calcium channels
- CNQX
6-cyano-7-nitroquinoxaline-2,3-dione
- FRET
fluorescence resonance energy transfer
- GluR
glutamatergic receptor
- KATP
ATP-sensitive K+ channels
- OC
open-cell
- Popen
open state probability
- preBötC
pre-Bötzinger complex
- ROS
reactive oxygen species
- XII
hypoglossal nucleus
Author contributions
S.L.M. conceived the project and designed the experiments. R.M. performed all patch-clamp experiments in cultured neurons; S.L.M. recorded from the brainstem slices and measured intracellular sodium. J.T. constructed neuron-targeted sensors, and performed ROS and ATP imaging. S.L.M. evaluated the data and wrote the manuscript. The authors discussed the results and commented on the manuscript.
Supplementary material
Supporting information Fig. S1
Supporting information Fig. S2
Supporting information Fig. S3
Supporting information Fig. S4
References
- Abramov AY, Scorziello A, Duchen MR. Three distinct mechanisms generate oxygen free radicals in neurons and contribute to cell death during anoxia and reoxygenation. J Neurosci. 2007;27:1129–1138. doi: 10.1523/JNEUROSCI.4468-06.2007. [DOI] [PMC free article] [PubMed] [Google Scholar]
- Alekseev AE, Reyes S, Selivanov VA, Dzeja PP, Terzic A. Compartmentation of membrane processes and nucleotide dynamics in diffusion-restricted cardiac cell microenvironment. J Mol Cell Cardiol. 2012;52:401–419. doi: 10.1016/j.yjmcc.2011.06.007. [DOI] [PMC free article] [PubMed] [Google Scholar]
- Ames A. CNS energy metabolism as related to function. Brain Res Rev. 2000;34:42–68. doi: 10.1016/s0165-0173(00)00038-2. [DOI] [PubMed] [Google Scholar]
- Attwell D, Laughlin SB. An energy budget for signaling in the grey matter of the brain. J Cereb Blood Flow Metab. 2001;21:1133–1145. doi: 10.1097/00004647-200110000-00001. [DOI] [PubMed] [Google Scholar]
- Avoli M, D’Antuono M, Louvel J, Köhling R, Biagini G, Pumain R, D’Arcangelo G, Tancredi V. Network and pharmacological mechanisms leading to epileptiform synchronization in the limbic system in vitro. Prog Neurobiol. 2002;68:167–207. doi: 10.1016/s0301-0082(02)00077-1. [DOI] [PubMed] [Google Scholar]
- Avshalumov MV, Rice ME. Activation of ATP-sensitive K channels by H2O2 underlies glutamate-dependent inhibition of striatal dopamine release. Proc Natl Acad Sci U S A. 2003;100:11729–11734. doi: 10.1073/pnas.1834314100. [DOI] [PMC free article] [PubMed] [Google Scholar]
- Aw TY, Jones DP. ATP concentration gradients in cytosol of liver cells during hypoxia. Am J Physiol Cell Physiol. 1985;249:C385–C392. doi: 10.1152/ajpcell.1985.249.5.C385. [DOI] [PubMed] [Google Scholar]
- Bao L, Avshalumov MV, Patel JC, Lee CR, Miller EW, Chang CJ, Rice ME. Mitochondria are the source of hydrogen peroxide for dynamic brain-cell signaling. J Neurosci. 2009;29:9002–9010. doi: 10.1523/JNEUROSCI.1706-09.2009. [DOI] [PMC free article] [PubMed] [Google Scholar]
- Ben-Ari Y, Cossart R. Kainate, a double agent that generates seizures: two decades of progress. Trends Neurosci. 2000;23:580–587. doi: 10.1016/s0166-2236(00)01659-3. [DOI] [PubMed] [Google Scholar]
- Betourne A, Bertholet AM, Labroue E, Halley H, Sun HS, Lorsignol A, Feng ZP, French RJ, Penicaud L, Lassalle JM, Frances B. Involvement of hippocampal CA3 KATP channels in contextual memory. Neuropharmacology. 2009;56:615–625. doi: 10.1016/j.neuropharm.2008.11.001. [DOI] [PubMed] [Google Scholar]
- Carrasco AJ, Dzeja PP, Alekseev AE, Pucar D, Zingman LV, Abraham MR, Hodgson D, Bienengraeber M, Puceat M, Janssen E, Wieringa B, Terzic A. Adenylate kinase phosphotransfer communicates cellular energetic signals to ATP-sensitive potassium channels. Proc Natl Acad Sci U S A. 2001;98:7623–7628. doi: 10.1073/pnas.121038198. [DOI] [PMC free article] [PubMed] [Google Scholar]
- Choi DW, Rothman SM. The role of glutamate neurotoxicity in hypoxic-ischemic neuronal death. Annu Rev Neurosci. 1990;13:171–182. doi: 10.1146/annurev.ne.13.030190.001131. [DOI] [PubMed] [Google Scholar]
- Delorenzo RJ, Sun DA, Deshpande LS. Cellular mechanisms underlying acquired epilepsy: the calcium hypothesis of the induction and maintainance of epilepsy. Pharmacol Ther. 2005;105:229–266. doi: 10.1016/j.pharmthera.2004.10.004. [DOI] [PMC free article] [PubMed] [Google Scholar]
- Ding WG, He LP, Omatsu-Kanbe M, Kitasato H. A possible role of the ATP-sensitive potassium ion channel in determining the duration of spike-bursts in mouse pancreatic beta-cells. Biochim Biophys Acta. 1996;1279:219–226. doi: 10.1016/0005-2736(95)00249-9. [DOI] [PubMed] [Google Scholar]
- During MJ, Spencer DD. Extracellular hippocampal glutamate and spontaneous seizure in the conscious human brain. Lancet. 1993;341:1607–1610. doi: 10.1016/0140-6736(93)90754-5. [DOI] [PubMed] [Google Scholar]
- Erecinska M, Cherian C, Silver I. Brain development and susceptibility to damage; ion levels and movements. Curr Top Dev Biol. 2005;69:139–186. doi: 10.1016/S0070-2153(05)69006-0. [DOI] [PubMed] [Google Scholar]
- Feldman JL, Del Negro CA. Looking for inspiration: new perspectives on respiratory rhythm. Nat Rev Neurosci. 2006;7:232–242. doi: 10.1038/nrn1871. [DOI] [PMC free article] [PubMed] [Google Scholar]
- Fonnum F. Glutamate: a neurotransmitter in mammalian brain. J Neurochem. 1984;42:1–11. doi: 10.1111/j.1471-4159.1984.tb09689.x. [DOI] [PubMed] [Google Scholar]
- Goff DC, Coyle JT. The emerging role of glutamate in the pathophysiology and treatment of schizophrenia. Am J Psychiatry. 2001;158:1367–1377. doi: 10.1176/appi.ajp.158.9.1367. [DOI] [PubMed] [Google Scholar]
- Gribble FM, Loussouarn G, Tucker SJ, Zhao C, Nichols CG, Ashcroft FM. A novel method for measurement of submembrane ATP concentration. J Biol Chem. 2000;275:30046–30049. doi: 10.1074/jbc.M001010200. [DOI] [PubMed] [Google Scholar]
- Grynkiewicz G, Poenie M, Tsien RY. A new generation of Ca2+ indicators with greatly improved fluorescence properties. J Biol Chem. 1985;260:3440–3450. [PubMed] [Google Scholar]
- Haller M, Mironov SL, Karschin A, Richter DW. Dynamic activation of K(ATP) channels in rhythmically active neurons. J Physiol. 2001;537:69–81. doi: 10.1111/j.1469-7793.2001.0069k.x. [DOI] [PMC free article] [PubMed] [Google Scholar]
- Hanson GT, Aggeler R, Oglesbee D, Cannon M, Capaldi RA, Tsien RY, Remington SJ. Investigating mitochondrial redox potential with redox-sensitive green fluorescent protein indicators. J Biol Chem. 2004;279:13044–13053. doi: 10.1074/jbc.M312846200. [DOI] [PubMed] [Google Scholar]
- Hartelt N, Skorova E, Manzke T, Suhr M, Mironova L, Kügler S, Mironov SL. Imaging of respiratory network topology in living brain slices. Mol Cell Neurosci. 2008;37:425–431. doi: 10.1016/j.mcn.2007.10.011. [DOI] [PubMed] [Google Scholar]
- Haruna T, Horie M, Kouchi I, Nawada R, Tsuchiya K, Akao M, Otani H, Murakami T, Sasayama S. Coordinate interaction between ATP-sensitive K+ channel and Na+, K+-ATPase modulates ischemic preconditioning. Circulation. 1998;98:2905–2910. doi: 10.1161/01.cir.98.25.2905. [DOI] [PubMed] [Google Scholar]
- Hernández-Sánchez C, Basile AS, Fedorova I, Arima H, Stannard B, Fernandez AM, Ito Y, LeRoith D. Mice transgenically overexpressing sulfonylurea receptor 1 in forebrain resist seizure induction and excitotoxic neuron death. Proc Natl Acad Sci U S A. 2001;98:3549–3554. doi: 10.1073/pnas.051012898. [DOI] [PMC free article] [PubMed] [Google Scholar]
- Hopkins W, Fatherazi S, Peter-Riesch B, Corkey B, Cook D. Two sites for adenine-nucleotide regulation of ATP-sensitive potassium channels in mouse pancreatic ß-cells and HIT cells. J Membr Biol. 1992;129:287–295. doi: 10.1007/BF00232910. [DOI] [PubMed] [Google Scholar]
- Imamura H, Nhat KP, Togawa H, Saito K, Iino R, Kato-Yamada Y, Nagai T, Noji H. Visualization of ATP levels inside single living cells with fluorescence resonance energy transfer-based genetically encoded indicators. Proc Natl Acad Sci U S A. 2009;106:15651–15656. doi: 10.1073/pnas.0904764106. [DOI] [PMC free article] [PubMed] [Google Scholar]
- Kabakov AY. Activation of KATP channels by Na/K pump in isolated cardiac myocytes and giant membrane patches. Biophys J. 1998;75:2858–2867. doi: 10.1016/S0006-3495(98)77728-8. [DOI] [PMC free article] [PubMed] [Google Scholar]
- Kennedy HJ, Pouli AE, Ainscow EK, Jouaville LS, Rizzuto R, Rutter GA. Glucose generates sub-plasma membrane ATP microdomains in single islet beta-cells. Potential role for strategically located mitochondria. J Biol Chem. 1999;274:13281–13291. doi: 10.1074/jbc.274.19.13281. [DOI] [PubMed] [Google Scholar]
- Krishnan GP, Bazhenov M. Ionic dynamics mediate spontaneous termination of seizures and postictal depression state. J Neurosci. 2011;31:8870–8882. doi: 10.1523/JNEUROSCI.6200-10.2011. [DOI] [PMC free article] [PubMed] [Google Scholar]
- Krnjević K. Electrophysiology of cerebral ischemia. Neuropharmacology. 2008;55:319–333. doi: 10.1016/j.neuropharm.2008.01.002. [DOI] [PubMed] [Google Scholar]
- Lamy CM, Chatton JY. Optical probing of sodium dynamics in neurons and astrocytes. Neuroimage. 2011;58:572–578. doi: 10.1016/j.neuroimage.2011.06.074. [DOI] [PubMed] [Google Scholar]
- Lipton P. Ischemic cell death in brain neurons. Physiol Rev. 1999;79:1431–1568. doi: 10.1152/physrev.1999.79.4.1431. [DOI] [PubMed] [Google Scholar]
- Liss B, Roeper J. Molecular physiology of neuronal K-ATP channels. Mol Membr Biol. 2001;18:117–127. [PubMed] [Google Scholar]
- Liu Y, Gutterman DD. Oxidative stress and potassium channel function. Clin Exp Pharmacol Physiol. 2002;29:305–311. doi: 10.1046/j.1440-1681.2002.03649.x. [DOI] [PubMed] [Google Scholar]
- Magnus G, Keizer J. Model of ß-cell mitochondrial calcium handling and electrical activity. I. Cytoplasmic variables. Am J Physiol Cell Physiol. 1998;274:C1158–C1173. doi: 10.1152/ajpcell.1998.274.4.C1158. [DOI] [PubMed] [Google Scholar]
- Martins AS, Shkryl VM, Nowycky MC, Shirokova N. Reactive oxygen species contribute to calcium signals produced by osmotic stress in mouse skeletal muscle fibres. J Physiol. 2008;586:197–210. doi: 10.1113/jphysiol.2007.146571. [DOI] [PMC free article] [PubMed] [Google Scholar]
- Matsumoto N, Komiyama S, Akaike N. Pre- and postsynaptic ATP-sensitive potassium channels during metabolic inhibition of rat hippocampal CA1 neurons. J Physiol. 2002;541:511–520. doi: 10.1113/jphysiol.2002.018267. [DOI] [PMC free article] [PubMed] [Google Scholar]
- Mattson MP, Guthrie PB, Kater SB. Intrinsic factors in the selective vulnerability of hippocampal pyramidal neurons. Prog Clin Biol Res. 1989;317:333–351. [PubMed] [Google Scholar]
- Mironov SL. Plasmalemmal and intracellular Ca2+ pumps as main determinants of slow calcium buffering in rat hippocampal neurones. Neuropharmacology. 1995;34:1123–1132. doi: 10.1016/0028-3908(95)00080-p. [DOI] [PubMed] [Google Scholar]
- Mironov SL. ADP regulates movements of mitochondria in neurons. Biophys J. 2007;92:2944–2952. doi: 10.1529/biophysj.106.092981. [DOI] [PMC free article] [PubMed] [Google Scholar]
- Mironov SL, Langohr K. Mechanisms of Na+ and Ca2+ influx into respiratory neurons during hypoxia. Neuropharmacology. 2005;48:1056–1065. doi: 10.1016/j.neuropharm.2005.01.021. [DOI] [PubMed] [Google Scholar]
- Mironov SL, Langohr K. Modulation of synaptic and channel activities in the respiratory network of the mice by NO/cGMP signalling pathways. Brain Res. 2007;1130:73–82. doi: 10.1016/j.brainres.2006.09.114. [DOI] [PubMed] [Google Scholar]
- Mironov SL, Langohr K, Haller M, Richter DW. Hypoxia activates ATP-dependent potassium channels in inspiratory neurones of neonatal mice. J Physiol. 1998;509:755–766. doi: 10.1111/j.1469-7793.1998.755bm.x. [DOI] [PMC free article] [PubMed] [Google Scholar]
- Mironov SL, Richter DW. Intracellular signalling pathways modulate K(ATP) channels in inspiratory brainstem neurones and their hypoxic activation: involvement of metabotropic receptors, G-proteins and cytoskeleton. Brain Res. 2000;853:60–67. doi: 10.1016/s0006-8993(99)02234-9. [DOI] [PubMed] [Google Scholar]
- Mironov SL, Skorova E, Hartelt N, Mironova LA, Hasan MT, Kugler S. Remodelling of the respiratory network in a mouse model of Rett syndrome depends on brain-derived neurotrophic factor regulated slow calcium buffering. J Physiol. 2009;587:2473–2485. doi: 10.1113/jphysiol.2009.169805. [DOI] [PMC free article] [PubMed] [Google Scholar]
- Mironov SL, Skorova EY. Stimulation of bursting in pre-Bötzinger neurons by Epac through calcium release and modulation of TRPM4 and K-ATP channels. J Neurochem. 2011;117:295–308. doi: 10.1111/j.1471-4159.2011.07202.x. [DOI] [PubMed] [Google Scholar]
- Nicholls DG, Budd SL. Mitochondria and neuronal survival. Physiol Rev. 2000;80:315–360. doi: 10.1152/physrev.2000.80.1.315. [DOI] [PubMed] [Google Scholar]
- Nichols CG, Lederer WJ. The regulation of ATP-sensitive K+ channel activity in intact and permeabilized rat ventricular myocytes. J Physiol. 1990;423:91–110. doi: 10.1113/jphysiol.1990.sp018013. [DOI] [PMC free article] [PubMed] [Google Scholar]
- Noma A. ATP-regulated K+-channels in cardiac muscle. Nature. 1983;305:147–148. doi: 10.1038/305147a0. [DOI] [PubMed] [Google Scholar]
- Nowycky MC, Fox AP, Tsien RW. Long-opening mode of gating of neuronal calcium channels and its promotion by the dihydropyridine calcium agonist Bay K 8644. Proc Natl Acad Sci U S A. 1985;82:2178–2182. doi: 10.1073/pnas.82.7.2178. [DOI] [PMC free article] [PubMed] [Google Scholar]
- Olney JW, de Gubareff T. Glutamate neurotoxicity and Huntington's chorea. Nature. 1978;271:557–559. doi: 10.1038/271557a0. [DOI] [PubMed] [Google Scholar]
- Palmer AE, Tsien RY. Measuring calcium signaling using genetically targetable fluorescent indicators. Nat Protoc. 2006;1:1057–1065. doi: 10.1038/nprot.2006.172. [DOI] [PubMed] [Google Scholar]
- Priebe L, Friedrich M, Benndorf K. Functional interaction between K(ATP) channels and the Na-K-pump in metabolically inhibited heart cells of the guinea-pig. J Physiol. 1996;492:405–417. doi: 10.1113/jphysiol.1996.sp021317. [DOI] [PMC free article] [PubMed] [Google Scholar]
- Proks P, Ashcroft FM. Modeling K(ATP) channel gating and its regulation. Prog Biophys Mol Biol. 2009;99:7–31. doi: 10.1016/j.pbiomolbio.2008.10.002. [DOI] [PubMed] [Google Scholar]
- Regehr WG. Interplay between sodium and calcium dynamics in granule cell presynaptic terminals. Biophys J. 1997;73:2476–2488. doi: 10.1016/S0006-3495(97)78276-6. [DOI] [PMC free article] [PubMed] [Google Scholar]
- Richter DW, Schmidt-Garcon P, Pierrefiche O, Bischoff AM, Lalley PM. Neurotransmitters and neuromodulators controlling the hypoxic respiratory response in anaesthetized cats. J Physiol. 1999;514:567–578. doi: 10.1111/j.1469-7793.1999.567ae.x. [DOI] [PMC free article] [PubMed] [Google Scholar]
- Rolfe DFS, Brown GC. Cellular energy utilization and molecular origin of standard metabolic rate in mammals. Physiol Rev. 1997;77:731–758. doi: 10.1152/physrev.1997.77.3.731. [DOI] [PubMed] [Google Scholar]
- Rusakov DA, Savtchenko LP, Zheng K, Henley JM. Shaping the synaptic signal: molecular mobility inside and outside the cleft. Trends Neurosci. 2011;34:359–369. doi: 10.1016/j.tins.2011.03.002. [DOI] [PMC free article] [PubMed] [Google Scholar]
- Schiemann J, Schlaudraff F, Klose V, Bingmer M, Seino S, Magill PJ, Zaghloul KA, Schneider G, Liss B, Roeper J. K-ATP channels in dopamine substantia nigra neurons control bursting and novelty-induced exploration. Nat Neurosci. 2012;15:1272–1280. doi: 10.1038/nn.3185. [DOI] [PMC free article] [PubMed] [Google Scholar]
- Shyng SL, Nichols CG. Membrane phospholipid control of nucleotide sensitivity of KATP channels. Science. 1998;282:1138–1141. doi: 10.1126/science.282.5391.1138. [DOI] [PubMed] [Google Scholar]
- Smith JC, Ellenberger HH, Ballanyi K, Richter DW, Feldman JL. Pre-Bötzinger complex: a brainstem region that may generate respiratory rhythm in mammals. Science. 1991;254:726–729. doi: 10.1126/science.1683005. [DOI] [PMC free article] [PubMed] [Google Scholar]
- Soundarapandian MM, Zhong X, Peng L, Wu D, Lu Y. Role of K(ATP) channels in protection against neuronal excitatory insults. J Neurochem. 2007;103:1721–1729. doi: 10.1111/j.1471-4159.2007.04963.x. [DOI] [PubMed] [Google Scholar]
- Stone AJ. A proposed model for the Na+ pump. Biochim Biophys Acta. 1968;150:578–586. doi: 10.1016/0005-2736(68)90047-3. [DOI] [PubMed] [Google Scholar]
- Stoppini L, Buchs PA, Muller D. A simple method for organotypic cultures of nervous tissue. J Neurosci Meth. 1991;37:173–182. doi: 10.1016/0165-0270(91)90128-m. [DOI] [PubMed] [Google Scholar]
- Tarasov AI, Welters HJ, Senkel S, Ryffel GU, Hattersley AT, Morgan NG, Ashcroft FM. A Kir6.2 mutation causing neonatal diabetes impairs electrical activity and insulin secretion from INS-1 beta-cells. Diabetes. 2006;55:3075–3082. doi: 10.2337/db06-0637. [DOI] [PubMed] [Google Scholar]
- Urbach V, Van KE, Maguire D, Harvey BJ. Cross-talk between ATP-regulated K+ channels and Na+ transport via cellular metabolism in frog skin principal cells. J Physiol. 1996;491:99–109. doi: 10.1113/jphysiol.1996.sp021199. [DOI] [PMC free article] [PubMed] [Google Scholar]
- Vandenberg CA. Inward rectification of a potassium channel in cardiac ventricular cells depends on internal magnesium ions. Proc Natl Acad Sci U S A. 1987;84:2560–2564. doi: 10.1073/pnas.84.8.2560. [DOI] [PMC free article] [PubMed] [Google Scholar]
- Weiss JN, Lamp ST. Cardiac ATP-sensitive K channels. Evidence for preferential regulation by glycolysis. J Gen Physiol. 1989;94:911–935. doi: 10.1085/jgp.94.5.911. [DOI] [PMC free article] [PubMed] [Google Scholar]
- Welling PA. Cross-talk and the role of KATP channels in the proximal tubule. Kidney Int. 1995;48:1017–1023. doi: 10.1038/ki.1995.384. [DOI] [PubMed] [Google Scholar]
- Werner FM, Coveñas R. Classical neurotransmitters and neuropeptides involved in generalized epilepsy: a focus on antiepileptic drugs. Curr Med Chem. 2011;18:4933–4948. doi: 10.2174/092986711797535191. [DOI] [PubMed] [Google Scholar]
- Winslow JL, Cooper RL, Atwood HL. Intracellular ionic concentration by calibration from fluorescence indicator emission spectra, its relationship to the K(d), F(min), F(max) formula, and use with Na-Green for presynaptic sodium. J Neurosci Methods. 2002;118:163–175. doi: 10.1016/s0165-0270(02)00100-0. [DOI] [PubMed] [Google Scholar]
- Yamada K, Ji JJ, Yuan H, Miki T, Sato S, Horimoto N, Shimizu T, Seino S, Inagaki N. Protective role of ATP-sensitive potassium channels in hypoxia-induced generalized seizure. Science. 2001;292:1543–1546. doi: 10.1126/science.1059829. [DOI] [PubMed] [Google Scholar]
Associated Data
This section collects any data citations, data availability statements, or supplementary materials included in this article.


