

Abstract
In the search for cochlear correlates of auditory masking by noise stimuli, we recorded basilar membrane (BM) vibrations evoked by either tone or click signals in the presence of varying levels of background noise. The BM vibrations were recorded from basal regions in healthy cochleae of anaesthetized chinchilla and gerbil. Non-linear interactions that could underpin various aspects of psychophysical masking data, including both compression and suppression at the BM level, were observed. The suppression effects, whereby the amplitude of the responses to each stimulus component could be reduced, depended on the relative intensities of the noise and the tones or clicks. Only stimulus components whose frequencies fell inside the non-linear region of the recording site, i.e. around its characteristic frequency (CF), were affected by presentation of the ‘suppressing’ stimulus (which could be either the tone or the noise). Mutual suppression, the simultaneous reduction of the responses to both tones and noise components, was observed under some conditions, but overall reductions of BM vibration were rarely observed. Moderate- to high-intensity tones suppressed BM responses to low-intensity Gaussian stimuli, including both broadband and narrowband noise. Suppression effects were larger for spectral components of the noise response that were closer to the CF. In this regime, the tone and noise stimuli became the suppressor and probe signals, respectively. This study provides the first detailed observations of cochlear mechanical correlates of the masking effects of noise. Mechanical detection thresholds for tone signals, which were arbitrarily defined using three criteria, are shown to increase in almost direct proportion to the noise level for low and moderately high noise levels, in a manner that resembles the findings of numerous psychophysical observations.
Key points
Basilar membrane responses to tone and noise stimuli presented simultaneously were measured in chinchillas and a gerbil. Overall responses increase monotonically with stimulus level in a compressive manner.
Response components elicited by the weaker stimulus, whether tone or noise, were reduced by the stronger one. That is, the suppressor stimulus could be either the tone or the noise. Suppression by noise stimuli occurred only when the tone frequency was in the non-linear region of the basilar membrane recording site.
Basilar membrane responses to click and noise stimuli were also recorded in some experiments. The click response component was suppressed by the noise.
Mutual suppression, meaning the simultaneous suppression of the tone and noise response components, was also observed under certain stimulus conditions.
Detection thresholds of the tone stimuli increased in a near-linear fashion with noise level increments.
Introduction
The perception of sounds embedded in a noisy background poses a frequent challenge in everyday life and has been the subject of much work in the field of psychophysics. The higher the noise level, the more difficult it becomes to understand or detect a given target, or probe signal. By assigning detection thresholds to speech samples and pure tone signals, Hawkins & Stevens (1950) found that to maintain detectability, any given increase in noise level required an equal increase in signal level. In other words, the level of the signal relative to the level of the noise, i.e. the signal-to-noise ratio (SNR) at the threshold of detectability, remains constant (Stevens, 1998). In this regard, noise masking appears to be the result of linear processing.
The decrease in detectability of a probe signal caused by presentation of noise, also known as masking in the psychophysics literature, occurs not only in hearing but also in another senses, such as in the visual (see Enns & Di Lollo, 2000 for a review) and somatosensory (e.g. Bhattacharjee et al. 2010) systems. Understanding the physiological correlates of masking is an important topic that has been investigated in both the peripheral and central auditory system (e.g. Rhode et al. 1978; Abbas, 1981; Costalupes. 1985; Gai & Carney, 2006). Both excitatory (i.e. ‘line busy’) and suppressive aspects of the neural data have been implicated in masking under different conditions (e.g. Delgutte, 1990), and several studies have specifically suggested that cochlear mechanical suppression might contribute to the masking of sounds by white noise. However, the linearity of noise masking is difficult to reconcile with non-linear processing in the cochlea. The nature of the relationship between masking of sounds by noise signals and mechanical suppression in the cochlea remains unclear.
A great deal of what it is known about cochlear processing comes from direct measurements of the basilar membrane (BM), a flexible, tuned structure that runs along the cochlea and supports the hearing organ, the organ of Corti. Although BM responses to Gaussian noise have been recorded in laboratory animals by at least two groups (guinea pig: de Boer & Nuttall, 1997, 2000; chinchilla: Recio-Spinoso et al. 2009), the effects of mechanical suppression by white noise on BM responses to single tones or clicks are unknown. Comparisons between BM responses to noise alone and responses to either tones or clicks alone have shown striking similarities, which are unexpected from a non-linear system such as the cochlea. In addition, first-order Wiener kernels (Marmarelis & Marmarelis, 1978) obtained from responses to white Gaussian noise permitted remarkably accurate predictions of responses to frozen noise samples at the same spectral level (Recio-Spinoso et al. 2009) – a property of linear systems.
Although the above results suggest a ‘linearization’ of the cochlea's non-linear mechanics by white noise stimulation, this type of near-linear behaviour may not be extrapolated to the cochlear filtering of tonal signals presented simultaneously with white noise (de Boer & Kruidenier, 1990). Here we describe non-linear interactions in BM responses when the mammalian cochlea is simultaneously stimulated with tonal or click stimuli and frozen samples of white or narrowband noise stimuli. More specifically, we show here that BM responses to either stimulus can be suppressed by simultaneous presentation of the other, if appropriate stimulus levels and frequencies are chosen.
For a fixed tone level, we show that the BM response to the tone decreases as a function of increasing noise level at an approximate rate of 1 dB/dB. The characterization of BM responses to tone and noise stimuli using a measure of signal-to-noise ratio (SNR) indicates that the SNR remains constant when the levels of both stimuli increase by the same amount over a relatively wide range of noise levels (≤30 dB). While the former observation is a straightforward consequence of the non-linear behaviour of the cochlea, the latter result indicates a more intricate, quasi-linear aspect of cochlear processing. A preliminary report of this work was published as proceedings of a conference (Recio-Spinoso & Lopez-Poveda, 2010).
Methods
Experiments were performed on a total of six chinchillas (400–700 g; age range approximately 3–36 months) and one gerbil (87 g; approximately 6 months old). Two of the chinchillas were supplied and used at the University of Wisconsin-Madison in the USA; the remaining animals were supplied and used at Keele University in the UK. The care and use of animals in this study were approved by the Animal Care and Use Committees of the University of Wisconsin and Keele University, and the UK experiments were carried out under licence from the Home Office. Details of surgical and recording methods for this type of experiment are given elsewhere (e.g. Cooper, 1999; Recio & Rhode, 2000; Rhode & Recio, 2000) and are only outlined here.
Animal preparation
Animals were anaesthetized using an initial dose of sodium pentobarbital (75 mg kg-1, i.p., Sigma-Aldrich) and additional smaller doses were given as needed to maintain the animal in a deeply areflexive state. All animals were tracheotomised and intubated, but forced ventilation was usually unnecessary. Normal body temperature was maintained at 37°C via a heating pad servo-controlled by a rectal probe. The left pinna was resected and the bulla was widely opened. A silver-wire electrode was placed on or near the round window to record compound action potentials (CAPs) evoked by tone bursts at frequencies usually between 500 Hz and 16 kHz. CAP audiograms were estimated manually using oscilloscope recordings (University of Wisconsin) or automatically using a computer-controlled procedure (Keele University).
A small hole made in the basal turn of the otic capsule allowed direct visualization of the basilar membrane and placement of a few micro-beads (diameter: 10–30 μm) to serve as reflecting targets for the displacement-sensitive heterodyne laser interferometer (Cooper, 1999). BM vibrations were measured after covering the hole in the otic capsule with a small window made from cover slip glass. At the end of the experiments each animal was killed with a high dose of sodium pentobarbital.
Acoustic stimulation
Acoustic stimuli were generated using a personal computer in conjunction with two 16-bit digital-to-analog converters and an attenuator system (Tucker-Davis Technologies, Alachua, Florida, USA) at sampling rates of 100 or 200 kHz. Stimuli were presented closed-field from two reverse driven condenser microphone cartridges (Brüel & Kjær 4134 with square-root compensation, Nærum, Denmark). Sound-pressure levels (measured in dB SPL) were monitored within 2 mm of the tympanic membrane using a probe tube microphone.
Stimuli used in this project include single tones, clicks (20 μs duration) and frozen samples of Gaussian noise (generated using the ‘randn’ function in MATLAB® by MathWorks, Natick, Massachusetts, USA). Noise levels are expressed using ‘effective sound pressure levels in decibels’ (dB eSPL), which were computed using the ear-canal tone calibration data and the stimulus waveforms as described by Recio & Rhode (2000). Click levels are expressed as peak-equivalent SPL (dB pSPL) and were determined from middle-ear velocity responses to clicks and tones: the pSPL of a click corresponds to the SPL of a CF-tone with the same amplitude vibration. The spectrum of the frozen noise was either broadband or narrowband (bandwidth = 0.5 octaves, geometrically centred at the characteristic frequency). Gaussian noise and either tone or click stimuli were presented separately via two Brüel & Kjær 4134 condenser microphones and acoustically coupled at the ear canal.
Data processing
Signals from the laser interferometer were sampled at a 250 kHz sampling rate using a 16-bit data acquisition card (Analogic Fast-16, USA). At the beginning of each experiment, BM responses to low-intensity single tones were used to determine the characteristic frequency (CF; most sensitive frequency) of the site under study.
Two stimulus protocols were used for recording BM responses to tones and noise signals presented simultaneously. (Henceforth, we will refer to this type of stimulus as tone+noise.) For experiments at the University of Wisconsin, the polarity of the frozen noise samples was inverted for every stimulus presentation. Both stimuli were of equal duration (30 ms) and were presented once every 100 ms. Suppression effects by the white noise stimulus were estimated by comparing the average BM response to the tone+noise stimuli with the responses to tones alone.
For experiments at Keele University, the frozen noise and tone signals had different durations. The onset of the 50 ms noise signal was delayed by 10 ms relative to the 65 ms tone signal. The noise signal consisted of four sequential segments of 5, 20, 20 and 5 ms duration. The second and third segment had the same values, but with an inverted sign. Narrowband noise, generated by digitally filtering the frozen broadband noise, was also used as a stimulus in some animals. During the experiment, average BM responses were computed from 32 stimulus repetitions. A 20 ms sample array was then obtained from that average experimental response by averaging the responses to the two middle segments in the noise stimulus. Since the polarities of the noise stimulus reversed in these two segments, this secondary averaging process amounted to a noise-cancellation procedure. Fourier transformation of the resulting 20 ms noise-cancelled array yielded an estimate of the suppression effects caused by the noise stimulus.
Signal-to-noise ratios (SNRs) were computed from BM responses to tone+noise signals. SNRs were expressed in decibels and represent the energy of the signal (e.g. the energy of the BM response to a tone, when that tone is embedded in the noise) relative to the energy of the noise (e.g. the energy of the BM response to the noise, when that noise was presented with the tone). A sinusoidal function, s(t), was fitted to the BM response evoked by the tone signal (during the presentation of the tone+noise stimulus). The sinusoidal function was then subtracted from the 40 ms array (i.e. the BM response to the second and third segments described in the previous paragraph) to create a time-domain estimate of the BM response to noise only, n(t), during the presentation of the tone+noise stimulus. The energy of these two time-domain functions were estimated and used to compute an estimate of SNR:
| (1) |
The operators s(t)2 and n(t)2in eqn (1) indicate estimates of the variance of the tone and noise components in the tone+noise responses, respectively. The BM response to each tone+noise stimulus was also characterized as the ratio of the energy of the overall BM response, S+N, to the energy of the BM response to the noise when presented alone, Na:
 |
(2) |
BM responses to simultaneously presented click and noise stimuli (which we will call click+noise) were also obtained in the experiments performed at Keele. Each stimulus presentation consisted of three 20 μs clicks with a 20 ms gap following each click. Noise stimuli were identical to those described in the “Keele” paragraph above. The noise stimulus overlaps only the second and third clicks, with the second click occurring 5 ms after the onset of the noise. BM response averages were calculated using the averaging methods (including noise-cancellation) described above.
Results
Results are based on middle ear and BM vibrations recorded from six chinchillas (two at the University of Wisconsin and four at Keele University) and one gerbil (Keele University). BM recording sites had CFs in the 6.3–9 kHz range in the chinchilla and 15 kHz in the gerbil. Middle ear vibrations were recorded near the incudo-stapedial joint of each species.
Basilar membrane tone responses masked by noise: temporal aspects
Waveforms in Fig. 1A represent average BM responses to tone+noise stimuli (see Methods section). The stimulus consists of a 65 ms tone at CF (7 kHz) and a slightly delayed 50 ms narrowband Gaussian noise with a centre frequency at the CF of the recording site. Only the first 30 ms of the averaged response is shown in Fig. 1A in order to emphasize the changes that occur when the noise is turned on. The tone level was kept constant (40 dB SPL) and the noise level, N0, varied as indicated by the text next to each trace. Average BM responses to the tone signal alone are represented in the earlier part of the responses, as indicated in the annotation.
Figure 1. Basilar membrane (BM) responses to tone+noise stimuli.

A, overall BM responses to tone and tone+narrowband noise stimuli. Whereas the tone level was kept constant at 40 dB SPL, the noise level (N0) was varied as indicated in the figure. The tone frequency (7 kHz) matches the characteristic frequency (CF) of the recording site. B, the response components locked to 7 kHz during the tone+noise section of the stimulus. Each waveform was obtained from the corresponding overall BM response shown in A after applying a noise cancellation technique described in the Methods. C, root-mean square (RMS) amplitudes of the overall BM responses (dashed lines with symbols) and of the spectral component locked to the tone frequency for two chinchillas. Tone levels are indicated in parentheses in the figure. CF of animal KCH31 is 8.4 kHz.
Figure 1B displays BM response components locked to the tone frequency during the presentation of the noise stimulus (in the rightmost portion of Fig. 1A). These components are shown after the noise cancellation procedure described in the Methods section. Examination of the waveforms in Fig. 1B reveals a reduction or suppression of the BM response to the 7 kHz component relative to the responses to the tone alone, which are shown in the leftmost portions of Fig. 1A. Whereas the amplitude of the 7 kHz component decreases gradually with increasing noise level, the overall BM response amplitude increases substantially (as shown in Fig. 1A). The amplitude of overall BM vibration, expressed as a root-mean square (RMS) value, actually increases non-linearly at a rate of around 0.5 dB/dB with noise level (dashed line with squares in Fig. 1C). Data from another animal are also shown in the same figure (dashed line with circles in Fig. 1C). By contrast, the RMS value of the response component locked to the tone frequency decreases as a function of noise level at a rate that approximates 1 dB/dB (Fig. 1C; continuous lines with circles and squares). Suppression of the CF tone-evoked component by the noise signal is thus reminiscent of two-tone suppression on the basilar membrane when the suppressor tones’ frequency is below CF (see Fig. 6A in Cooper 1996).
Figure 6. BM responses to tone+noise stimuli – suppression by tone signals.

A, BM responses to tone+noise stimuli following the removal of the 7 kHz sinusoidal component. Narrowband noise levels were kept constant (N0= 20 dB eSPL). B, results of PSD analysis performed on the waveforms in A in which the tone frequency equals CF. C, similar to B except that the tone frequency is 9 kHz, which is above CF. Animal = KCH32.
Suppression of BM responses to tones by noise stimuli
Results shown in Fig. 2A originate from an experiment in which the noise level was first kept constant and the tone level was varied as indicated in the abscissa. The experimental paradigm was then repeated for several noise levels. The tone frequency was set at the CF (8.4 kHz) of the recording site. The dashed line in Fig. 2A represents the amplitude of the BM response to the tone signal alone. Each of the remaining curves in Fig. 2A displays the amplitudes of the CF component of the BM response to tone+noise stimuli.
Figure 2. BM responses to tone+noise stimuli – effects of noise level on responses to CF tones.

Displacements were measured in responses to single tone (dashed lines) or tone+noise (continuous lines with circles) stimuli. The frequency of the tonal stimuli always matched the CF of the recording site. Noise levels were kept constant for each curve and differ in steps of 10 dB between curves. Thick lines with filled symbols represent BM displacements in the presence of the loudest noise masker (A, 50 dB eSPL; B, 62 dB eSPL). C, amplitudes of BM response components locked to the CF frequency of the recording site as a function of noise level. The intensity of the tone stimuli was 30 dB SPL for the four curves shown.
As the noise level increases, the amplitude of the CF response component decreases. The loudest noise signal (line with filled circles in Fig. 2A) yields the largest reduction in, or suppression of, the BM response to the tone (or ‘probe’) signal. The amount of suppression also depends on the level of the probe signal. For example, the simultaneous presentation of the 50 dB eSPL noise masker produces a reduction of approximately 35 dB in the response amplitude evoked by a 20 dB SPL tone, but has almost no effect when the tone level is above 80 dB SPL.
Figure 2B shows a family of curves, similar to those shown in Fig. 2A, obtained from another experiment performed in a different cochlea. The curve indicating the BM response to the probe signal in the presence of the loudest noise (62 dB eSPL; line with filled triangles) has a slope of around 1 dB/dB. In other words, the loudest noise signal appears to ‘linearize’ the BM response to a CF tone in this animal. Figure 2C summarises the amplitude reductions, expressed in decibels, of the CF response components as a function of noise level in four chinchilla cochleae. For the 30 dB SPL probe tones considered in this part of the figure, suppression grows at rates of up to 1 dB/dB once noise levels exceed 20–30 dB eSPL.
Suppression effects by white noise on BM responses to single tones with frequencies above or below CF were also studied. Each of the six families of curves in Fig. 3 represents the BM response to a combination of a single tone (frequency specified in each panel) and white noise (or ‘suppressor’) stimuli presented simultaneously. Displacement evoked by the tone stimulus decreases progressively with increasing noise level. The effects are largest for tone frequencies around CF (Fig. 3B–D) and smallest for frequencies well above or well below CF (Fig. 3A and F). BM responses to tones alone in Fig. 3E grow non-monotonically with level, as shown previously for above CF stimuli (Rhode & Recio, 2000). Suppression effects by noise in Fig. 3E increase progressively with increasing noise level, at least for tone levels below 60 dB SPL. The two most intense noise levels actually yielded an increase in amplitude of the BM responses to intense tone signals (>60 dB SPL).
Figure 3. BM responses to tone+noise stimuli – effects of noise level on responses to tones.

Data in each panel are similar to those in Fig. 2, except that a range of tone frequencies was used and all the data originate from one cochlea (KCH33). Tone frequency is indicated in each panel. The data consist of displacement measured in response to tones below CF (A and B), at CF (C) and above CF (D–F) in the presence of white noise stimuli at various levels in 10 dB steps. Lines with filled triangles show BM displacements in the presence of the loudest noise masker (57 dB eSPL).
Various thresholds, defined as the probe intensity necessary to evoke a certain BM displacement, were determined to quantify the apparent suppression effects across a range of frequencies in two animals (Fig. 4). An example of a single threshold computation under two experimental conditions (in quiet conditions and in the presence of noise) is shown in Fig. 3C using a 0.5 nm displacement as a criterion. In the quiet condition (dashed line in Fig. 3C), the 0.5 nm displacement corresponds to 8 dB SPL. The 0.5 nm threshold estimated in the presence of the most intense suppressor signal (thickest line in Fig. 3C) is 35 dB SPL – a 27 dB threshold elevation. Figure 4A and B shows mechanical iso-response curves, in which each data point corresponds to a given displacement threshold (in this case 1 nm), as a function of probe frequency, for two cochleae. The three curves in each of the panels in Fig. 4A and B were computed in the presence of background noise of different intensities (20 and 40 dB relative to the least intense noise, as indicated in each panel) using a threshold criterion of 1 nm. In the condition with the lowest noise level (thin continuous lines with symbols in Fig. 4A and B), tuning curves have inverted bandpass shapes. Elevations in threshold due the presence of the suppressor signal occur mostly for probe frequencies around CF, changing the shape of the iso-response curves from bandpass to lowpass (thick continuous lines with symbols in Fig 4A and B). Threshold elevations due to an increase in noise level persist in some animals even at tone frequencies that are half an octave below CF (e.g. 4 kHz thresholds in Fig. 4A). This could indicate that the relative width of the non-linear region around CF for apical and mid-cochlear locations is wider than the relative width of more basal cochlear sites.
Figure 4. Suppression tuning curves.

A and B, families of iso-response curves evaluated at three noise levels. The level of the least intense noise is indicated in each panel and the levels of the other two noise stimuli are 20 and 40 dB above the least intense level. C, increases in CF threshold as a function of masker level for four cochleae. Continuous line in C has a linear slope (1 dB/dB).
The relation between shifts in CF threshold and changes in noise level was also studied. Figure 4C displays thresholds at CF (expressed relative to threshold in quiet conditions, i.e. using dB SL) as a function of noise level in four cochleae. The average of the slopes of the individual traces in Fig. 4C, evaluated in the 20–60 dB range, is approximately 0.8 dB/dB. This means that increases in noise level produce similar changes in the BM mechanical thresholds for CF tones. The continuous line without symbols is shown for reference and represents a linear relation between threshold and noise levels.
Suppression of BM responses to clicks by noise stimuli
Results from the previous section show that suppression by noise increases when the probe stimulus frequency is near CF and decreases as the probe frequency shifts from CF. White noise does not suppress BM responses to single tones with frequencies in the linear region of the response area (e.g. see the 4 kHz point in Fig. 4B). It is known that BM responses to clicks at the base of the cochlea consist of a series of damped oscillations whose frequency is not constant but increases over time until it reaches a near-CF frequency (Robles et al. 1976; de Boer & Nuttall, 1997; Recio et al. 1998; Recio & Rhode, 2000). Whereas the initial oscillation of the BM click response increases almost linearly with stimulus level, later oscillations reflect non-linear behaviour with changes in stimulus level. In spite of the non-linear behaviour of the cochlea, BM responses to tones and clicks share similar tuning characteristics (Recio et al. 1998; Recio & Rhode, 2000). One would therefore expect that in the presence of noise, BM responses to tones and clicks would change in similar ways.
Waveforms in Fig. 5A represent average BM responses to 81 dB pSPL click (thin continuous lines) and click+noise stimuli (thick and dashed lines). Whereas the click level remained constant in both conditions, the noise level varied as indicated in each trace. At this high click level, suppression effects by white noise are almost negligible, regardless of noise level. This observation can be confirmed in the Fourier domain (Fig. 5B), where response spectra to click and click+noise stimuli are also very similar (click level = 81 dB pSPL, N0= 50 dB eSPL). By contrast, effects of noise suppression become noticeable for less intense click levels (61 dB pSPL, Fig. 5C). Even at low levels, however, the amplitude and delay of the initial oscillation of the BM response to the click stimulus remain unaffected by the presence of noise. The instantaneous frequency (Recio et al. 1998) of these initial oscillations is approximately 4.7 kHz (vertical dashed line in Fig. 5C). Oscillations with instantaneous frequencies around CF (6.8 kHz) decrease in amplitude as the noise level increases. Notice that the 6 kHz oscillation in the first lobe of the 61 dB pSPL response is already affected by the 30 dB eSPL noise, whereas an oscillation with similar instantaneous frequency (6.2 kHz) in the second lobe is unaffected by the same noise. Fourier transform amplitudes of the waveforms in Fig. 5C are displayed in Fig. 5D. (Note that the lowest spectrum in this panel has been shifted down by 20 dB for clarity.)
Figure 5. BM responses to clicks suppressed by Gaussian noise.

A, C and E, waveforms representing BM responses to click (thin continuous lines) and click+noise (thick and dashed lines) stimuli in one chinchilla (A and C) and one gerbil (E). Click intensities were 81, 61 and 75 dB pSPL in panels A, C and E, respectively, and noise levels are indicated next to the waveforms (in dB eSPL). B, Fourier transform amplitudes of BM responses to clicks (thin continuous line) and click+noise (dashed line). Click level in both results is 81 pSPL. D, Fourier transform amplitudes of the BM responses from C, using the same line convention. Results with a dashed line were arbitrarily shifted down by 20 dB. F, information similar to B and D, but for a gerbil cochlea.
Similar masking effects by noise on BM responses to clicks were observed in the gerbil. Figure 5E displays the BM responses to a 75 dB pSPL click (thin continuous lines in top and bottom traces, respectively). The least intense noise (thick line in top trace) suppresses oscillations with instantaneous frequencies above 10.7 kHz. Suppression effects by the most intense noise (dashed line in bottom trace) are larger and start earlier in the time domain. In the frequency domain, the effects are concentrated around the 15 kHz CF of the site (Fig. 5F). In summary, noise presented simultaneously with click stimuli can suppress the later (higher frequency, non-linear) part of the response but not the initial (low-frequency, linear) components.
Suppression of BM responses to noise by single tones
Previous BM studies of two-tone suppression (e.g. Rhode & Cooper, 1993; Rhode, 2007) have shown that the more intense tone in a pair can suppress the response to the less intense one whenever the tones are in the non-linear region of the BM's response area. BM responses to intense tone signals in the presence of weak Gaussian noise were thus studied to verify whether the weaker signal (in this case a noise) is also suppressed when tone+noise stimuli are used.
Figure 6A displays three waveforms, each one representing an average BM response to a tone+narrowband noise stimulus, following removal of the 7 kHz (CF) response component. The level of the noise component of the stimulus used in Fig. 6A was kept constant while tone level varied as indicated above each waveform. Amplitudes of the waveforms in Fig. 6A decrease with increases in the tone level. Figure 6B shows the results of Fourier analysis performed on the waveforms displayed in Fig. 6A. The spectra in Fig. 6B are narrowband in nature and have amplitudes that decrease progressively with increasing tone level (indicated next to each power spectral density (PSD) trace). Notice that the peak PSD amplitude decreases by ∼30 dB when the tone level increases from 50 to 80 dB SPL, i.e. ∼1 dB/dB suppression. Figure 6C shows the results of spectral analysis performed on BM responses to a tone+narrowband noise stimulus in which the frequency of the tone equals 9 kHz (i.e. above CF). Suppression effects are smaller than those shown in Fig. 6B but nevertheless significant.
Figure 7A shows the results of spectral/Fourier analysis performed on BM responses to various tone+broadband noise stimuli. The tone frequency corresponds to the CF (8.3 kHz) and, as in Fig. 6, the analysis was performed following the removal of the response component locked to the tone frequency (dashed line in Fig. 7A). Spectrum values decrease progressively with increasing tone level, which is indicated next to each trace. Computation of root-mean square (RMS) values was performed on the waveforms used for the spectral analysis. Suppression effects, which in this case were defined as (broadband) RMS reductions, increase as a function of tone level (Fig. 7C). The amount of suppression decreases with increasing noise level (Fig. 7C). Figure 7B and D shows PSD functions and suppression curves, respectively, obtained from a different preparation (CF = 7 kHz).
Figure 7. Wideband noise suppression by CF tones.

PSD analysis performed on BM response to tone+noise stimuli in two chinchillas. Tone frequencies match CFs (dashed lines) and their levels are indicated in A and B. Noise levels are also indicated and their values remain constant in the results of each panel. C and D, the reduction in RMS values of the waveforms used to compute PSD analysis in A and B, respectively. C and D also show analysis of BM responses at four noise levels in addition to those illustrated in A and B. E and F, the amplitude reductions in the BM response components locked to the CF tones as a function of noise level. Ellipses in panels C–F indicate mutual suppression regions.
Figure 7E and F represents the amount of suppression of the BM response locked to the tone frequency as a function of noise level. Plots in Fig. 7E and F were obtained from the data used to compute Fig. 7C and D, respectively, before the removal of the spectral component at the tone frequency. Suppression of the tone-evoked response increases with increases in noise level and is smaller for more intense tones. Close examination of a few data points in Fig. 7C–F, such as those indicated by ellipses (dashed lines), reveals the clear existence of mutual suppression in BM responses to tone+noise signals. That is, for certain tone and noise levels, BM responses to the noise can be suppressed by the tone signal at the same time that the responses to the tone are being suppressed by the noise. Mutual suppression effects are demonstrated by comparing data inside the ellipses in Fig. 7C and E for animal KCH31 or in Fig. 7D and F for animal KCH32. For example, the suppression effect of the 50 dB SPL tone on the BM response to a 40 dB eSPL noise is approximately 3.5 dB (see data inside the ellipse in Fig. 7C). Likewise, the 40 dB eSPL noise has a suppression effect on the BM response to a 50 dB SPL tone (data inside the ellipse in Fig. 7E). Points in Fig. 7C/E and D/F that lie outside the ellipses indicate suppression effects by the tone but not by the noise stimulus, or vice versa.
Signal-to-noise ratios in BM responses to tone+noise stimuli
In psychoacoustical tasks involving the detection of a tone signal in a noisy background, the energy of the signal relative to the noise measured at the output of the ‘auditory filter’ is considered an important factor in determining thresholds (Moore, 1987). SNRs, obtained from BM responses to tone+noise stimuli, were estimated in order to explore the relationship between thresholds and SNRs at the BM level.
Figure 8A and C shows a set of SNRs (eqn (1) in the Methods section) measured as a function of tone level in two cochleae. Lines with open circles in Fig. 8A and C depict SNRs measured in the presence of the least intense noise (10 and 17 dB eSPL in Fig. 8A and C, respectively). Continuous lines without symbols represent SNR functions obtained with more intense noise levels (10 dB steps over a 40 dB range) in each case. Except for the curves shown in Fig. 8A and C using lines with filled circles, the low-level slopes of most of the SNR functions in Fig. 8A and C are approximately 1 dB/dB. The results in Fig. 8 thus indicate that, for tone levels in the range of 30–40 dB SPL, SNRs increase proportionately. This range is larger than one would expect from the shape of the curves representing the BM responses to CF tones only (see results in Figs 2A and B and 3C) and is a straightforward consequence of the noise-evoked suppression described in previous sections.
Figure 8. SNR variations.
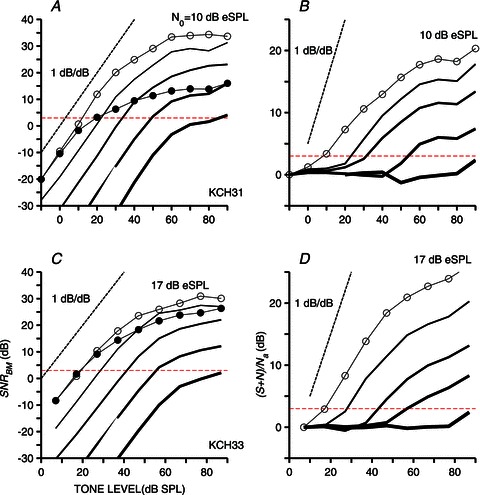
SNRs evaluated from BM responses to tone+noise stimuli as a function of tone level for two chinchillas (A and C). Lines with open circles in A and C indicate SNR values computed using noise levels of 10 and 17 dB eSPL, respectively. Continuous lines display SNR curves (similar to those shown with open circles) that were obtained using more intense noises. Line thickness increases with noise level, which increases in 10 dB steps. Lines with filled circles in A and C indicate SNR values using energy estimates from BM responses to tones and noise presented alone (noise levels in A and C are 10 and 17 dB eSPL, respectively). B and D, values of (S+N)/Na (eqn (2)) as a function of tone level computed from the same data used in A and C, respectively. Horizontal dashed lines indicate a 3 dB ordinate value.
Lines with filled circles in Fig. 8A and C display the predicted SNRs for CF tones on each basilar membrane, based on the assumptions that the responses to the tone and noise are independent (i.e. do not interact). Values indicated by the filled circles represent the ratio of signal-to-noise energy. Here, signal is defined as the BM response to a tone alone, and noise is the response to a frozen noise stimulus alone. SNR predictions were performed only for the lowest noise levels. Differences between the values indicated by the open and filled circles in Fig. 8A and C give an estimate of the enhancement in SNR due to non-linear cochlear interactions, such as suppression of the weaker stimulus (the noise) by the stronger one (the tone).
Whereas the SNR estimates in Fig. 8A and C were obtained by analysing the BM response components locked to the tone frequency and to the frozen noise (i.e. s(t) and n(t) in terms of our Methods), results in Fig. 8B and D attempt to characterize the ‘overall’ BM responses to the same tone+noise stimuli as a function of tone level. Lines with open circles in Fig. 8B and D illustrate the ratio (S+N)/Na (see eqn (2) in the Methods section) for the least intense noise levels tested. Similarly to Fig. 8A and C, the continuous lines without symbols represent results obtained with progressively more intense noise signals. Data in Fig. 8B and D have near-zero values (expressed in decibels) at low to moderate tone levels, indicating that the overall BM vibrations are dominated by the noise response components at these levels. The (S+N)/Naratios then increase with increasing tone level, but only at rates which are significantly lower than 1 dB/dB (unlike the initial regions of the ‘true’ SNR curves in Fig. 8A and C). The metric of eqn (2) grows compressively with tone level (once the tone-evoked response components start to dominate) because the tone responses themselves grow at highly compressive rates with increasing SPL (e.g. Fig. 2A, 2B and 3C).
Using results such as those in Fig. 8, we computed BM thresholds at a constant SNR or a constant (S+N)/Nacriterion. Threshold was defined as the tone level necessary to achieve a 3 dB criterion and was computed using logarithmic interpolation (meaning that thresholds were interpolated linearly across dB coordinates). The scatter plots in Fig. 9A and B contain detection thresholds for tone signals, expressed relative to the threshold at the lowest noise level. Data originates from five cochleae (four chinchillas and one gerbil). The scatter plots indicate a near-linear relationship for four of the five cochleae between threshold and masker levels – at least for noise level increments ≤ 30 dB. Probe levels required for detection thresholds in the presence of louder maskers (>30 dB increments) increase at a rate much higher than 1 dB/dB (dashed lines in Fig. 9). This could be explained by the suppressive effects of noise on the BM responses to the tone signal.
Figure 9. Signal threshold vs. masker level.

Scatter plots of threshold for tones embedded in noise as a function of masker level for four chinchillas (open symbols, using the conventions of Figs 1–4) and one gerbil (stars). Threshold criterion was an SNRBM= 3 dB (A) or (S+N)/Na= 3 dB (B). Dashed lines indicate growth rates of 1 dB/dB.
Results in Fig. 9 indicate that, for example, a 10–20 dB increase in noise level (relative to the lowest level) requires a similar increase in the level of tone signal in order to maintain an SNRBM= 3 dB or an (S+N)/Na= 3 dB. This apparently linear behaviour holds in spite of the strong suppression of low-level tones by low-level noises (e.g. Fig. 2).
Discussion
This report describes the first detailed investigation of BM responses to tone+noise and click+noise stimuli. Except for a preliminary conference report (Recio-Spinoso & Lopez-Poveda, 2010) and a publication in which, among other topics, the effects of Schroeder-phase complexes as suppressors (Recio & Rhode, 2000) were described, BM responses to probe tones embedded in a broadband stimulus have not been the focus of any previous study. The main findings of this work are:
BM responses to tone+noise stimuli exhibit non-linear interactions. Overall BM responses increase in a non-linear but monotonic manner with stimulus level (Fig. 1A).
In response to tone+noise stimuli, BM vibrations locked to the tone frequency decrease as a function of noise level, provided that tone frequency lies inside the non-linear region of the recording site (Figs 1B, 2, 3 and 4).
In response to tone+noise stimuli, BM vibrations evoked by weak noise stimuli are reduced by the presence of a strong tone stimulus (Figs 6 and 7).
Mutual suppression occurs at moderate stimulus levels in BM responses to tone+noise stimuli (Fig. 7).
BM responses to click+noise stimuli also exhibit non-linear interactions, including noise-evoked suppression of near-CF click-evoked responses (Fig. 5).
Detection thresholds, determined using three criteria, increase initially in a near-linear fashion in proportion to noise level increments (Figs 4 and 9).
Suppression of BM responses to tones by Gaussian noise
Noise-evoked suppression, or the reduction in amplitude of the BM response to CF tones due to the presence of Gaussian noise, was demonstrated in this study (Figs 1–3). Suppression effects decrease as a function of tone level. Suppression effects are negligible below certain noise levels but then increase monotonically with noise level. An increase in noise level yields an approximately equivalent reduction in amplitude in the component of the BM response that is locked to the tone frequency (Fig. 2C). That is, curves depicting the relation between noise level and amplitude changes in the BM response to the CF tone have an approximate slope of –1 dB/dB.
Suppression of BM responses to off-CF tones by Gaussian noise can also occur, but the spread of suppression is limited to the non-linear region. For example, Gaussian noise stimulation had little effect on BM responses to 4 or 9 kHz tones when CF = 6.3 kHz (Figs 3 and 4).
The overall BM response to tone+noise stimuli is generally larger than the response to the tone alone, even if the noise suppresses the component locked to the tone frequency (Fig. 1). The only conditions (not shown) under which we have seen net reductions in the overall response to a tone have been at points very close to the tone-suppression thresholds, and even these reductions were very small (amounting to a few per cent of the RMS response). Such findings clearly differ from the situation observed in the auditory nerve, where Rhode et al. (1978) showed marked decreases in the overall firing rates, relative to the responses to the tone alone, in the responses of ANFs to this type of stimulus (see also Figs. 4–16 in Pickles, 2008). Little or no neural rate suppression would be expected based on our BM data. A similar discrepancy has been shown in BM and ANF responses to single tones in the presence of Schroeder-phase complexes: an increase in the overall BM response and a decrease in firing of ANFs relative to the fibre's response to the tone alone (Recio & Rhode, 2000; Recio, 2001). The reasons for these differences are not known.
An increase in the overall BM response to two-tone stimuli having a below-CF suppressor has also been shown by various groups (Cooper, 1996; Geisler & Nuttall, 1997; Rhode, 2007). Suppression effects by the below-CF tone and the broadband noise components approximate a 1 dB/dB rate (see Fig. 1 in Cooper, 1996 and Fig. 2C in this report). Another similarity with the two-tone suppression phenomenon is that the maximum reduction in amplitude of the BM response to the probe tone is of comparable value, approximately 25–40 dB (Ruggero et al. 1992; Cooper, 1996; Rhode & Recio, 2001). Similar amplitude reductions were also obtained using Schroeder-phase complexes as suppressors (see Fig. 20 in Recio & Rhode, 2000).
Suppression of BM responses to clicks by Gaussian noise
Suppression of BM click responses depends on the click level (Fig. 5). The earliest cycles of the click responses, whose instantaneous frequency components are well below CF (Recio et al. 1998), are not affected by the simultaneous presentation of Gaussian noise. Click response components that occur later, which have instantaneous frequencies around CF and therefore are associated with the non-linear processing of the cochlea, are suppressed by Gaussian noise (Fig. 5). Thus suppression by Gaussian noise of BM responses to clicks shares similarities with tone suppression.
BM responses to clicks recorded in cochleae in good physiological condition often exhibit a ‘two-lobe’ wave pattern (Recio et al. 1998). A clear example of this pattern is also displayed in Fig. 5C. It is interesting that oscillations in the second lobe, at around 3–3.5 ms, remain relatively unaffected by the noise, while earlier oscillations at similar instantaneous frequencies are already affected (top traces in Fig. 5C). Once again, however, the reasons for this are unknown.
Suppression of BM responses to white noise by single tones – an example of mutual suppression
BM responses to weak Gaussian signals can be suppressed by the simultaneous presentation of single tones (Figs 6 and 7). Suppression effects can be as large 30–35 dB for some components of the noise (Fig. 7A). Noise suppression effects by the weaker tone signal were also found in the responses of ANFs to tone+noise stimuli by Rhode et al. (1978). Although the results are not shown in this report, we verified that noise suppression effects by below-CF tones can be as large as those evoked by CF tones. Suppression effects by above-CF tones were not as large, but significant nevertheless.
Results in Fig. 7C–F indicate that for certain combinations of noise and tone levels, marked by circles in these figures, BM response to the tone signal can be suppressed by the presence of the noise at the same time that the response to the noise signal is being suppressed by the tone. These interactions constitute clear examples of ‘mutual suppression’ (Geisler, 1998). Rhode (2007) showed mutual suppression effects in BM responses to two-tone stimuli. Rhode's definition of mutual suppression – that each tone can act as a suppressor – is broader than ours since his definition does not require the two effects to be simultaneous.
Signal-to-noise ratio at the output of the BM
For a constant noise level, SNR, measured at the output of the BM, grows almost linearly over a 40–60 dB range of tone level (Fig. 8). This linear range is larger than would be expected from the input–output functions of BM responses to a single tone (e.g. dashed lines in Fig. 2A) or from the SNR estimates in Fig. 8A and C denoted by filled circles. For low noise levels, this linear behaviour is probably a consequence of the suppression of the BM response to the noise by the tone signal. At high noise levels, the noise becomes the suppressor that reduces the gain of the cochlea and the responses to the tone signal. Somewhat ironically, it appears from our data that this ‘linearization’ is actually due to non-linear interactions that include both mutual suppression and suppression by the most intense stimulus.
Detection threshold of single tones in the presence of noise maskers
Hawkins & Stevens (1950) measured detection thresholds of speech and tone signals embedded in noise in psychoacoustical experiments involving human subjects. One of the classic results of their study is that increases in noise level lead to increases of the same amount in detection thresholds. Given what we currently know about the non-linear processing that takes place in the cochlea, this is an unexpected finding. More recent data by Houtsma (2004) agreed with Hawkins and Stevens’ results, but only when the tone frequency is below 1 kHz. For signal frequencies above 1 kHz, the linearity of noise masking is maintained only if the noise level is low or moderate (i.e. within 30 dB of the least intense noise). The range of noise level over which the linearity of masking is maintained in Houtsma's experiments is similar to the range used in our Fig. 9.
Because of the continuous analogue nature of BM motion, the concept of absolute threshold is not meaningful for cochlear vibrations. Nonetheless, we have assigned arbitrary thresholds in this study using three criteria: One was based on the tone level necessary to evoke a given BM displacement (Fig. 4) and the others were related to the SNRs measured from BM responses to tone+noise stimuli (Figs 8 and 9). Using the former threshold definition, which is similar to the definitions used by Ruggero et al. (1992) and Cooper (1996) to quantify two-tone suppression in BM responses, we found a near-linear relationship between masker level increments and near-CF threshold shifts. This relation is valid only for moderately high masker levels, e.g. below ∼60 dB eSPL.
SNRs measured from BM responses to tone+noise stimuli decrease with increases in noise level at rates close to –1 dB/dB (Fig. 8), provided that the masker level is moderately high (i.e. below ∼60 dB, Fig. 8). This was observed over a wide range (>80 dB) of tone levels. Detection thresholds of the probe signals were defined using a 3 dB SNR as a criterion. Probe levels at threshold were found to increase in a near-linear fashion with increases in noise level; that is, an increase in noise level corresponded to the same increase in probe threshold (Fig. 9).
Although BM responses to tone+noise stimuli have not been previously reported, there are several papers on ANF responses to this type of stimulus (e.g. Rhode et al. 1978; Abbas, 1981; Costalupes, 1985). Abbas (1981) recorded ANF responses to tone+noise stimuli and found that the amplitude of the phase-locked ANF responses decreased as a function of increasing noise level at a rate of approximately 1 dB/dB (see Fig. 3 in Abbas 1981). Response amplitudes were found to depend on the noise level relative to the tone level (Abbas, 1981). A similar dependence in rate changes of ANF responses on SNR was found by Costalupes (1985).
The near-linear characteristics of the ‘SNRBM vs. tone level’ curves are consistent with some of the results of Hawkins & Stevens (1950), at least for moderate noise levels. That is, the detection threshold of a tone embedded in noise increases in proportion to the level of background noise. It seems that a combination of noise suppression, tone suppression and mutual suppression effects are responsible for this ‘near-linear’ property of the cochlea.
Acknowledgments
The work was supported by NIDCD grant RO1 DC 01910 (USA) and by the Regional Operational Programme European Social Fund 2007/2013 within the frame of the INCRECYT programme of the Fundación Parque Científico y Tecnológico de Albacete (Spain).
Glossary
- ANF
auditory nerve fibre
- BM
basilar membrane
- CF
characteristic frequency
- eSPL
effective sound pressure level
- PSD
power spectral density
- pSPL
peak-equivalent sound pressure level
- RMS
root-mean square
- SL
sensation level
- SNR
signal-to-noise ratio
- SPL
sound pressure level
Author contributions
A.R.-S. and N.P.C. conducted the experiments and data analysis, wrote the paper and approved the manuscript.
References
- Abbas PJ. Auditory-nerve fiber responses to tones in a noise masker. Hear Res. 1981;5:69–80. doi: 10.1016/0378-5955(81)90027-7. [DOI] [PubMed] [Google Scholar]
- Bhattacharjee A, Ye AJ, Lisak JA, Vargas MG, Goldreich D. Vibrotactile masking experiments reveal accelerated somatosensory processing in congenitally blind Braille readers. J Neurosci. 2010;30:14288–14298. doi: 10.1523/JNEUROSCI.1447-10.2010. [DOI] [PMC free article] [PubMed] [Google Scholar]
- Cooper NP. Two-tone suppression in cochlear mechanics. J Acoust Soc Am. 1996;99:3087–3098. doi: 10.1121/1.414795. [DOI] [PubMed] [Google Scholar]
- Cooper NP. An improved heterodyne laser interferometer for use in studies of cochlear mechanics. J Neurosci Methods. 1999;88:93–102. doi: 10.1016/s0165-0270(99)00017-5. [DOI] [PubMed] [Google Scholar]
- Costalupes JA. Representation of tones in noise in the responses of auditory nerve fibers in cats. I. Comparisons with detection thresholds. J Neurosci. 1985;5:3261–3269. doi: 10.1523/JNEUROSCI.05-12-03261.1985. [DOI] [PMC free article] [PubMed] [Google Scholar]
- de Boer E, Kruidenier C. On ringing limits of the auditory periphery. Biol Cybern. 1990;63:433–442. doi: 10.1007/BF00199575. [DOI] [PubMed] [Google Scholar]
- de Boer E, Nuttall AL. The mechanical waveform of the basilar membrane. I. Frequency modulations (“glides”) in impulse responses and cross-correlation functions. J Acoust Soc Am. 1997;101:3583–3592. doi: 10.1121/1.418319. [DOI] [PubMed] [Google Scholar]
- de Boer E, Nuttall AL. The mechanical waveform of the basilar membrane. III. Intensity effects. J Acoust Soc Am. 2000;107:1497–1507. doi: 10.1121/1.428436. [DOI] [PubMed] [Google Scholar]
- Delgutte B. Physiological mechanisms of psychophysical masking: Observations from auditory-nerve fibers. J Acoust Soc Am. 1990;87:791–809. doi: 10.1121/1.398891. [DOI] [PubMed] [Google Scholar]
- Enns JT, Di Lollo V. What's new in visual masking. Trends Cogn Sci. 2000;4:345–352. doi: 10.1016/s1364-6613(00)01520-5. [DOI] [PubMed] [Google Scholar]
- Gai Y, Carney LH. Temporal measures and neural strategies for detection of tones in noise based on responses in anteroventral cochlear nucleus. J Neurophysiol. 2006;96:2451–2464. doi: 10.1152/jn.00471.2006. [DOI] [PMC free article] [PubMed] [Google Scholar]
- Geisler CD. From Sound to Synapse: Physiology of the Mammalian Ear. New York: Oxford University Press; 1998. [Google Scholar]
- Geisler CD, Nuttall AL. Two-tone suppression of basilar membrane vibrations in the base of the guinea pig cochlea using “low-side” suppressors. J Acoust Soc Am. 1997;102:430–440. doi: 10.1121/1.419765. [DOI] [PubMed] [Google Scholar]
- Hawkins JE, Stevens SS. The masking of pure tones and of speech by white noise. J Acoust Soc Am. 1950;22:6–13. [Google Scholar]
- Houtsma AJM. Hawkins and Stevens revisited with insert earphones (L) J Acoust Soc Am. 2004;115:967–970. doi: 10.1121/1.1645246. [DOI] [PubMed] [Google Scholar]
- Marmarelis PZ, Marmarelis VZ. Analysis of Physiological Systems: The White-noise Approach. New York: Plenum; 1978. [Google Scholar]
- Moore BCJ. Psychophysics of normal and impaired hearing. Brit Med Bull. 1987;43:887–908. doi: 10.1093/oxfordjournals.bmb.a072224. [DOI] [PubMed] [Google Scholar]
- Pickles JO. An Introduction to the Physiology of Hearing. Emerald, UK: 2008. [Google Scholar]
- Recio A. Representation of harmonic complex stimuli in the ventral cochlear nucleus of the chinchilla. J Acoust Soc Am. 2001;110:2024–2033. doi: 10.1121/1.1397356. [DOI] [PubMed] [Google Scholar]
- Recio A, Rhode WS. Basilar membrane responses to broadband stimuli. J Acoust Soc Am. 2000;108:2281–2298. doi: 10.1121/1.1318898. [DOI] [PubMed] [Google Scholar]
- Recio A, Rich NC, Narayan SS, Ruggero MA. Basilar-membrane responses to clicks at the base of the chinchilla cochlea. J Acoust Soc Am. 1998;103:1972–1989. doi: 10.1121/1.421377. [DOI] [PMC free article] [PubMed] [Google Scholar]
- Recio-Spinoso A, Lopez-Poveda EA. Basilar membrane responses to simultaneous presentations of white noise and a single tone. In: Lopez-Poveda EA, Palmer AR, Meddis R, editors. The Neurophysiological Bases of Auditory Perception. New York: Springer; 2010. pp. 15–23. [Google Scholar]
- Recio-Spinoso A, Narayan SS, Ruggero MA. Basilar membrane responses to noise at a basal site of the chinchilla cochlea: quasi-linear filtering. J Assoc Res Otolaryngol. 2009;10:471–484. doi: 10.1007/s10162-009-0172-0. [DOI] [PMC free article] [PubMed] [Google Scholar]
- Rhode WS. Mutual suppression in the 6 kHz region of sensitive chinchilla cochleae. J Acoust Soc Am. 2007;121:2805–2818. doi: 10.1121/1.2718398. [DOI] [PubMed] [Google Scholar]
- Rhode WS, Cooper NP. Two-tone suppression and distortion production on the basilar membrane in the hook region of cat and guinea pig cochleae. Hear Res. 1993;66:31–45. doi: 10.1016/0378-5955(93)90257-2. [DOI] [PubMed] [Google Scholar]
- Rhode WS, Geisler CD, Kennedy DT. Auditory nerve fiber responses to wide-band noise and tone combinations. J Neurophysiol. 1978;41:692–704. doi: 10.1152/jn.1978.41.3.692. [DOI] [PubMed] [Google Scholar]
- Rhode WS, Recio A. Study of mechanical motions in the basal region of the chinchilla cochlea. J Acoust Soc Am. 2000;107:3317–3332. doi: 10.1121/1.429404. [DOI] [PubMed] [Google Scholar]
- Rhode WS, Recio A. Multicomponent stimulus interactions observed in basilar-membrane vibration in the basal region of the chinchilla cochlea. J Acoust Soc Am. 2001;110:3140–3154. doi: 10.1121/1.1416198. [DOI] [PubMed] [Google Scholar]
- Robles L, Rhode WS, Geisler CD. Transient response of the basilar membrane in squirrel monkeys using the Mössbauer effect. J Acoust Soc Am. 1976;59:926–939. doi: 10.1121/1.380953. [DOI] [PubMed] [Google Scholar]
- Ruggero MA, Robles L, Rich NC. Two-tone suppression in the basilar membrane of the cochlea: Mechanical basis of auditory-nerve rate suppression. J Neurophysiol. 1992;68:1087–1099. doi: 10.1152/jn.1992.68.4.1087. [DOI] [PubMed] [Google Scholar]
- Stevens KN. Acoustic Phonetics. Cambridge MA, USA: The MIT Press; 1998. [Google Scholar]