

Abstract
Purpose
To determine whether children with dyslexia (DYS) are more affected than age-matched average readers (AR) by talker and intonation variability when perceiving speech in noise.
Method
Thirty-four DYS and 25 AR children were tested on their perception of consonants in naturally-produced consonant-vowel (CV) tokens in multi-talker babble. Twelve CVs were presented for identification in four conditions varying in the degree of talker and intonation variability. Consonant place (/bi/-/di/) and voicing (/bi/-/pi/) discrimination was investigated with the same conditions.
Results
DYS children made slightly more identification errors than AR children but only for conditions with variable intonation. Errors were more frequent for a subset of consonants, generally weakly-encoded for AR children, for tokens with intonation patterns (steady and rise-fall) that occur infrequently in connected discourse. In discrimination tasks, which have a greater memory and cognitive load, DYS children scored lower than AR children across all conditions.
Conclusions
Unusual intonation patterns had a disproportionate (but small) effect on consonant intelligibility in noise for DYS children but adding talker variability did not. DYS children do not appear to have a general problem in perceiving speech in degraded conditions, which makes it unlikely that they lack robust phonological representations.
Introduction
Developmental dyslexia is a specific learning disability that is characterized by difficulties in reading and spelling despite adequate intelligence and learning environments (Shaywitz et al., 1998; Snowling, 2000). This study investigates the claim that children with dyslexia (hereinafter referred to as DYS children) show a deficit in their perception of speech sounds. More specifically, it attempts to determine whether DYS children are more affected than age-matched average readers by the introduction of speaker and token variability in tests of consonant identification and discrimination when tokens are presented in noise. A global effect of phonetic variability would support the view that phonological representations are impoverished in DYS children.
There are a number of differing views as to the nature of phonological representations in DYS children. A prevalent one is that these children have impoverished phonological representations which can lead to deficits in their perception of speech sounds (The Phonological Deficit Hypothesis; e.g. Vellutino, 1979; Snowling, 2000). This view is supported by many studies showing poorer categorization and discrimination of consonant contrasts than in average readers. Such tasks require children to classify tokens consistently despite within-category variability in the speech continuum, modeling the kind of within- and between-speaker variability that occurs in speech communication (Liberman et al., 1957; Hazan and Barrett, 2000). DYS children have been shown to have shallower identification functions (Godfrey, Syrdal-Lasky, Millay and Knox, 1981; Brandt & Rosen, 1980; Chiappe et al., 2001; de Gelder & Vroomen, 1998; Nittrouer, 1999; Werker & Tees, 1987), poorer cross-category discrimination (Maassen et al., 2001; Serniclaes et al., 2001, Bogliotti et al., 2008) and, in some studies, better within-category discrimination (Serniclaes et al., 2001; Bogliotti et al., 2008; Manis & Keating, 2005) than average readers. However, not all categorical perception studies with DYS children have shown this trend. In some, no significant group differences have been found (e.g., Adlard & Hazan, 1998; Blomert & Mitterer, 2004; Johnson et al., 2011) or group differences have been found only for DYS children who also have specific language impairments (e.g., Joanisse et al., 2000; Manis & Keating, 2005; Robertson et al., 2009); other studies have obtained significant group differences but with only a minority of DYS participants performing below norm (e.g., Ramus et al., 2003). Also, deficits shown by DYS children on these tasks could at least partly be linked to task-related issues such as difficulties in processing synthetic speech (e.g., Blomert & Mitterer, 2004; Coady et al., 2007), or lapses of concentration, due to the repetition of a small number of highly-similar items (Moore et al., 2008). A recent review of categorical perception studies with DYS children reported that 64% of the 50 experiments reviewed reported significantly poorer performance in DYS children (Vandermosten et al., 2011).
An alternative proposal (The Phonological Access Deficit Hypothesis) is that DYS children have intact phonological representations but that the deficit is in accessing or manipulating these representations (Blomert & Mitterer, 2004; Ramus & Szenkovits, 2008; Soroli et al., 2010; Dickie et al., in press). According to this view, difficulties in accessing phonological representations are seen when the tasks that are used to assess these representations place heavy demands on short-term memory or on cognitive capacity. For example, problems in repeating nonwords typically only occur for nonwords with three or more syllables, showing that access to phonological representations is intact when the short-term memory load is low. Our previous findings with DYS children (Adlard & Hazan, 1998; Messaoud-Galusi et al., 2011) and adults (Hazan et al., 2009) are compatible with a phonological access deficit account. Indeed, in these studies, children performed more poorly on discrimination tasks than on identification tasks, which is consistent with the heavier short-term memory load imposed by discrimination tasks. Also, errors in identification tasks were not global, but rather were confined to a subset of consonant categories which were also typically confused by average readers when presented in noise (Adlard & Hazan, 1998).
These two hypotheses may be evaluated by looking at the effect of increasing the difficulty of the phonological decoding process in different ways. First, the decoding process per se can be made more difficult. One common route to achieve this is by adding noise to the speech signal, which masks important acoustic cues. But it is also possible to make phonological decoding more difficult by increasing the degree of acoustic variability within each consonant category. Second, the tasks used for testing children can be varied in the degree of memory load that is required. We examine the effects of these factors in turn before considering predictions that the phonological deficit and phonological access deficit hypotheses would make about the effect of these factors on DYS performance.
Evidence is mixed regarding the effect of noise on speech perception for DYS children; some studies show poorer performance for DYS children for speech tokens presented in noise (Brady et al., 1983; Ziegler et al., 2009) than for tokens presented in quiet, whereas others fail to find such effects (Messaoud-Galusi et al., 2011; Inoue et al., 2011, for conditions with balanced numbers of presentations). Those studies showing a worsening of perceptual abilities in noise could at first sight be interpreted as evidence of impoverished phonological representations. However, in the Ziegler et al. study, (2009), the fact that DYS children (who as a group exhibited poor performance in noise) had intact masking release (i.e., could exploit ‘glimpses’ when in maskers that were modulated) led the authors to suggest that these children had intact phonemic restoration and thus intact representations. Rather, they suggested that the deficit was in the integration of acoustic cues and in the mapping of these acoustic cues to phonological categories. Integrating acoustic cues situated in different parts of the speech signal is seen as particularly difficult in noisy conditions, as cue redundancy may be reduced due to masking and distortion. In such conditions, according to Ziegler et al. (2009), the integration process is pushed to its limit. This explanation is compatible with the view that it is the access to phonological representations which is affected rather than the representations themselves.
The effect of increasing within- and between-talker variability in tasks with DYS children is also likely to be informative in evaluating whether these children have impoverished phonological representations, but has been under-researched. The ability to deal with such variability in speech is fundamental to efficient speech perception (Johnson, 1997) but the effect of within- and between-talker variability on speech perception is relatively unexplored even for typically-developing children. We know that recognizing words produced by multiple talkers rather than a single talker imposes a processing cost even for adult listeners (e.g., Creelman, 1957; Mullennix, Pisoni, & Martin, 1989; Sommers & Barcroft, 2006) and that younger children are more affected by talker variability than older children (Ryalls & Pisoni, 1997).
Our study investigates the impact of both talker and intonation variability on the perception of speech tokens presented in noise. These two types of variability were chosen as they differ in their impact on acoustic-phonetic patterns and in their linguistic function. Having tokens from multiple talkers in a consonant intelligibility task greatly increases the within-category variability in acoustic-phonetic patterns marking consonant identity (Dorman et al., 1977; Johnson, Ladefoged & Lindau, 1993); such patterns typically involve changes in burst, frication or nasal formant center frequencies, in formant transition trajectories or in vowel or consonant duration (for a review, see Raphael et al., 2007). We would expect therefore that, if DYS children have impoverished representations for phonological categories, such within-category variation in acoustic cues marking these categories would have a greater impact on them than on AR children. Adding variability in intonation in consonant-vowel tokens involves changes in acoustic-phonetic characteristics of the vowel (fundamental frequency, intensity and vowel duration), but these are unlikely to directly impact on the acoustic cues marking the identity of the preceding consonant. However, intonation, apart from its role in signalling affect, has a linguistic function, e.g., in terms of marking differences between questions and statements, or more general aspects of syntax and pragmatics. DYS children have been shown to have greater problems than chronological-age controls on tasks that require them to use prosody to accurately chunk a sentence or to correctly identify the word with focus within a sentence (Marshall et al., 2009). There were no strong correlations between prosodic and reading abilities though, so these authors did not conclude that prosody was a core impairment for children with dyslexia. As intonation cues do not impact on consonant identity, a phonological deficit hypothesis would not predict that increased variability in intonation should lead to impoverished consonant perception. If, however, the performance of DYS children is affected by the cognitive demands of the task and short-term memory load, as suggested by the Phonological Access Deficit Hypothesis, then we hypothesize that group differences may increase with the degree of variability present in the task, whatever the type of variability.
The impact of talker variability was evaluated by comparing the performance of DYS and AR children in single-talker and multiple-talker conditions. The impact of variability in intonation was tested by comparing the two groups in conditions where the tokens were all produced with a single falling intonation pattern and in conditions in which each token was produced with four different intonation patterns (rising, falling, steady or rising-falling). This single vs multiple-intonation comparison was done for both single- and multiple-talker conditions. To reduce voice-learning effects which have been shown to affect intelligibility (Yonan & Sommers, 2000), different talkers (who may differ in intelligibility) were included in the single- and multiple-intonation conditions; the focus in the analysis was therefore whether the difference between the DYS and AR scores was greater in the multiple-intonation conditions than in the single-intonation conditions. The multiple-talker conditions did include two talkers whose tokens were presented in the single-talker condition, which enabled us to compare the intelligibility of these two talkers across the two conditions.
As suggested above, as the phonological access deficit hypothesis predicts that DYS children will show a greater decrement in performance when the cognitive and short-term memory demands are high, including tasks that vary in these demands is also informative. Identification tests require the child to link the token heard to a specific label: these tests evaluate a more linguistic level of processing but require relatively low cognitive and memory loads. Discrimination tests, in which children are asked to select one token out of three that differs in an initial consonant, impose a greater cognitive and memory load. This is especially the case in the high-variability (multiple-talker or multiple-intonation) conditions: children are required to attend to phonemically-relevant variability (consonant identity) while ignoring the phonemically-irrelevant (talker and intonation) variability. Larger group differences for the discrimination conditions would therefore support the phonological access deficit hypothesis.
Method
Participants
All participants were monolingual British English children. DYS children were recruited in specialist schools as well as in mainstream schools with a dyslexia unit. Average readers were mainly recruited from the same schools as the DYS participants and through personal contacts. To be included in the study, all participants had to pass a pure-tone hearing screening test at 0.5, 1.0, 2.0 and 4.0 kHz at 20 dB HL. They were also required to score better than the 25th percentile in non-verbal IQ, verbal IQ and receptive grammar tests (≥ 90). Non-verbal IQ was measured using the block design of the WISC IV (Wechsler, 2004), verbal IQ with the British Picture Vocabulary Scale (Dunn et al., 1998) and receptive grammar using the Test of Receptive Grammar (Bishop, 2005) (see Table 1). To be included within the DYS group, children had to have an official diagnosis of dyslexia by a chartered educational psychologist; they were excluded from the study if they were additionally diagnosed with a co-morbid disorder (SLI, autism, ADHD, dyspraxia). Average readers were included in the study if they scored at or above a standard score of 100 on the summed word and pseudoword score for the TOWRE reading test (Torgesen et al., 1999) and if they were free of any learning disability as reported by the school. Participants were informed that they were free to withdraw at any stage of the study and that individual data would not be disclosed. Participants in this study were a subset of a larger cohort tested in a previous study (Messaoud-Galusi et al., 2011); these were all the children from the previous study who were still contactable (i.e. had not changed schools) and agreed to participate in this second study. The standardized tests used for the selection of participants and the tests of phonological awareness and phonological short-term memory (see below) were therefore carried out between 9 and 20 months before this test battery was administered, but the reading tests were administered together with it. Ethical approval was granted by the UCL Research Ethics Committee.
Table 1.
Ages and standardized scores for tests of grammar (TROG), non-verbal IQ (BPVS), verbal IQ (BPVS), phonological short-term memory (CNRep) and reading (TOWRE) for children with dyslexia (DYS) and age-matched average readers (AR). The tests of grammar, IQ and phonological awareness were carried out between 9 and 20 months prior to the study.
| Group | DYS (N=34) | AR (N=25) | ||||
|---|---|---|---|---|---|---|
| Mean | s.d. | Mean | s.d. | t | sig. | |
| Age (months) | 147.3 | 15.0 | 146.8 | 15.4 | −0.14 | 0.89 |
| Grammar (TROG) | 100.8 | 7.8 | 107.3 | 7.4 | 3.18 | 0.002 |
| Non-verbal IQ (WISC) | 98.5 | 9.6 | 104.0 | 8.6 | 2.22 | 0.03 |
| Verbal IQ (BPVS) | 103.4 | 11.1 | 115.9 | 12.1 | 4.08 | <0.001 |
| Phonological STM (CNRep) | 80.5 | 10.7 | 92.9 | 5.8 | −5.14 | <0.001 |
| Word Reading (TOWRE) | 83.7 | 8.9 | 108.9 | 11.0 | 9.7 | <0.001 |
| Nonword Reading (TOWRE) | 80.0 | 12.7 | 121.1 | 8.5 | 14.0 | <0.001 |
| Reading (aggregate score) | 78.2 | 11.9 | 118.2 | 10.5 | 13.4 | <0.001 |
There were 59 participants in total: 34 DYS participants and 25 AR (average reader) participants. At the time of this second study, participants ranged in age from 118 to 177 months in the DYS group (mean age: 147.3 months, s.d. 15.0 months) and 113 to 177 months in the AR group (mean age: 146.8 months, s.d. 15.4 months).
Test battery
Standardized tests
Phonological Awareness
Phonological awareness was assessed using the rhyme and the spoonerism subtests of the PhAB (Frederickson, Frith, & Reason, 1997).
Phonological Short Term Memory
The CNRep (Gathercole et al., 1994) is a nonword repetition task that is commonly used as a measure of phonological short term memory. It consists of 40 nonwords of 2 to 5 syllables (e.g “blonterstapping”, “sepretennial”) preceded by two practice items. The final score corresponds to the total number of nonwords repeated correctly.
Reading
The participants’ reading level was assessed using the word and pseudoword reading lists of the TOWRE – Form A (Torgesen et al., 1999). Each list was presented separately and participants were instructed to read the list as fast as they could. For each list, the number of items read in 45 seconds provided a raw score. A standard score was then derived for the word and pseudoword reading lists and a combined standard score computed.
Speech perception tests
The impact of talker and token variability on speech perception was assessed using a series of identification and discrimination tests that included different levels of variability in each condition.
Test materials
Test materials included the syllables /pi, bi, ti, di, fi, vi, si, zi, mi, ni, spi, sti/. This range of stimuli included tokens that varied in consonant voicing only (/pi-bi/, /ti-di/, /fi-vi/, /si-zi/), in place of articulation only (/pi-ti/, /bi-di/, /fi-si/, /vi-zi/, /mi-ni/, /spi-sti/), and in manner of articulation only (/bi-mi/, /di-ni/, /ti-si/, /spi-pi/, /sti-ti/). Two clusters (/spi/, /sti/), classified as belonging to a separate manner of articulation, were also included, as they have been shown to be problematic for DYS children (e.g. Adlard & Hazan, 1998). The vowel context /i/ was chosen to permit the comparison with the identification and discrimination of the synthetic ‘pea’-‘bee’ continuum tested in our previous study with these same children (Messaoud-Galusi et al., 2011). Also, this vowel context was preferred over the more commonly used /a/ context, as /a/ maximizes the formant transition trajectories in CV syllables, and therefore may not give a representative account of children’s ability to use formant transition information in less salient contexts.
Digital recordings were made in an anechoic chamber with a B&K Sound Level Meter Type 2231 fitted with a 4165 microphone cartridge, and with speech digitized directly to the hard disk of the computer at a sampling rate of 44.1 kHz. The eight talkers (four women and four men) were native adult talkers of Southern British English. The syllables were presented one at a time on a screen, with a symbol marking the intonation pattern to be used in the production of the syllable. Four different intonation patterns were included: rising, falling, rising-falling or steady. Each token was recorded three times with each of the four intonation patterns, giving a total of 144 tokens per talker. The two clearest tokens of each syllable, as judged by a phonetically-trained researcher, were selected for inclusion in one or more of the four test conditions. In order to correct for differences in overall level across talkers during recordings, the waveform of each talker’s utterances were multiplied by a fixed factor, so as to make the mean rms levels of each talker equal over all syllables. This manipulation preserves individual variation in the level of each token which results from natural variation in articulation or different inherent levels for each consonant, while keeping the average level across talkers the same. Multi-talker babble was then added at a signal-to-noise ratio of 0 dB.
Test conditions
In both the identification and discrimination tests, there were four test conditions varying in the amount of talker- and intonation-related variability present. Condition 1t1i (1 talker, 1 intonation pattern) contained the least variability as all tokens were produced by a single talker with a falling intonation pattern. The falling intonation pattern was chosen for this condition as it is the most ‘unmarked’ intonation pattern in a citation form production of a monosyllable. In Condition 1t4i (1 talker, 4 intonation patterns), tokens were again produced by a single talker but, this time, each syllable was produced with four different intonation patterns. Condition 4t1i (4 talkers, 1 intonation pattern) included tokens produced by four different talkers, but all produced with a falling intonation pattern. Finally, Condition 4t4i (4 talkers, 4 intonation patterns) included tokens produced by four different talkers, and with four different intonation patterns.
Identification tests
The identification tests used a 12-alternative identification procedure using test software developed at UCL and presented on a laptop pc. The children were first familiarized with the possible responses via recorded instructions that listed all of the options orally once. In the test itself, children heard a syllable via headphones at a fixed comfortable listening level, without seeing the range of possible syllables typed on the screen in order not to disadvantage the DYS children. They had to repeat the syllable that they heard to the experimenter who clicked the label corresponding to their response. Responses that were not within the set of syllables presented were allowed and noted by the experimenter.
In Condition 1t1i, two blocks were included: one with tokens from one female talker (F1) and one with tokens by one male talker (M1). Each block included two tokens with falling intonation for each of the 12 syllables, each repeated twice, giving a total of 48 presentations. Condition 1t4i again included one block with tokens for one female talker (F2) and one with tokens from a male talker (M2). This condition included one token per syllable for each of the four intonation patterns, giving again a total of 48 presentations per subtest. Different talkers were used in Conditions 1t1i and 1t4i in order to avoid learning effects for the talkers’ voices. Even though this restricts the extent to which conditions 1t1i and 1t4i can be directly compared, this does not affect the cross-group comparison which is the focus of this study. Condition 4t1i included tokens from four talkers: the two talkers from condition 1t1i (F1 and M1) and two other talkers (F3 and M3). For each talker, two different tokens with falling intonation were included for each of the 12 syllables; each was repeated twice giving a total of 192 presentations, divided into two blocks of 96 presentations. Condition 4t4i included tokens from four talkers: the two talkers from condition 1t4i (F2 and M2) and two other talkers (F4 and M4). For each talker, one token for each syllable in each of the four intonation patterns was included, giving again a total of 192 presentations, divided into two blocks of 96 presentations. See Table 2 for the attribution of the male and female talkers to the different conditions.
Table 2.
Table showing the distribution of talkers across the four test conditions: 1t1i (one talker, one intonation pattern), 1t4i (one talker, four intonation patterns), 4t1i (four talkers, one intonation pattern), 4t4i (four talkers, four intonation patterns). The following acoustic-phonetic measures are provided for each talker: Fundamental frequency mean (F0 mean), fundamental frequency range (F0 range), and slope of the long term average spectrum (LTAS slope). These show that the talkers of the same sex within each of the multiple-talker conditions were distinct along these measures and therefore likely to be perceived as different talkers.
| Condition | Male talkers | Female talkers | ||||||
|---|---|---|---|---|---|---|---|---|
| Code | F0 mean (Hz) |
F0 range (Hz) |
LTAS slope (dB) |
Code | F0 mean (Hz) |
F0 range (Hz) |
LTAS slope (dB) |
|
| 1t1i and 4t1i | M1 | 121 | 118 | −18.1 | F1 | 207 | 198 | −23.1 |
| 1t4i and 4t4i | M2 | 110 | 108 | −24.9 | F2 | 221 | 212 | −21.3 |
| 4t1i | M3 | 133 | 123 | −19.8 | F3 | 237 | 222 | −15.4 |
| 4t4i | M4 | 104 | 100 | −18.2 | F4 | 189 | 187 | −23.4 |
It is important to consider some general acoustic-phonetic characteristics of the voices included in the experiment as talker effects are reduced when talkers sound similar (Magnuson & Nusbaum, 2007). Measures of fundamental frequency mean and range and long-term average slope in Table 2 show that the male and female talkers included in the multiple-talker conditions were quite distinct on these measures. Cleary et al. (2005) found a difference of around 2 semitones in fundamental frequency range to be necessary for voices to be perceived as distinct by 5 year olds. On this basis, the two female voices were expected to be discriminable from each other and from the male voices in both the 4t1i and 4t4i conditions. The fundamental frequency means for the two male voices in each of these conditions were not as well differentiated. However, given that the 2 semitone criterion was highly conservative (based on data from much younger children and for stimuli constructed via frequency modifications of a single voice), we consider that they were still likely to be perceived as distinct voices.
Discrimination tests
These tests assessed the degree to which the introduction of talker and intonation variability affected the discrimination of a voicing (/bi/-/pi/) and place (/bi/-/di/) contrast for DYS and AR listeners. The materials were a subset of the materials described above (i.e., the /bi/, /pi/ and /di/ tokens recorded by the eight talkers). An XAB discrimination test was used with a game-like test procedure. The participants saw three spaceships on the screen: one at the top of the screen, and two side by side in the lower part of the screen. They heard the ‘chief’ alien in the top spaceship utter a token, and then the aliens in the two bottom spaceships also produced a token. Participants had to click on the alien on the bottom half of the screen that produced the ‘same’ syllable as the ‘chief’ alien. Equal numbers of /bi/-/pi/ (voicing) and /bi/-/di/ (place) pairs were interspersed in the same test. The order of presentation of the triplets (AAB, ABA, BBA, BAB) was counterbalanced within the test. In each condition, there were 64 presentations: 32 /bi/-/pi/ triplets and 32/bi/-/di/ triplets.
The talker distribution across conditions was as for the identification tests (see Table 2). As in the identification tests, Condition 1t1i included a female talker block and a male talker block, with all tokens produced with a falling intonation. In Condition 1t4i, each of the tokens in the triplet had a different intonation pattern. In matching the same consonant, therefore, a listener had to ignore the difference in intonation patterns between the reference token and the other token with the same initial consonant. Each intonation pattern occurred equally often in the reference token. Again, there were separate subtests for the male and female talkers. In Condition 4t1i, all tokens in the triplet had falling intonation but were spoken by a different talker. When matching the reference token with another token with the same initial consonant, the listener therefore had to ignore differences in talker characteristics. Each token combination was presented eight times with order counterbalanced, and utterances for each of the four talkers occurred as the ‘reference’ token 16 times. In Condition 4t4i, all three stimuli presented in a triplet had a different intonation pattern and were spoken by three different talkers. Listeners therefore had to match the consonants, disregarding variability in both talker and intonation. Each intonation pattern occurred equally often as the ‘reference’ token. Tokens from each of the four talkers occurred in the ‘reference’ stimuli 16 times. Note that the ‘same’ stimulus was always a different token than the reference (X) token (e.g., in condition 1, the reference and ‘same’ tokens both had falling intonation and were produced by the same talker, but they were different utterances).
Test procedure
Most participants were tested in a quiet room in their school, with a few children tested in a quiet room in their home. Instructions (recorded by a native speaker of British English) and test materials were presented to participants through Sennheiser HD25-1 headphones. The sound level at which the stimuli were presented on the laptop computer was fixed at a comfortable level for all listeners. The test battery was presented over three sessions of about 30-40 minutes each. A fixed order was used for the presentation of the test battery, although in a small number of cases it was necessary to alter the order of presentations to maximize testing efficiency given the available time (see Appendix 1). Even though a fixed presentation order is likely to affect between-condition comparisons, our focus was on between-group comparisons (i.e., whether the performance of the DYS and AR groups differed more for certain conditions than others). A fixed order therefore ensures that cross-listener comparisons cannot be affected by different order effects across listeners, although it is still possible that cross-group differences may occur because of differences in learning rate in DYS and AR children. The experimenter provided encouragement throughout the test, whatever the level of performance.
Results
Standardized tests
The group profiles on standardized tests are shown in Table 1. As expected, the AR group obtained higher scores than the DYS group (p<0.001) for both the reading of words and nonwords. The AR group also obtained higher verbal IQ scores (p<0.001) and had better phonological short-term memory (p<0.001). The AR group had higher non-verbal IQ scores than the DYS group (p=0.03), as well as higher receptive grammar scores (p=0.002). It should be noted though that the receptive grammar scores for the DYS group were within norm (Mean: 100.8).
Identification tests
The aim of this analysis was to investigate whether the difference in performance between the DYS and AR children would be greater for multiple-talker (4t1i and 4t4i) than for single-talker (1t1i and 1t4i) conditions, thus showing a strong talker effect, or greater for multiple-intonation (1t4i and 4t4i) than for single-intonation (1t1i, 4t1i) conditions, thus showing an effect of intonation. If children have impoverished phonological representations, the prediction was that talker variability would have a greater impact on consonant identification than intonation variability for DYS children. If their difficulty is linked to the cognitive and memory demands of the task, as suggested by the phonological access deficit hypothesis, group differences were expected to increase as more variability is added within the token set, i.e. from condition 1t1i to condition 4t4i. As is explained in greater detail below, DYS children only showed poorer performance in conditions with variability in intonation, so neither prediction was fully met.
The percentage of correctly identified consonants was calculated for each participant in each condition. First, as a fixed order of presentation was used, we looked for evidence of a learning effect across the different conditions of the identification test. The two blocks of condition 4t4i, which contained identical stimuli, were presented in sessions 2 and 3 (see Appendix 1). For the DYS group, there was a 1.1% difference in scores between the two blocks, and for the AR group 0.5%; there was no significant block effect or block by group interaction. This indicates that the degree of learning of the stimuli across sessions was minimal. For condition 4t1i, where the two blocks were presented consecutively within the same session (end of session 1), no block order effects were obtained either.
For further analyses, percent correct scores for conditions 1t1i and 1t4i were averaged across the male and female talker blocks, and for conditions 4t1i and 4t4i across the two blocks for each condition (see Figure 1). Regression analyses were applied in order to investigate the effects of age on consonant identification for each condition. As the effect of age was never significant, repeated-measures ANOVAs were used for further statistical analyses of the data.
Figure 1.

A repeated-measures ANOVA was carried out on the mean consonant identification scores to investigate the between-subject effect of listener group (DYS, AR) and within-subject effects of talker condition (single, multiple), intonation condition (single, multiple) and their interaction. The effect of talker condition was significant [F(1,57=37.60; p<0.0001) as was the talker by intonation interaction [F(1,57=5.34; p<0.05) but crucially the interaction between talker condition and group was not, suggesting that the DYS and AR groups were not differently affected by the presence of multiple talkers. The interaction between intonation condition and listener group was significant [F(1, 57)=5.4; p=.024] and remained so at the same level with the one low-performing DYS outlier removed: DYS and AR groups had similar scores for the single intonation conditions (mean difference: 1.5%) but the DYS group scored more poorly than the AR group for the multiple intonation conditions (mean difference: 4%). Paired-samples t-tests confirmed that the scores for the AR group did not differ across the single and multiple intonation conditions [t(24)=1.45; p=.160] but that for the DYS group, scores for the multiple intonation conditions were significantly lower than scores for the single intonation conditions [t(33)=6.46; p<0.0001]. Figure 2 displays individual data points either aggregated over the two different intonation conditions (left) or talker conditions (right). Even when group effects are significant, it is possible that only a minority of individual listeners are performing below norm. The next step was therefore to calculate the percentage of children performing below norm in each of the two participant groups, using a method proposed by Ramus et al. (2003). Average readers performing below 1.65 standard deviations of the mean for the AR group (i.e., 5th percentile) were removed, and the mean and standard deviation for the AR group was then recalculated. Any participant performing below 1.65 standard deviation of this ‘trimmed’ mean was considered to be performing below norm for that task. Percentages of children falling below-norm in each condition are given in Table 3. Consistency of poor performance across conditions is also an important consideration; further calculations showed that seven DYS children (21%) and 1 AR child (4%) were below norm for both multiple-intonation conditions (data not shown).
Figure 2.
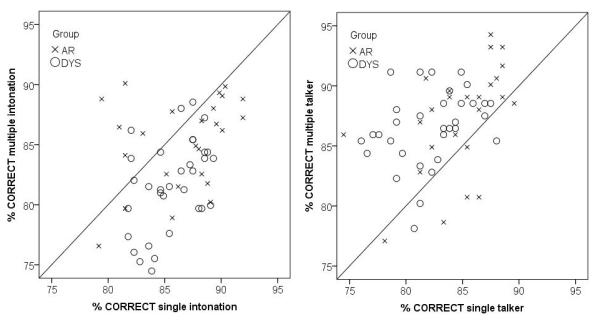
Table 3.
Percentage of children showing below-norm performance for each of the test conditions for the identification task.
| Test condition | AR | DYS |
|---|---|---|
| 1t1i | 8 | 12 |
| 1t4i | 16 | 38 |
| 4t1i | 16 | 9 |
| 4t4i | 16 | 26 |
Effect of talker variability
To verify the finding that talker variability did not affect the DYS children more greatly than AR children, further analyses were carried out to assess whether identical tokens presented in the single- and multiple-talker conditions were identified more poorly by either group in the multiple-talker condition. This analysis was possible as tokens for two of the talkers (F2 and M2) were presented in both the 1t4i and 4t4i conditions1. Identification rates for these two talkers were calculated for each of the intonation patterns. These were then analyzed in separate repeated-measures ANOVAs with within-subject effects of condition (1t, 4t) and intonation pattern (falling, rising, rise-fall and steady) and between-subject effects of group (DYS, AR). For both talkers, there was a condition by intonation pattern interaction [for talker F2: F(3,165)=7.82; p<0.001; for talker M2: F(3,168)=4.89; p<0.005], which were, in both cases due to lower identification rates for tokens with steady intonation in the 4t than in the 1t condition. There was therefore a suggestion of a talker effect for the subset of tokens with more unusual intonation patterns, as steady intonation contours rarely occur in conversational speech. However, this was the case for both the DYS and AR children, as there were no significant effects of group or any interactions involving group. In summary, DYS and AR children responded similarly to identical tokens, whether these were presented in the single- and multiple talker conditions. The fact that there was no improvement in performance for these tokens when they were repeated across conditions also shows that the voice learning effect was minimal.
Effect of intonation variability
Next, we explored further the effect of intonation variability. Both groups obtained similar scores for the single-intonation conditions but the DYS group obtained lower scores than the AR group for the multiple-intonation conditions. It is possible that the decrease in performance was not due to the introduction of intonation variability per se; the additional intonation patterns may have made the consonants more difficult to identify, and would have done so even if presented in single-intonation conditions. To explore this possibility, the data from the 4t4i condition were analyzed using scores calculated per talker per intonation pattern for each participant (see Table 4). Scores were calculated per talker in order to be able to evaluate whether the effects of intonation patterns were consistent across talkers.
Table 4.
The percentage of correct consonant identification for Condition 4t4i (multiple talker, multiple intonation patterns). These scores are calculated separately for each of the four intonation contours and each of the four talkers included in this condition. Also shown is the difference in mean scores between AR and DYS children with positive numbers indicating the AR children performed better.
| M2 (4t4i) | M4 (4t4i) | F2 (4t4i) | F4 (4t4i) | |||||||||
|---|---|---|---|---|---|---|---|---|---|---|---|---|
| Intonation | AR | DYS | diff | AR | DYS | diff | AR | DYS | diff | AR | DYS | Diff |
| Fall | 85.8 | 85.6 | 0.2 | 83.0 | 78.6 | 4.5 | 89.3 | 85.6 | 3.7 | 94.9 | 93.1 | 1.7 |
| Rise | 85.8 | 85.8 | 0.1 | 85.5 | 82.1 | 3.4 | 84.0 | 84.7 | − 0.7 | 95.3 | 92.5 | 2.8 |
| Rise-fall | 83.3 | 80.8 | 2.5 | 91.4 | 83.6 | 7.8 | 76.1 | 74.2 | 1.9 | 90.0 | 81.8 | 8.1 |
| Steady | 83.9 | 78.1 | 5.8 | 85.3 | 78.9 | 6.5 | 76.4 | 74.4 | 1.9 | 93.8 | 87.3 | 6.5 |
A repeated-measures ANOVA was carried out to investigate the within-subject effects of talkeridentity and intonation pattern and between-subject effect of participant group (DYS, AR). We only report significant effects involving participant group as they are the focus of our analysis. There was a significant effect of intonation pattern but also a significant intonation by participant group interaction: the difference in scores between the DYS and AR groups was greater for the rise-fall and steady intonation patterns than for tokens with fall and rise intonation patterns [F(3, 168) = 2.768; p<0.05].Therefore, the poorer performance of DYS children does not appear to be a result of variability in intonation per se but was specific to particular intonation patterns. This pattern is consistent for three out of the four talkers (Table 4).
Information Transfer Analysis
The next analysis examined whether the lower scores for the DYS group in certain conditions were due to difficulties in perceiving specific phonetic features. An information transfer analysis (Miller & Nicely, 1955) was carried out on the confusion matrices obtained per listener for each of the four conditions in order to determine the proportion of transmitted information in terms of the features of voicing (voiced, voiceless), place (bilabial, labiodental, alveolar) and manner of articulation (plosive, fricative, nasal, cluster). In this analysis, a perception of /m/ as /n/, for example, is correct in terms of the perception of the manner feature but incorrect in terms of the perception of place. A summary is shown in Table 5.
Table 5.
Mean scores resulting from an information transfer analysis carried out on the four conditions of the identification tests, showing what proportion of information, in terms of the features of voicing, place and manner were correctly transmitted in each condition. Numbers in brackets are standard deviations. Also shown is the difference in mean scores between AR and DYS children, with positive numbers indicating the AR children performed better.
| COND. | Voicing | Place | Manner | ||||||
|---|---|---|---|---|---|---|---|---|---|
| AR | DYS | diff | AR | DYS | diff | AR | DYS | diff | |
| 1t1i | 0.78 (.11) |
0.76 (.15) |
.02 | 0.63 (.10) |
0.66 (.09) |
−.03 | 0.85 (.07) |
0.86 (.06) |
−.01 |
| 4t1i | 0.76 (.09) |
0.72 (.08) |
.04 | 0.68 (.10) |
0.69 (.09) |
−.01 | 0.86 (.06) |
0.87 (.06) |
−.01 |
| 1t4i | 0.72 (.12) |
0.63 (.12) |
.09 | 0.63 (.09) |
0.62 (.08) |
.01 | 0.84 (.07) |
0.82 (.07) |
.02 |
| 4t4i | 0.73 (.13) |
0.63 (.10) |
.10 | 0.70 (.08) |
0.69 (.07) |
.01 | 0.87 (.07) |
0.85 (.06) |
.02 |
A repeated-measures ANOVA was carried out to evaluate the within-subject effects of feature (voicing, place, manner), talker condition (single, multiple), intonation condition (single, multiple) and between-subject effect of listener group. We focus here on effects involving group and any significant interactions. The main effect of listener group was not statistically significant; there was a significant effect of feature [F(2,114)=346.9; p<.0001] modified by a significant interaction between feature and listener group [F(2,114)=13.1; p<.0001]. There was also a main effect of intonation condition [F(1, 57)=19.0; p<.0001] modified by a significant interaction between intonation and listener group [F(1,57)=7.4; p=.009]. In order to clarify interactions involving listener groups, statistical analyses were carried out separately for each feature.
For the voicing feature (see Figure 3, left), the proportion of information transferred was significantly lower for the DYS group (0.68) than for the AR group (0.75) [F(1, 57)=8.054; p=.006]. There was a significant effect of intonation condition [F(1, 57)=46.7; p<.0001] modified by a significant group by intonation condition interaction [F(1,57)=8.65; p=.005]: independent-samples t-tests showed that the two groups did not differ in terms of voicing perception for the single intonation conditions, [t(57)=.678; p=.500 for 1t1i, [t(24)=1.72; p=.147 for 4t1i], but voicing perception was poorer for the DYS group than for the AR group for the multiple intonation conditions [t(57)=2.91; p=.005 for 1t4i, t(57)=3.49; p=.001 for 4t4i]. For the place feature, there was a main effect of talker condition [F(1, 57)=38.5; p<.0001], with better place perception for the multiple talker conditions, but neither the main effect of group nor interactions involving group were significant. For the manner feature (see Figure 3, right), there was a significant effect of intonation condition [F(1, 57)=6.2; p=.015] modified by an intonation by listener group interaction [F(1, 57)=4.1; p=.047]: the difference in manner identification between AR and DYS was greater in the multiple-intonation condition (0.85 for AR, 0.83 for DYS) than the single intonation condition (0.86 for AR, 0.87 for DYS). In summary, it appears that the group effect found in the analysis of overall identification scores was primarily due to the DYS group making greater errors in the perception of the voicing and manner features, but only in conditions when intonation varied.
Figure 3.

Is poorer identification specific to a subset of consonants?
Even though the phonetic feature analysis showed DYS children to make greater errors in voicing and manner of articulation, it could be that these errors are restricted to a small subset of consonants. In order to test the hypothesis that DYS children are poor at identifying those consonants that are marked by low-salience acoustic cues (i.e., consonants which tend to be misidentified by AR children when presented in noise; Adlard and Hazan, 1998), we calculated information transfer measures for the identification of individual consonants for each listener in condition 4t4i. This condition was chosen because it included multiple tokens by 4 different talkers and thus overall error patterns were less likely to be affected by idiosyncrasies of individual talkers or tokens. Information transfer measures were used in preference to a simple percent correct measure to minimize any effects of bias in the responses.
The mean information transfer scores per consonant for both the AR and DYS groups were highly revealing in terms of the difficulty of individual consonants. Information transfer rates were between 0.4 and 0.6 for five consonants for both groups: /m,n,f,v,b/, and between 0.7 and 0.96 for the remaining seven consonants or clusters (/z, p, s, t, d, sp, st/). As shown in Figure 4, the mean information transfer scores for individual consonants across the AR and DYS groups are highly correlated (R2=0.965) with slightly lower levels of performance for the DYS group. In order to assess whether DYS children were particularly poor at identifying weakly-marked consonants, mean information transfer scores for the group of weak and strong consonants as identified above were calculated for each individual participant. Repeated-measures ANOVAs with within-subject factor of consonant type (‘weak’, ‘strong’) and across-subject factor of participant group revealed main effects of consonant type [F(1, 57)=1156.7; p<0.0001] and participant group [F(1, 57)=7.7; p<0.01] but no significant interaction. DYS children showed the same pattern of consonant difficulty as AR children did, and did not exhibit particular difficulties with the weakly-marked consonant set.
Figure 4.

Another way to identify differences in the pattern of responding between the two groups involves confusion matrices, which may reveal which confusions are responsible for the increased rates of voicing and manner errors identified above (see Appendix 2). The data were first aggregated across participants for each group in each condition; the difference in percentage of responses between the DYS and AR group was then calculated for each cell of the confusion matrix. Averaged across all conditions, children in the DYS group responded significantly more often with labels other than those included in the defined set [F(1,57)=42.2; p<0.001].There was both a greater percentage of ‘other consonant’ responses (between 11 and 15% more than the AR group across conditions) and a greater percentage of vowel-only responses (between 6 and 12 % more than the AR group across conditions), particularly in response to /b/. Ahissar et al. (2006) also noted a higher proportion of ‘non set’ guesses in DYS participants than controls. From the confusion matrices, it appeared that the higher rate of voicing errors in DYS participants is particularly linked to greater /s/-/z/ and /f/-/v/ confusions. Manner errors seem linked to a higher rate of stop/fricative confusions in DYS children.
Summary of identification results
The DYS and AR groups obtained significantly lower identification rates for the two multiple-intonation conditions than for the conditions with the single (falling) intonation pattern. Within the multiple-intonation condition, DYS children typically made more errors than AR children for tokens with rise-fall and steady intonations but not for tokens with falling and rising intonation. High error rates in the DYS group were specific to a subset of consonants; many of these were also poorly identified by the AR group and are therefore weakly-marked. DYS children showed a greater tendency than AR children to use non-set or vowel-only responses, especially in response to /b/, and showed a higher rate of fricative voicing confusions.
Discrimination tests
The discrimination data were also analyzed to look at evidence of a greater impact of talker or intonation variability for DYS than AR children on a voicing and place contrast. Based on the outcome of the identification tests, we expected greater difficulty in discriminating the voicing (/bi/-/pi/) than the place (/bi/-/di/) contrast, but the greater memory and cognitive loads involved in the XAB discrimination tasks may lead to a more generalized group difference if DYS children were more affected by these factors.
As for the identification tests, discrimination scores varied significantly across the male and female talker blocks in condition 1t1i, but in this case tokens by the male talker were found to be easier to discriminate. For condition 1t4i, tokens by the female talker were easier to discriminate, showing that discrimination of a phonetic contrast can be strongly influenced by individual talker characteristics. As the focus of the study was on cross-group differences, the scores for the male and female blocks (in conditions 1t1i and 1t4i), and for the two blocks of stimuli (in conditions 4t1i and 4t4i) were aggregated per condition for the main statistical analysis. Again, as age was not correlated with any of the measures, repeated-measures ANOVAs focused on the between-subject effect of group, and the within-subject effect of contrast (voicing or place) and test conditions. Discrimination was poorer for the DYS than the AR group [F(1, 56)= 19.1; p<.0001]. There was a main effect of contrast [F(1, 56)= 156.0; p<.0001] modified by a significant condition by contrast interaction [F(3, 168)= 34.6; p<.0001]: discrimination scores were higher for the place contrast than for the voicing contrast for all conditions except condition 1t1i. Again, this may be linked to the specific characteristics of talkers used in this condition. In summary both groups found it easier to discriminate the place contrast than the voicing contrast in noise, consistent with the identification results, with performance being poorer overall for the DYS group. As regards below-norm performance (as calculated for the identification tests), for the voicing contrast, 51% of DYS children but only 8% of AR children were below-norm; for the place contrast, below-norm performance was found for 49% of the DYS group and 4% of the AR group. 13 children (37% of the DYS group) were below-norm for both contrasts. The proportion of DYS children performing below norm was therefore higher for the discrimination task than for the identification task.
Next, the data for the voicing and place contrasts were analyzed separately. For the /bi/-/pi/ voicing contrast (see Figure 5, left), better discrimination overall was obtained for the AR group (mean of 72.0% for AR vs 63.7% for DYS) [F(1, 56) = 25.3; p<0.001]. Lower scores were obtained in the multiple intonation conditions [F(1, 56) = 26.5; p<0.001], but there were no group by intonation interactions, suggesting that the DYS group was no more affected by the increased variability in intonation than the AR group. A significant talker by intonation condition interaction [F(1, 56) = 8.9; p<0.005] suggests that the effect of variable intonation was greater in the single talker than the multiple talker conditions; this may be linked to individual talker characteristics. The DYS group therefore showed poorer discrimination of a voicing (/bi/-/pi/) contrast in noise than the AR group, and the talker and intonation effects were similar across groups.
Figure 5.

For the place (/bi/-/di/) contrast (see Figure 5, right), lower discrimination scores were obtained for the DYS group [F(1, 56) = 12.5; p<0.001]. The effects of intonation [F(1, 56) = 18.7; p<0.001] and talker [F(1, 56) = 11.1; p<0.005] were also significant but in unexpected directions: higher scores were obtained for the varying intonation conditions than for the fixed intonation conditions, and for the multiple talker than for the single talker conditions. Again, these cross-condition differences can be at least partly attributed to differences in talker characteristics. Crucially, there was no interaction with listener group, showing that AR and DYS groups were similarly affected by the introduction of greater variability in intonation and talker.
We examined whether performance was correlated across the place and voicing discrimination tests for AR and DYS children. For mean discrimination scores calculated across conditions for the place and voicing contrasts, correlations were stronger (p<0.05 on Fishers Z-test) for the DYS group (r=.844; N=34, p<0.001) than for the AR group, (r=.489; N=25; p=.013), suggesting that task-related effects had a greater influence on performance for DYS children.
Summary of discrimination tests
DYS children performed more poorly than AR children in discriminating voicing (/bi/-/pi/) and place (/bi/-/di/) contrasts. Contrary to what was found for the identification tasks, the group difference was consistent across conditions, not varying significantly across the single/multiple talker or single/multiple intonation conditions.
Cross-test correlations
Pearson’s correlations were carried out separately on the DYS and AR groups to examine whether the ability to correctly perceive consonant voicing within the identification test was correlated with the ability to discriminate consonants varying in voicing (/bi/-/pi/ discrimination scores). For neither group were significant correlations obtained (at p<0.01 or better). A similar analysis was carried out for the place feature. Here again, no significant correlations were obtained either for the AR or DYS groups.
Next, we examined whether performance on the speech identification and discrimination tests was correlated with reading ability, or any of the other measures of language processing, again separately for the two groups. For the DYS group (N=34), no significant correlations between reading scores, tests of verbal and non verbal IQ, phonological awareness or language processing with either identification or discrimination scores were obtained. Phonological short-term memory was significantly poorer for the DYS group than for the AR group, but, surprisingly, was not significantly correlated with any of the speech identification or discrimination scores for this group. For the AR group (N=24), some correlations were significant, with the strongest correlation obtained between scores on the spoonerism subtest, a measure of phonological awareness, and 4t4i identification (r=.762; p<0.001).
Discussion
The aim of this study was to assess whether, as would be predicted by a phonological deficit explanation of dyslexia, increased variability in the acoustic cues marking consonant identity in consonant identification and discrimination tasks would have a disproportionate effect on speech perception for DYS children. This increased variability would be more acute in the multiple-talker conditions than the multiple-intonation conditions. An alternative view is that DYS children are impaired in accessing phonological representations (Blomert & Mitterer, 2004; Ramus & Szenkovits, 2008; Soroli et al., 2010) rather than having impoverished representations per se. According to this latter proposal, perceptual difficulties may be more selective and linked to factors such as the cognitive and short-term memory loads of the task. Here, we would expect that the difference in performance between the AR and DYS groups would increase with the difficulty of the task (i.e., with the degree of token variability, and with the cognitive demands of the task).
In the identification test, which involved the recognition of 12 different consonants in CV syllables presented in multitalker babble, the DYS group was not more affected than the AR group by the introduction of talker variability. However, identification scores for the DYS group were on average 4% lower than scores for the AR group for conditions involving tokens produced with four different intonation patterns. The difference in identification rates between the AR and DYS groups was greater for tokens that were produced with the more unusual intonation patterns (rise-fall and steady patterns) than for tokens produced with either falling or rising intonation. It appears that this relative deficit is linked to the specific characteristics of those more unusual intonation patterns rather than to the introduction of variability per se. For both the AR and DYS groups, higher error rates were obtained for the same subset of ‘low-salience’ consonants (/m/, /n/, /f/, /v/, /b/) than for the rest of the consonant set. In the discrimination tests, which focused on the discrimination of voicing (/bi/-/pi/) and place (/bi/-di/) contrasts, the group differences between DYS and AR children were more consistent across test conditions. There was therefore no evidence of a specific impact of talker or intonation variability, contrary to what was found in the identification tests. Group differences were also consistent across the voicing and place contrasts, despite the fact that place confusions had not been more prevalent for DYS than AR children in the identification tests. Overall, a greater proportion of children were below-norm for the discrimination tasks than for the identification tasks.
We can now consider these data in the light of predictions that would be made by a phonological deficit model. Predictions under a phonological deficit model were that the multiple-talker conditions would lead to group differences while the multiple-intonation conditions would not. The fact that the DYS and AR groups were not differentially affected by the introduction of talker variability would argue against the view that their phonological representations are impoverished. The fact that it is the multiple-intonation conditions that led to group difference countered predictions, as intonation patterns have little influence on acoustic cues to consonant identity. Even where group differences were present, these were limited to a subset of consonants and to tokens with more unusual intonation patterns (steady, rise-fall). Why are intonation patterns affecting consonant perception in these children? Prosodic information has many linguistic functions; as suggested by Lee and Nusbaum (1993), these untypical intonation patterns may compel listeners to attend to pitch variations and try to make sense of their linguistic meaning, even when, as in our tasks, this meaning is absent. Given the poor attentional control typically shown by at least some DYS children (e.g., Willburger & Landerl, 2010), the effect of the unusual intonation patterns is therefore likely to be indirect, by distracting attention from the initial part of the syllable for example, rather than directly affecting the processing of acoustic cues marking the consonant. This could particularly affect the recall of weakly-encoded consonants, and would suggest a role of cognitive load and short-term memory in the pattern of results seen.
Do these data provide support for the alternative view that it is the access to phonological representations which is affected in DYS children? The prediction here was that group differences would increase with the degree of complexity of the task. These predictions were partly confirmed in that group differences were more consistent in the discrimination tasks than in the identification tasks, but, within the identification tasks, it was not the case that group differences increased in line with the degree of variability within each condition. This might have been expected if increases in variability led to an increased cognitive load. Is the pattern of results still compatible with the view that external factors such as short-term memory and cognitive load can contribute to poorer performance in DYS children? In the identification tasks, the errors causing the significant if slight group differences were quite specific to a small subset of consonants that were mostly weakly-encoded for AR children, presented in the context of intonation patterns (steady, rise-fall) that are less frequent in connected discourse. Further still, only a minority of DYS children performed below-norm even in the more difficult conditions. These outcomes suggest therefore that access to phonological representations, in demanding conditions, may only be affected for a subset of phoneme categories and for some children. This view is compatible with our previous claims, based on studies involving categorical perception tasks: some individuals with dyslexia have speech perception acuity at the lower end of a normal range, and this poor performance may be exacerbated by non-sensory factors such as attention or short-term memory, which are required to differing degrees depending upon the type of task used (Hazan et al., 2009; Messaoud-Galusi et al., 2011)
The uniformly-poorer results obtained by DYS children across all conditions for the XAB discrimination tasks are more clearly consistent with the phonological access deficit hypothesis. The discrimination task was more cognitively demanding and taxing on short-term memory than the identification task: participants had to match two tokens in terms of their initial consonants out of three that were heard, disregarding variations in talker or intonation patterns across the three tokens. The more generalized difficulties shown by the DYS group may therefore be linked to task-related factors. The lack of significant correlation between scores reflecting phonological short-term memory and discrimination test results is surprising and argues against a simple link with short-term memory.
In conclusion, our data do not support the phonological deficit hypothesis as it does not appear to be the case that DYS children have a general problem in perceiving speech in degraded conditions due to a lack of robustness in phonological representations. Our data are compatible with the view of a phonological access deficit at least for consonants that are weakly encoded even for AR children and for tasks that place heavy demands on attention or short-term memory (Blomert & Mitterer, 2004; Ramus & Szenkovits, 2008; Soroli et al., 2010; Marshall et al., 2011). However, the fact that the deficit seen in the speech perception abilities of DYS children is so slight and so specific suggests that it is unlikely to have a causal effect on the development of adequate reading abilities.
Supplementary Material
Table 6.
Scores resulting from an information transfer analysis, showing what proportion of information for the features of voicing, place and manner were correctly transmitted in Condition 1t4i (single talker, four intonation patterns). Overall correct scores are also given. These scores were calculated separately for each of the four intonation contours included in this condition. Means are shown for the AR (average reader) and DYS (dyslexic) groups, and the ‘diff’ column gives the difference between the means for these two groups.
| Voicing | Place | Manner | Overall correct | |||||||||
|---|---|---|---|---|---|---|---|---|---|---|---|---|
| Intonation | AR | DYS | diff | AR | DYS | diff | AR | DYS | diff | AR | DYS | Diff |
| Fall | 0.72 | 0.68 | .04 | 0.62 | 0.58 | .04 | 0.84 | 0.82 | .02 | 0.85 | 0.81 | .04 |
| Rise | 0.77 | 0.62 | .15 | 0.61 | 0.60 | .01 | 0.86 | 0.85 | .01 | 0.86 | 0.82 | .04 |
| Rise-fall | 0.66 | 0.54 | .12 | 0.56 | 0.53 | .03 | 0.75 | 0.73 | .02 | 0.79 | 0.74 | .05 |
| Steady | 0.67 | 0.57 | .10 | 0.65 | 0.55 | .10 | 0.83 | 0.73 | 10 | 0.85 | 0.79 | .06 |
Acknowledgments
This study was supported by the Wellcome Trust (076499/Z/05/Z). The authors thank Mike Coleman who designed the testing software used in this study, Steve Nevard for technical support, Johannes Ziegler who kindly provided the data of Ziegler et al (2009) for us to re-analyze and Howard Nusbaum for enlightening comments on the role of pitch variations in speech. The authors would like to thank the participants and their families for their help as well as the following schools and their staff: Ellesmere College, Northease Manor School, Abingdon House School, Hazlegrove Preparatory School, Hurst Lodge, Mayville High School, Prior Park College, Trinity School, Sidcot School, Appleford School, Knowl Hill School, Calder House School, Edington & Shapwick School, Thomas’ Battersea, St Christopher’s School, Riddlesworth Hall school.
Footnotes
This analysis was not done for the 1t1i vs 4i1i conditions as 1t1i was the very first test presented. The two 4i conditions were carried out at the second testing session.
References
- Adlard A, Hazan V. Speech perception in children with specific reading difficulties (dyslexia) Quarterly Journal of Experimental Psychology Section A-Human Experimental Psychology. 1998;51:153–177. doi: 10.1080/713755750. [DOI] [PubMed] [Google Scholar]
- Ahissar M, Lubin Y, Putter-Katz H, Banai K. Dyslexia and the failure to form a perceptual anchor. Nature Neuroscience. 2006;9:1558–1564. doi: 10.1038/nn1800. [DOI] [PubMed] [Google Scholar]
- Bishop DVM. Test for the reception of grammar - Electronic (TROG-E) Harcourt Assessment. 2005.
- Blomert L, Mitterer H. The fragile nature of the speech-perception deficit in dyslexia: Natural vs. synthetic speech. Brain & Language. 2004;89:21–26. doi: 10.1016/S0093-934X(03)00305-5. [DOI] [PubMed] [Google Scholar]
- Bogliotti C, Serniclaes W, Messaoud-Galusi S, Sprenger-Charolles L. Discrimination of speech sounds by children with dyslexia: Comparisons with chronological age and reading level controls. Journal of Experimental Child Psychology. 2008;101:137–155. doi: 10.1016/j.jecp.2008.03.006. [DOI] [PubMed] [Google Scholar]
- Brady S, Schankweiler D, Mann V. Speech perception and memory coding in relation to reading ability. Journal of Experimental Child Psychology. 1983;35:345–367. doi: 10.1016/0022-0965(83)90087-5. [DOI] [PubMed] [Google Scholar]
- Brandt J, Rosen JJ. Auditory phonemic perception in dyslexia - Categorical identification and discrimination of stop consonants. Brain and Language. 1980;9:324–337. doi: 10.1016/0093-934x(80)90152-2. [DOI] [PubMed] [Google Scholar]
- Chiappe P, Chiappe DL, Siegel LS. Speech perception, lexicality, and reading skill. Journal of Experimental Child Psychology. 2001;80:58–74. doi: 10.1006/jecp.2000.2624. [DOI] [PubMed] [Google Scholar]
- Cleary M, Pisoni DB, Kirk KI. Influence of voice similarity on talker discrimination in normal-hearing children and hearing-impaired children with cochlear implants. Journal of Speech, Language, and Hearing Research. 2005;48:204–223. doi: 10.1044/1092-4388(2005/015). [DOI] [PMC free article] [PubMed] [Google Scholar]
- Coady J, Evans JL, Mainela Arnold E, Kluender K. Children with Specific Language Impairments perceive speech most categorically when tokens are natural and meaningful. Journal of Speech, Language, and Hearing Research. 2007;50:41–57. doi: 10.1044/1092-4388(2007/004). [DOI] [PMC free article] [PubMed] [Google Scholar]
- Creelman CD. Case of the unknown talker. Journal of the Acoustical Society of America. 1957;29:655. [Google Scholar]
- Dickie C, Ota M, Clark A. Revisiting the phonological deficit in dyslexia: Are implicit non-orthographic representations impaired? Applied Psycholinguistics. (in press) [Google Scholar]
- Dorman MF, Studdert-Kennedy M, Raphael LJ. Stop consonant recognition: Release bursts and formant transitions as functionally equivalent, context-dependent cues. Perception & Psychophysics. 1977;22:109–122. [Google Scholar]
- Dunn L, Dunn L, Whetton C, Burley J. British Picture Vocabulary Scale II. NFER-Nelson; Windsor: 1998. [Google Scholar]
- Frederickson N, Frith U, Reason R. Phonological Assessment Battery. NFER-Nelson; Windsor: 1997. [Google Scholar]
- Gathercole SE, Willis CS, Baddeley AD, Emslie H. The Children’s test of Nonword Repetition: a test of phonological working memory. Memory. 1994;2:103–127. doi: 10.1080/09658219408258940. [DOI] [PubMed] [Google Scholar]
- de Gelder B, Vroomen J. Impaired speech perception in poor readers: Evidence from hearing and speech reading. Brain and Language. 1998;64:269–281. doi: 10.1006/brln.1998.1973. [DOI] [PubMed] [Google Scholar]
- Godfrey JJ, Syrdal-Lasky AK, Millay KK, Knox CM. Performance of dyslexic children on speech tests. Journal of Experimental Child Psychology. 1981;32:401–424. doi: 10.1016/0022-0965(81)90105-3. [DOI] [PubMed] [Google Scholar]
- Hazan V, Barrett S. The development of phonemic categorisation in children aged 6 to 12. Journal of Phonetics. 2000;28:377–396. [Google Scholar]
- Hazan V, Messaoud-Galusi S, Rosen S, Nouwens S, Shakespeare B. Speech perception abilities of adults with dyslexia: is there any evidence for a true deficit? Journal of Speech, Language, and Hearing Research. 2009;52:1510–1529. doi: 10.1044/1092-4388(2009/08-0220). [DOI] [PubMed] [Google Scholar]
- Inoue T, Higashibara F, Okazaki S, Maekawa H. Speech perception in noise deficits in Japanese children with reading difficulties: Effects of presentation rate. Research in Developmental Disabilities. 2011;32:2748–2757. doi: 10.1016/j.ridd.2011.05.035. [DOI] [PubMed] [Google Scholar]
- Joanisse MF, Manis FR, Keating P, Seidenberg MS. Language deficits in dyslexic children: Speech perception, phonology, and morphology. Journal of Experimental Child Psychology. 2000;77:30–60. doi: 10.1006/jecp.1999.2553. [DOI] [PubMed] [Google Scholar]
- Johnson EP, Pennington BF, Lowenstein JH, Nittrouer S. Sensitivity to structure in the speech signal by children with speech sound disorder and reading disability. Journal of Communication Disorders. 2011;44:294–314. doi: 10.1016/j.jcomdis.2011.01.001. [DOI] [PMC free article] [PubMed] [Google Scholar]
- Johnson K. Speech perception without talker normalization: An exemplar model. In: Johnson, Mullennix, editors. Talker Variability in Speech Processing. Academic Press; San Diego: 1997. pp. 145–165. [Google Scholar]
- Johnson K, Ladefoged P, Lindau M. Individual differences in vowel production. Journal of the Acoustical Society of America. 1993;94:701–714. doi: 10.1121/1.406887. [DOI] [PubMed] [Google Scholar]
- Lee L, Nusbaum HC. Processing interactions between segmental and suprasegmental information in native speakers of English and Mandarin Chinese. Perception & Psychophysics. 1993;53:157–165. doi: 10.3758/bf03211726. [DOI] [PubMed] [Google Scholar]
- Liberman AM, Harris KS, Hoffman HS, Griffith BC. The discrimination of speech sounds within and across phoneme boundaries. Journal of Experimental Psychology. 1957;54:358–368. doi: 10.1037/h0044417. [DOI] [PubMed] [Google Scholar]
- Maassen B, Groenen P, Crul T, Assman-Hulsmans C, Gabreëls F. Identification and discrimination of voicing and place-of-articulation in developmental dyslexia. Clinical Linguistics and Phonetics. 2001;15:319–339. [Google Scholar]
- Magnuson JS, Nusbaum HC. Acoustic differences, listener expectations, and the perceptual accommodation of talker variability. Journal of Experimental Psychology: Human Perception and Performance. 2007;33:391–409. doi: 10.1037/0096-1523.33.2.391. [DOI] [PubMed] [Google Scholar]
- Manis FR, Keating P. Speech perception in dyslexic children with and without language impairments. In: Catts HW, Kamhi AG, editors. The connections between language and reading disabilities. Lawrence Erlbaum; Mahwah, NJ: 2005. [Google Scholar]
- Marshall CR, Harcourt-Brown S, Ramus F, van der Lely HKJ. The link between prosody and language skills in children with SLI and/or dyslexia. International Journal of Language and Communication Disorders. 2009;44:466–488. doi: 10.1080/13682820802591643. [DOI] [PubMed] [Google Scholar]
- Messaoud-Galusi S, Hazan V, Rosen S. Investigating speech perception in children with dyslexia: Is there evidence of a consistent deficit in individuals? Journal of Speech, Hearing and Language Research. 2011;54:1–21. doi: 10.1044/1092-4388(2011/09-0261). [DOI] [PMC free article] [PubMed] [Google Scholar]
- Miller GA, Nicely P. An analysis of perceptual confusions among some English consonants. J.Acoust.Soc.Am. 1955;27:338–352. [Google Scholar]
- Moore DR, Ferguson MA, Halliday LF, Riley A. Frequency discrimination in children: Perception, learning and attention. Hearing Research. 2008;238:147–154. doi: 10.1016/j.heares.2007.11.013. [DOI] [PubMed] [Google Scholar]
- Mullennix JW, Pisoni DB, Martin CS. Some effects of talker variability on spoken word recognition. Journal of the Acoustical Society of America. 1989;85:365–378. doi: 10.1121/1.397688. [DOI] [PMC free article] [PubMed] [Google Scholar]
- Nittrouer S. Do temporal processing deficits cause phonological processing problems? Journal of Speech Language and Hearing Research. 1999;42:925–942. doi: 10.1044/jslhr.4204.925. [DOI] [PubMed] [Google Scholar]
- Ramus F, Rosen S, Dakin SC, Day BL, Castellote JM, White S, et al. Theories of developmental dyslexia: insights from a multiple case study of dyslexic adults. Brain. 2003;126:841–865. doi: 10.1093/brain/awg076. [DOI] [PubMed] [Google Scholar]
- Ramus F, Szenkovits G. What phonological deficit? Quarterly Journal of Experimental Psychology. 2008;61:129–141. doi: 10.1080/17470210701508822. [DOI] [PubMed] [Google Scholar]
- Raphael LJ, Borden GJ, Harris KS. Speech Science Primer. 5th Edition Lippincott, Williams & Wilkins; Baltimore: 2007. [Google Scholar]
- Robertson EK, Joanisse MF, Desroches AS, Ng S. Categorical speech perception deficits distinguish language and reading impairments in children. Developmental Science. 2009;15:753–767. doi: 10.1111/j.1467-7687.2009.00806.x. [DOI] [PubMed] [Google Scholar]
- Ryalls BO, Pisoni DB. The developmental course of talker normalization in pre-school children. Developmental Psychology. 1997;33:441–452. doi: 10.1037//0012-1649.33.3.441. [DOI] [PMC free article] [PubMed] [Google Scholar]
- Serniclaes W, Sprenger-Charolles L, Carré R, Démonet JF. Perceptual discrimination of speech sounds in developmental dyslexia. Journal of Speech, Language, and Hearing Research. 2001;44:384–399. doi: 10.1044/1092-4388(2001/032). [DOI] [PubMed] [Google Scholar]
- Shaywitz SE, Shaywitz BA, Pugh KR, Fulbright RK, Constable RT, Mencl WE, Shankweiler DP, Liberman AM, Skudlarski P, Fletcher JM, Katz L, Marchione KE, Lacadie C, Gatenby C, Gore JC. Functional disruption in the organization of the brain for reading in dyslexia. Proceedings of the National Academy of Sciences of the United States of America. 1998;95:2636–2641. doi: 10.1073/pnas.95.5.2636. [DOI] [PMC free article] [PubMed] [Google Scholar]
- Snowling MJ. Dyslexia. 2nd Edition Blackwell Publishers; Oxford: 2000. [Google Scholar]
- Sommers, Barcroft Stimulus variability and the phonetic relevance hypothesis: Effects of variability in speaking style, fundamental frequency, and speaking rate on spoken word identification. Journal of the Acoustical Society of America. 2006;119:2406–2416. doi: 10.1121/1.2171836. [DOI] [PubMed] [Google Scholar]
- Soroli E, Szenkovits G, Ramus F. Exploring dyslexics’ phonological deficit III: Foreign speech perception and production. Dyslexia. 2010;16:318–340. doi: 10.1002/dys.415. [DOI] [PubMed] [Google Scholar]
- Torgesen JK, Wagner R, Rashotte C. Test of Word Reading Efficiency (TOWRE) Pro-Ed; Austin: 1999. [Google Scholar]
- Vandermosten M, Boets B, Luts H, Poelmans H, Wouters J, Ghesquière P. Impairments in speech and nonspeech sound categorization in children with dyslexia are driven by temporal processing difficulties. Research in Developmental Disabilities. 2011;32:593–60. doi: 10.1016/j.ridd.2010.12.015. [DOI] [PubMed] [Google Scholar]
- Vellutino FR. Dyslexia: Research and Theory. MIT Press; Cambridge, MA: 1979. [Google Scholar]
- Wechsler D. Wechsler Intelligence Scale for Children – Fourth Edition. Hartcourt Assessment. 2004.
- Werker JF, Tees RC. Speech perception in severely disabled and average reading children. Canadian Journal of Psychology. 1987;41:48–61. doi: 10.1037/h0084150. [DOI] [PubMed] [Google Scholar]
- Willburger E, Landerl K. Anchoring the deficit of the anchor deficit: dyslexia or attention? Dyslexia. 2010;16:175–182. doi: 10.1002/dys.404. [DOI] [PubMed] [Google Scholar]
- Yonan CA, Sommers MS. The effects of talker familiarity on spoken word identification in younger and older listeners. Psychology of Aging. 2000;15:88–99. doi: 10.1037//0882-7974.15.1.88. [DOI] [PubMed] [Google Scholar]
- Ziegler JC, Pech-Georgel C, George F, Lorenzi C. Speech-perception-in-noise deficits in dyslexia. Developmental Science. 2009;12:732–745. doi: 10.1111/j.1467-7687.2009.00817.x. [DOI] [PubMed] [Google Scholar]
Associated Data
This section collects any data citations, data availability statements, or supplementary materials included in this article.