Abstract.
We developed a microfluidic biochip to perform laser guidance on two cell types, chick embryonic forebrain neurons and spinal cord neurons. Observation of neurons under a high-magnification microscope, which we obtained from these two cell types, showed no difference in morphology. However, when flowing in the microfluidic channel and simultaneously being laser guided, the two cell types gained quite different guidance speeds under the same experimental conditions. The results demonstrate that different cell types with the same morphology (e.g., size, shape, etc.) can be effectively distinguished from each other by measuring the difference in guidance speeds (the maximum flow speed minus the initial flow speed). This technique is expected to provide a new approach to high-throughput, label-free cell sorting with high sensitivity.
Keywords: cell sorting, optical force, laser guidance, microfluidics
Flow cytometry, a widely used cell-separation technique, distinguishes cells according to their chemical features via fluorescence markers.1,2 A key design feature of flow cytometry is the sheath flow that hydrodynamically focuses the cell suspension to form a single-cell pipeline in the detection region. This feature has been used to develop microfluidics-based flow cytometry, in which the sheathed flow is produced in microchannels manufactured using polydimethylsiloxane (PDMS)-based soft lithographic techniques.3–5 By means of the sheathed flow, the junction of the foci of the flow channels controls cell dispensing and aligns the cells for detection at a downstream region. At the detection region, a laser beam stimulates a previously applied marker used to label the specific cell molecule(s) to generate fluorescence, which is detected by photosensitive devices. Once a target cell is detected, its path is deflected at the flow-switching junction, and the cell is collected by one of the cell-collection reservoirs.
Although markers provide biological assays with a high degree of specificity, their use has several potential problems. They can perturb the cell’s native environment, and the effects of this perturbation on cell measurement are largely unknown.6 Unacceptable effects of fluorescence markers on cell viability have been documented7; appropriate markers for every cell type are unavailable, and some markers are hard to successfully introduce to the cell.8 Applying antigen-specific fluorescence markers is labor-intensive and time-consuming, and markers may yield false-positive readings.9 Thus, there is a critical need for a generally applicable, label-free cell-detection technique.
During particle (e.g., a biological cell)–laser interaction, optical force is generated from the universal momentum exchange; the extent of the exchange reflects the intrinsic properties of the particle. Consequently, optical force has been proposed for use in particle separation: There are several optical force-based, label-free methods, each of which is based on the fact that a change in shape, composition, internal structure, or size causes a change in a particle’s optical properties, and thus the optical force experienced by the particle. Although in most methods, the measured parameters are not sensitive to cell-type changes and the accompanying changes in optical forces: we previously10 demonstrated that the laser-guidance technique, which measures the speed of the optical force-driven cell motion, is highly sensitive in cell detection. For example, modifying a single gene in a mouse lung-carcinoma tumor cell can cause approximately a 40% change in guidance speed. In this study, we applied laser guidance in a microfluidic biochip that provided the possibility of high-throughput cell separation after laser guidance-based cell detection.
To deliver cells to a guidance laser beam for realizing high-throughput detection, we used hydrodynamic focusing in this study. Two buffer fluid streams were used to squeeze, and thus narrow a third stream (cell flow) that contained the sample cells in the center of a flow channel. Controlling the relative flow rates of the three streams permitted the cell flow to be squeezed to the required width for forming a single-cell pipeline.
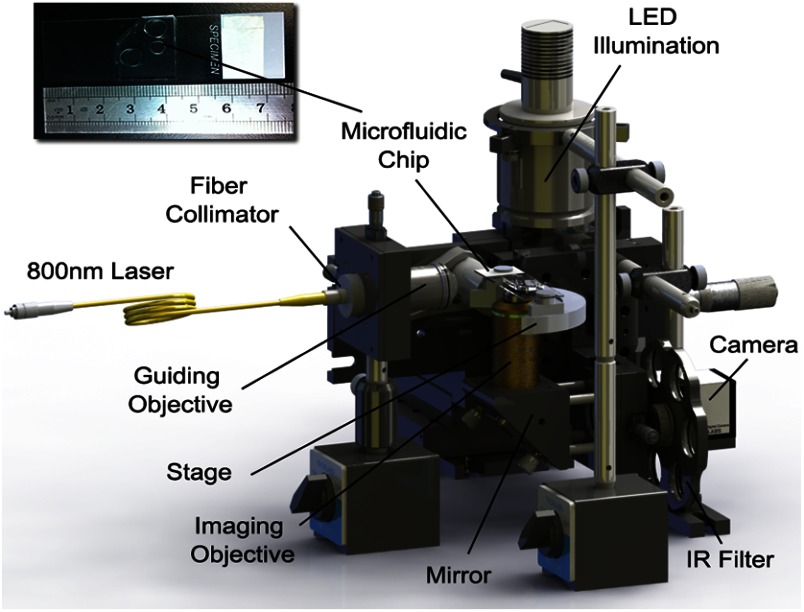
A schematic of the setup of the laser guidance in the hydrodynamic-focusing region is shown in Fig. 1. The guiding laser was a tunable Ti-Sapphire laser (3900S, Spectra Physics, Santa Clara, California) operating at the mode with the wavelength tuned to 800 nm. The laser beam traveled through a 2-m single mode optical fiber and a fiber collimator (Thorlabs, Newton, New Jersey, F280APC-B), and then was focused into the main channel of the microfluidic chip by a long working-distance objective (, 0.28 NA). A PDMS-based microfluidic chip (see the photograph at the top-left corner of Fig. 1) was fabricated with soft lithography in a clean room. The cell guidance was recorded using a objective and a high-resolution complementary metal-oxide semiconductor (CMOS) camera in conjunction with a frame grabber. The CMOS camera produced 8-bit monochrome images with an image size of and a maximum frame rate of 108 Hz. An IR filter was mounted between the imaging objective and the CMOS camera to block the scattered component of the guiding beam. Each cell was tracked in real time, and its size and flow speeds with and without laser guidance were calculated for cell detection.
Fig. 1.
Experimental setup. An 800-nm laser: the tunable Ti-Sapphire laser (3900S, Spectra Physics); guiding objective: a long working-distance objective (Mututoyo Corp., Illinois, M Plan Apo , 0.28 NA); illumination: collimated LED light source (Thorlabs M470L2-C1); imaging objective: Nikon LWD Ph1 ADL objective; IR filter: short-pass filter (Thorlabs FES0700, 700 nm cutoff); camera: high-speed CMOS camera (Photon Focus, Switzerland, MV1-D1312-160-CL-12).
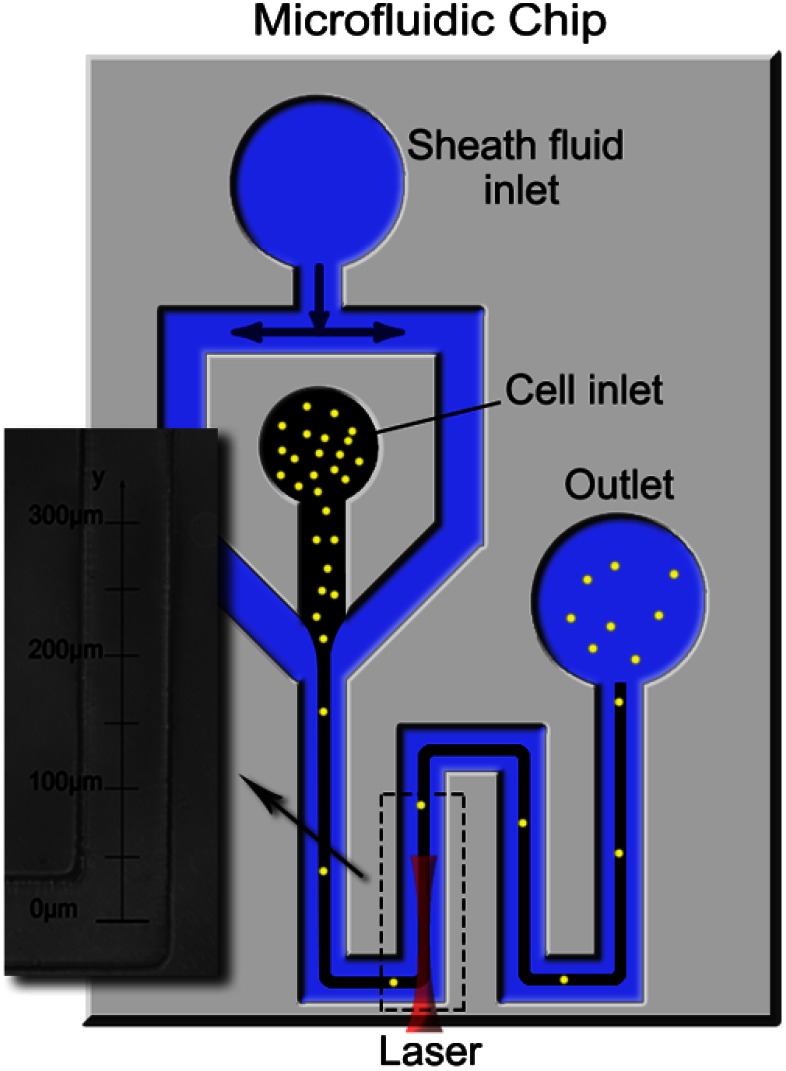
The microfluidic-channel design used in the experiment is schematically shown in Fig. 2. The diameters of the sheath fluid inlet, the sample flow inlet, and the outlet are 7, 5, and 7 mm, respectively. The width and height of the channels are 80 and 40 μm, respectively. Both the sheath flow and the sample flow were driven into the channel by gravity to form a hydrodynamic focus at the flow junction. This allowed the cells to flow in a single-cell pipeline, and thus pass the imaging zone one by one. The imaging zone is outlined with a dashed box.
Fig. 2.
Layout of the microfluidic channel design: two inlets and one outlet were punched using Harris Uni-Cores with different diameters (7 and 5 mm). The weakly focused laser beam was propagated along the flow direction. The laser-guidance region, outlined with a dashed box, is where the addition of optical force caused the cells to increase their flow speed.
The cell-detection feature of our laser-guidance and microfluidics hybrid system was tested with two types of neuron cells: chick forebrain neurons (FBNs) and spinal cord neurons (SCNs) were harvested from day 7 embryonic white leghorn chicks. Both FBNs and SCNs were suspended in M199 medium (Sigma-Aldrich, St. Louis, MO, without phenol red) supplemented with 1% antibiotic/antimycotic, 10% fetal bovine serum, 2% B27, and NGF 7S. All of these supplements were purchased from Invitrogen Life Technologies, Grand Island, New York. The cell concentration was set at approximately .
To ensure identical conditions during tests, the two cell types were fed immediately one after the other. For each test, 90 μL sheath fluid and 25 μL cell suspension were fed into the inlets to guarantee the same flow rate () for the two cell types. Because the buffer fluid utilized in the tests was the same as the culture medium used in the cell suspensions, it ensured a uniform propagation medium for laser beam and maintained the cells at high viability. The imaging field of view, shown in the left part of Fig. 2, was captured by the CMOS camera.
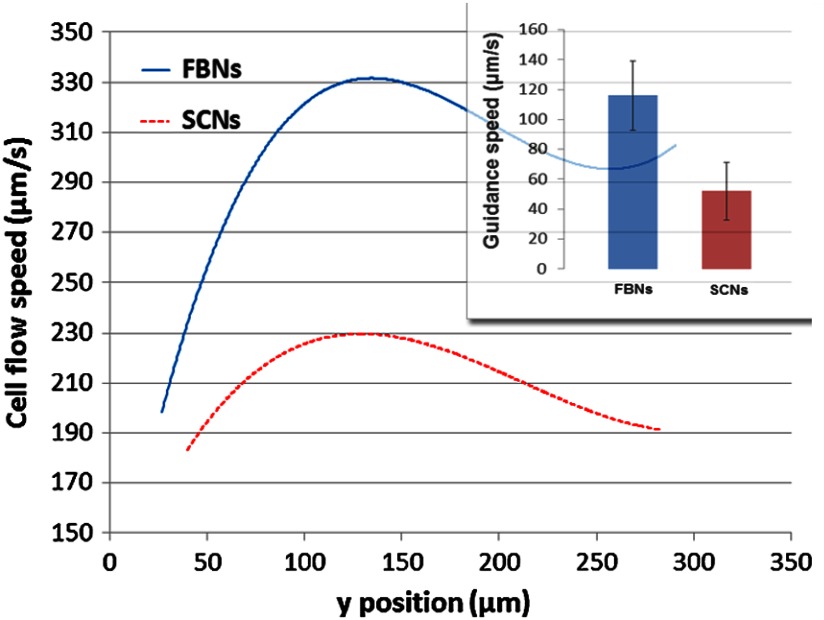
During the tests, the power of the incident laser beam remained at 500 mW. We estimated that the guidance power on cells inside the channel was approximately 200 mW. Cell flow speeds along the -axis (as illustrated in Fig. 2) were recorded. Each speed was calculated in terms of the positions of the particular cell in two consecutive frames and the time interval between these two frames. For each cell type, we tracked 10 cells for a statistical analysis. The results of laser guidance on two types of neurons in the microfluidic channel are shown in Fig. 3. Both speed curves, which average the flow speeds of the 10 cells at each position under guidance for each cell type, were obtained using cubic polynomial fitting. If the difference in the maximum speed (, with laser guidance) and the initial flowing speed (, without laser guidance) of a cell is considered as the guidance speed (): , the laser-guidance effect on the two cell types can be compared quantitatively as shown in the bar graph of Fig. 3, which demonstrates the significant difference in guidance speed in the two cell types. Guidance speed is the result of numerous photon-molecule momentum exchanges that occur in various parts of the cell, such as the nucleus, the subcellular organelles, and the cell membrane. Although it is unknown how each individual momentum exchange may contribute to the overall outcome (guidance speed), our data demonstrate that guidance speed is a very sensitive measurable parameter for the detection of subtle differences within a cell type. In our tests, according to Fig. 3, the FBNs moved faster than the SCNs under the same flow and guidance conditions.
Fig. 3.
Cell-flow speeds in the laser-guidance region: each cubic-polynomial-fitting curve averages the speed traces of 10 cells [blue for forebrain neurons (FBNs) and red for spinal cord neurons (SCNs)] along the -direction. The bar graph shows the significant difference in guidance speed of the two cell types.
Under a high-magnification microscope, we measured the diameters of the two cell types (): for FBNs and for SCNs. Thus, the cells are statistically the same spherical size. Consequently, we conclude that our guidance data demonstrate that the two microscopically identical cell types can be effectively distinguished using laser guidance in a microfluidic biochip.
In conclusion, laser guidance in microfluidic channels is capable of accurately detecting different cell types. By virtue of the microfluidic design and the hydrodynamic-focusing technique, high-throughput cell detection with low sample consumption and small-volume culture medium can be achieved. This technique has great potential to be developed into a unique, label-free, and highly sensitive cell sorting device.
Acknowledgments
This work was supported by the National Institutes of Health (P20RR021949 and 1k25hl088262-01); the National Science Foundation (MRI CBET-0923311 and SC EPSCoR RII EPS-0903795 through the SC GEAR program); and Guangdong Provincial Department of Science and Technology, China (2011B050400011).
References
- 1.Godin J., et al. , “Microfluidics and photonics for bio-system-on-a-chip: a review of advancements in technology towards a microfluidic flow cytometry chip,” J. Biophotonics. 1(5), 355–376 (2008). 10.1002/jbio.v1:5 [DOI] [PMC free article] [PubMed] [Google Scholar]
- 2.Ibrahim S. F., van den Engh G., “Flow cytometry and cell sorting,” Adv. Biochem. Eng. Biotechnol. 106, 19–39 (2007). [DOI] [PubMed] [Google Scholar]
- 3.Yao B., et al. , “A microfluidic device based on gravity and electric force driving for flow cytometry and fluorescence activated cell sorting,” Lab Chip. 4(6), 603–607 (2004). 10.1039/b408422e [DOI] [PubMed] [Google Scholar]
- 4.Simonnet C., Groisman A., “High-throughput and high-resolution flow cytometry in molded microfluidic devices,” Anal. Chem. 78(16), 5653–5663 (2006). 10.1021/ac060340o [DOI] [PubMed] [Google Scholar]
- 5.Chung T. D., Kim H. C., “Recent advances in miniaturized microfluidic flow cytometry for clinical use,” Electrophoresis 28(24), 4511–4520 (2007). 10.1002/(ISSN)1522-2683 [DOI] [PubMed] [Google Scholar]
- 6.Liminga G., et al. , “Apoptosis induced by calcein acetoxymethyl ester in the human histiocytic lymphoma cell line U-937 GTB,” Biochem. Pharmacol. 60(12), 1751–1759 (2000). 10.1016/S0006-2952(00)00494-9 [DOI] [PubMed] [Google Scholar]
- 7.Parolin C., et al. , “The effect of the minor groove binding-agent DAPI (2-amidino-diphenyl-indole) on DNA-directed enzymes—an attempt to explain inhibition of plasmid expression in Escherichia-coli,” FEMS Microbiol. Lett. 68(3), 341–346 (1990). [DOI] [PubMed] [Google Scholar]
- 8.Buckman J. F., et al. , “MitoTracker labeling in primary neuronal and astrocytic cultures: influence of mitochondrial membrane potential and oxidants,” J. Neurosci. Meth. 104(2), 165–176 (2001). 10.1016/S0165-0270(00)00340-X [DOI] [PubMed] [Google Scholar]
- 9.Teupser D., et al. , “Fluorescence-based detection of the CETP TaqIB polymorphism: false positives with the TaqMan-based exonuclease assay attributable to a previously unknown gene variant,” Clin. Chem. 47(5), 852–857 (2001). [PubMed] [Google Scholar]
- 10.Ma Z., et al. , “Laser-guidance based detection of cells with single-gene modification,” Appl. Phys. Lett. 92(21), 213902 (2008). 10.1063/1.2938020 [DOI] [PMC free article] [PubMed] [Google Scholar]


