

Abstract
Human STIL (SCL/TAL1 interrupting locus) protein maintains centriole stability and spindle pole localisation. It helps in recruitment of CENPJ (Centromere protein J)/CPAP (centrosomal P4.1-associated protein) and other centrosomal proteins. Mutations in STIL protein are reported in several disorders, especially in deregulation of cell cycle cascades. In this work, we examined the non-synonymous single nucleotide polymorphisms (nsSNPs) reported in STIL protein for their disease association. Different SNP prediction tools were used to predict disease-associated nsSNPs. Our evaluation technique predicted rs147744459 (R242C) as a highly deleterious disease-associated nsSNP and its interaction behaviour with CENPJ protein. Molecular modelling, docking and molecular dynamics simulation were conducted to examine the structural consequences of the predicted disease-associated mutation. By molecular dynamic simulation we observed structural consequences of R242C mutation which affects interaction of STIL and CENPJ functional domains. The result obtained in this study will provide a biophysical insight into future investigations of pathological nsSNPs using a computational platform.
Keywords: STIL protein, Docking, Molecular dynamics simulation, CENPJ protein
Abbreviations: STIL, SCL/TAL1 interrupting locus; CENPJ, Centromere protein J; MDS, Molecular dynamics simulation; RMSD, Root-mean-square deviation; Rg, Radius of gyration; SASA, Solvent-accessible surface area; RMSF, Root-mean square fluctuation; NHbonds, Number of hydrogen bonds; ED, Essential dynamics; nsSNPs, non-synonymous single nucleotide polymorphisms
Highlights
▸ A computational platform was used for pathogenic allele prediction. ▸ The Rs147744459 allele of STIL was predicted to be most associated with disease. ▸ The R242C mutation was shown to disrupt the binding affinity of STIL for CENPJ. ▸ The 3D conformation of STIL protein was drastically affected by this mutation. ▸ Loss of H-bond formation affected protein stability in the STIL R242C mutant.
1. Introduction
The biology of the centrosome is an area of research that is in its infancy. Mutation of the STIL protein functional domain and its participation in recruitment process of essential centrosomal proteins are two very important features in cancer, the underlying mechanisms for which are obscure. The centrosome acts as a main microtubule organising centre and regulates cell cycle progression [1–3]. Its duplication is initiated at G1/S transition phase by the sequential recruitment of a set of highly conserved proteins. STIL belongs to one of these highly conserved centrosomal protein family which along with CENPJ and hSAS6 (Spindle assembly abnormal protein 6 homolog) are co-localised to the base of procentriole [4]. It consists of 1288 amino acid residue and residues range from 231st to 619th reported to interact with CENPJ protein residues range from 895th to 1338th position [4]. Further the STIL–CENPJ complex binds to hSAS6 protein and forms a complex which is important for their co-localisation and centriole biogenesis. Recruitment and localisation of CENPJ by STIL protein is shown in Fig. 1. Level of STIL coding gene expression is reported to be high at the time of mitotic cell division [5,6], expressed in the developing cerebral cortex [7] and play an important role in normal human brain development. Previous researches has shown its role in autosomal recessive primary microcephaly [8–12], holoprosencephaly [13], embryonic lethality and marked apoptosis of the developing nervous system [14]. STIL null mouse embryos were lethal in the early stage of development with abnormal left–right specification [15]. Primary microcephaly (MCPH) is a congenital disorder in which the head circumference of a patient is greater than three standard deviations below the age- and sex-related population mean [9]. It mainly results from the hypoplasia of the cerebral cortex with a significant reduction in the brain [9]. Mutations in STIL have also been observed in causing MCPH due to the aberrant spindle positioning in progenitor cells during brain development [16]. STIL was also found to be expressed in several cases of cancers where its expression is correlated with an elevated mitotic index and cancer progression [17–22] providing a further insight into role of STIL protein in regulating mitotic cell cycle mechanism. The main objective of our investigations are, to analyses what are the mutations in STIL functional domain which can contributes to oncogenesis, to understand that how mutation in STIL protein can affect its conformational state in complex form and to understand disruption of recruitment process of STIL associate protein.
Fig. 1.
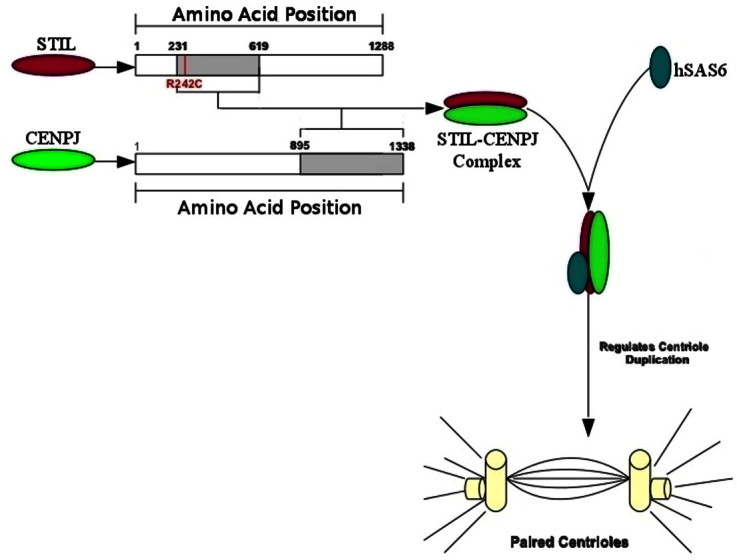
STIL, CENPJ and hSAS6 protein co-localisation process. STIL protein functional domain (in maroon colour) residues range from 230th to 619th and CENPJ protein functional domain (in green colour) residues range from 895th to 1338th. The STIL–CENPJ complex further binds to hSAS6 protein (in dark blue colour). Formation of STIL–CENPJ–hSAS6 complex is vital for their co-localisation to centrosome. (For interpretation of the references to colour in this figure legend, the reader is referred to the web version of this article.)
Advances in high-throughput genotyping and next generation sequencing have generated a vast amount of human genetic variation data. Single nucleotide polymorphism within protein coding regions are of particular importance owing to their potential to give rise to amino acid substitutions that affect protein structure and function which may ultimately lead to a disease state. SNP (single nucleotide polymorphism) refers to the variations in the nucleotide at the reference site from one nucleotide base to other [23]. Non-synonymous SNPs occurring in coding regions result in single amino acid polymorphisms (SAPs) that may affect protein function and lead to pathogenic phenotypes [24]. Non-synonymous single nucleotide polymorphisms (nsSNP) has the potential to alter the function of their corresponding protein, either directly or via disruption of structure. Hence they are of particular interest as candidates for further experimental assessment. About 41,744,328 rs human SNPs have been validated and submitted in NCBI dbSNP database [25]. Most of them are still uncharacterised in terms of their disease causing potential. The future of SNP analysis greatly lies in the development of personalised medicines that can facilitate the treatment of genomic variations induced disorders at a higher extent [26]. Here we used an effective set of computational techniques to prioritise the most deleterious nsSNPs reported in STIL gene. Accurate prediction of disease-related SNPs will facilitate in development of their potential cure through target based drug discovery and at the most newest evolving stage will promote the concept of personalised medicine in cancer treatment. To unravel the uncharacterised nsSNP's in STIL gene, here we used the computational techniques that help in predicting the alteration in structure, function and post-translational modification properties of the protein. Our approach was to combine empirical, statistical, neural network (NN) and Support Vector Machine (SVM) based analysis along with the tools that can predict the molecular changes introduced in the protein in order to predict the pathogenic nsSNPs from the given datasets. The tools used in this analysis have their different functionality. SIFT [27], Polyphen tool [28] and PANTHER [29] were used in order to identify structural basis of amino acids alteration and its functional significant in mutant STIL proteins. PhD-SNP [30], Pmut [31] and MutPred tool [32] were used to predict the molecular changes induced by the predicted mutations and their pathological status. Combining the results obtained by these classifiers we finally predict one novel mutation that may potentially disrupt the normal mechanism associated with STIL protein. Model structures native and mutant STIL protein and its biological partner CENPJ protein were generated by homology modelling and were used to investigate protein–protein interactions. Conformational flexibility of a protein molecule affects its interaction with ligand and its biological partners at different level [33–37]. In this work we have shown an effective way to predict disease associated nsSNPs and its possible structural consequences by using computational platform. Our data address these important questions by demonstrating that STIL mutation is the cause of aneuploidy and leads to structural damage of STIL–CENPJ complex by increased conformation flexibility.
2. Material and methods
2.1. Dataset collection
Human STIL [accession ID: NP_001041631] and CENPJ [accession ID: NP_060921] protein sequence data was collected form national centre for biological Information (NCBI) protein sequence database [38]. SNP information for our computational analysis was obtained from NCBI dbSNP (http://www.ncbi.nlm.nih.gov/snp/) [25]. Template structures [PDB ID: 1SEZ, 1GKA, 1YVV, 1TH0, 1ZR6, 2VVM, 3CHN, 1S58, 1WOR, 2YZS, 2VVM] were obtained from Brookhaven protein data bank [39] for homology modelling.
2.2. Disease-associated SNP prediction
The single nucleotide polymorphism occurring in the protein coding region may lead to the deleterious consequences in its 3D structure and thus may lead to disease-associated phenomena. Here we used SIFT [27], Polyphen [28], PANTHER [29], PhD-SNP [30], Pmut [31] and MutPred [32] tools in order to examine the disease-associated nsSNP occurring in the STIL protein coding region. SIFT uses sequence homology-based approach to classify amino acid substitutions [27]. The prediction score <0.05 is considered to be deleterious. The accuracy level of the SIFT program show 88.3–90.6% specificity and 67.4–70.3% sensitivity [27], when tested with different datasets of human variants. Polyphen checks if the amino acid change is occurring at the site that is highly conserved and the variation has any deleterious effect on the protein structure [28]. The position-specific independent count (PSIC) score difference of 1.5 and above obtained from Polyphen server is predicted to show functional and structural impact on protein [28]. In addition to this, we used PANTHER program which is a protein family and subfamily database and predicts the frequency of occurrence of amino acid at a particular position in evolutionary related protein sequences. The threshold subPSEC score of −3 has been assigned below which the predictions are considered as deleterious [29]. We filtered the nsSNPs that were combinedly predicted to be deleterious and damaging from these three servers. Further we used PhD-SNP, Pmut and MutPred tools to examine the disease-association of these filtered nsSNPs. PhD-SNP is SVM based classifier, trained over the million amino acid polymorphism datasets using supervised training algorithm whereas [30]. It predicts if the given nsSNPs has pathological effect. Pmut is a neural network based program which is trained on large database of neutral and pathological mutations [31]. MutPred is a web based tool, used to predict the molecular cause of disease related amino acid substitution [32]. It utilises several attributes related to protein structure, function, and evolution. It uses SIFT [27], PSI-BLAST [40], and Pfam profiles [41], along with some structural disorder prediction algorithms, including TMHMM [42], MARCOIL [43], B-factor prediction [43], and DisProt [44]. Functional analysis includes the prediction of DNA-binding site, catalytic domains, calmodulin-binding targets [45], and posttranslational modification sites [46–48]. Thus by combining the scores of all three servers, the accuracy of prediction rises to a greater extent. Finally we filtered the most pathological mutation by combining the scores of above servers.
2.3. Homology modelling
Residue ranges from 231st to 619th of STIL protein interacts with 895th to 1388th of CENPJ protein and are considered as crucial for their centrosomal co-localisation [4]. We modelled these functional domains by Modeller9.9 software package [49] in order to evaluate their structural and functional properties. 3D coordinates of PDB ID 1SEZ, 1GKA, 1YVV, 1TH0, 1ZR6 and 2VVM were used as template to model native and mutant STIL functional domain and PDB ID 3CHN, 1S58, 1WOR, 2YZS and 2VVM were used as template to model CPENJ functional domain protein. Modelled structures were refined by means of loop refining, checking wrong bond contacts and adding hydrogen atoms. The best selected structures were energy minimised by charmm27 forcefield for 5000 iterations using Gromacs 4.5.3 package [50]. Qualities of models were validated using ProCHECK [51] and ProSA server [52]. ProSA returns z-score that indicates overall model quality based on the Cα positions in 3D space.
2.4. Protein–protein interaction analysis
ClusPro is a fully automated web server for the prediction of protein–protein interactions [53]. It consists of two docking platform, DOT and ZDOCK, both of which are based on fast Fourier transform correlation techniques. DOT program was selected for our study as it uses electrostatic potential and surface complementarity between the two structures which helps in retaining the structures with good conformations. It runs on 128 Å × 128 Å × 128 Å grid, using a grid spacing of 1 Å. Obtained structures are then filtered using distance-dependent electrostatics and empirical potential energy scores. Clustering is carried out on the basis of pairwise RMSD scores. Obtained final structure is then refined by applying CHARMm forcefield. Optimised structures of each native and mutant STIL functional domain and CENPJ functional domain were used as an input set for docking analysis. Further we used InterProSurf [54] to decipher the interfacial residues in native and mutant complexes obtained from ClusPro server.
2.5. Molecular dynamics simulation
Molecular dynamics simulation was performed by using Gromacs 4.5.3 package [50] running on a single 2.8 GHz Pentium IV IBM machine with 3 MB RAM and running Ubuntu 11.10 Linux package. Complex structure of native and mutant STIL were used as starting point for MD simulations. Systems were solvated in a rectangular box with TIP3P water molecules at 10 Å marginal radius. At physiological pH the complex were found to be negatively charged, thus in order to make the simulation system electrically neutral, we added sodium ions (Na+) to the simulation box using the genion tool that accompanies with Gromacs package. Initially the solvent molecules were relaxed while all the solute atoms were harmonically restrained to their original positions with a force constant of 100 kcal/mol for 5000 steps. After this, whole molecular system was subjected to energy minimisation for 5000 iterations by steepest descent algorithm implementing GROMOS96 43a1 forcefield. Berendsen temperature coupling method [55] was used to regulate the temperature inside the box. Electrostatic interactions were computed using the Particle Mesh Ewald method [56]. The ionisation states of the residues were set appropriate to pH 7 with all histidine assumed neutral. The pressure was maintained at 1 atm with the allowed compressibility range of 4.5e−5 atm. SHAKE algorithm was used to constrain bond lengths involving hydrogen, permitting a time step of 2 fs. Van der Waals and Coulomb interactions were truncated at 1.0 nm. The non-bonded pair list was updated every 10 steps and conformations were stored every 0.5 ps. Position restraint simulation for 500 ps was implemented to allow solvent molecules to enter the cavity region of structure. Finally, systems were subjected to MD simulation for 5 ns. We then computed the comparative analysis of structural deviations in native and mutant structure. RMSD, RMSF, SAS and Rg analysis were carried out by using g_rms, g_rmsf, g_sas and g_gyrate tool respectively. Number of distinct hydrogen bonds formed by specific residues to other amino acids within the protein during the simulation (NH bond) were calculated using g_hbond. NH bond determined on the basis of donor–acceptor distance smaller than 0.35 nm and of donor–hydrogen-acceptor. We used g_analyze tool to calculate the average values and standard deviations of simulation output dataset. All the graphs were plotted using XMGRACE program.
2.6. Principal component analysis
The calculation of the eigenvectors and eigenvalues, and their projection along the first two principal components, was carried out using essential dynamics (ED) method according to protocol [57] within the Gromacs software package. The principle component analysis or ED is a technique that reduces the complexity of the data and extracts the concerted motion in simulations that are essentially correlated and presumably meaningful for biological function [57]. In the ED analysis, a variance/covariance matrix was constructed from the trajectories after removal of the rotational and translational movements. A set of eigenvectors and eigenvalues was identified by diagonalising the matrix. The eigenvalues represents the amplitude of the eigenvector along the multidimensional space, and the displacement of atoms along each eigenvector shows the concerted motions of protein along each direction. The movements of structures in the essential subspace were identified by projecting the Cartesian trajectory coordinates along the most important eigenvectors from the analysis. Backbone C-alpha bonds trajectories were obtained using g_covar and g_anaeig of Gromacs utilities.
3. Results
3.1. Prediction of deleterious nsSNP
SIFT server was used to calculate the tolerance score of the nsSNPs obtained from dbSNP database. Total 60 nsSNPs were computationally analyzed for their disease-association. Out of 60 input nsSNP dataset, 22 of them (V57L, N75I, R104L,H156R, Q228H, M238T, R242C, R281Q, S296F, R327W, E354Q, R734T, T762I, V788I, S811F, S874C, V1023L, S1086L, A1119E, P1194L, V1272I and V1278A) were predicted to be deleterious with tolerance index ≤0.05 (Table 1). Among these 22 deleterious nsSNPs 9 of them (R104L, Q228H, M238T, R242C, R281Q, S296F, V788I, A1119E and V1272I) were reported to be highly deleterious, with tolerance index = 0. To validate the deleterious SNPs predicted using SIFT program, we further used Polyphen program to examine the damaging probability of all the nsSNPs. Thirty mutations N75I, A86V, R104L, H156R, Q228H, M238T, R242C, R281Q, S296F, R327W, Q421P, K463M, Q468R, L485F, P497A, H677N, R734T, T762I, S811F, P851S, Q959H, H969R, H985R, V1008L, S1086L, A1119E, P1194L, R1232Q and V1278A were found to be deleterious with PSIC score > 1.5. Among these 30 deleterious nsSNPs out of which 12 mutations N75I, R104L, H156R, Q228H, M238T, R242C, S296F, Q468R, P851S, H969R, S1086L and P1194L were reported to be highly deleterious with PSIC score > 2. A good correlation was observed between SIFT and Polyphen scores. Total of 18 mutations N75I, R104L, H156R, Q228H, M238T, R242C, R281Q, S296F, R327W, Q421P, Q468R, R734T, T762I, S811F, S1086L, A1119E, P1194L, and V1278A were identified to be deleterious in SIFT as well as Polyphen server (Table 1). Combining the evolutionary conservation analysis and structural dependency of amino acid substitution over protein functionality we predicted 18 deleterious mutations which are dispersed in several structural domains of STIL protein. To further validate these results we carried HMM based statistical prediction method to identify the functionally significant point mutations using PANTHER tool. The mutations with subPSEC score < −3 has been reported to be probably deleterious. Fifteen mutations with subPSEC score < −3 was characterised to be deleterious. Two mutations R242C and S296F were predicted to be extremely deleterious with subPSEC score −5.68888 and −5.00677 respectively. These two mutations were also predicted to be highly deleterious by SIFT as well by Polyphen tools. Since result of PANTHER solely depends on the MSA profile, so the priority for prediction shall be given to SIFT and Polyphen scores. We filtered 10 mutations R104L, Q228H, M238T, R242C, S296F, R327W, S811F, A1119E, P1194L and V1278A that were commonly predicted to be deleterious mutants from all three servers (Table 1). Significant correlation between Polyphen and SIFT results was observed where they showed Pearson correlation coefficient value 0.403, whereas between SIFT and PANTHER it was 0.321 and between Polyphen and PANTHER it was 0.454. Our observation showed that there was higher correlation between Polyphen and PANTHER scores whereas the correlation between SIFT and PANTHER was significantly low. This shows that PANTHER program when combined with Polyphen, may provide a promising platform for in-silico SNP analysis.
Table 1.
Here the PSIC score obtained from Polyphen server, tolerance index obtained from SIFT server and subPSEC score obtained from PANTHER are displayed. Deleterious and damaging SNPs are displayed in bold.
| rs allele | Mutation | PSIC score | SIFT score | subPSEC |
|---|---|---|---|---|
| rs148783889 | T14I | 1.461 | 0.36 | −1.50036 |
| rs147576532 | Y44S | 1.027 | 0.65 | −1.50036 |
| rs61782730 | V57L | 0.612 | 0.05 | −1.50551 |
| rs144192357 | N75I | 2.029 | 0.04 | −2.99735 |
| rs147160336 | S76L | 0.251 | 1.00 | −1.54057 |
| rs3125630 | A86V | 1.795 | 1.00 | −2.67624 |
| rs143587840 | R104L | 2.567 | 0.00 | −3.7758 |
| rs141352790 | H156R | 2.667 | 0.01 | −2.55024 |
| rs148947235 | K205R | 0.474 | 0.09 | −1.70269 |
| rs145383640 | Q228H | 2.093 | 0.00 | −3.33271 |
| rs149813552 | M238T | 2.891 | 0.00 | −4.68992 |
| rs147744459 | R242C | 2.792 | 0.00 | −5.68888 |
| rs113209638 | R281Q | 1.892 | 0.00 | −2.32996 |
| rs140282820 | S296F | 2.133 | 0.00 | −5.00677 |
| rs142574808 | R327W | 1.540 | 0.04 | −4.05968 |
| rs141678367 | R352H | 0.569 | 0.21 | −1.25588 |
| rs184044615 | E354Q | 0.569 | 0.04 | −3.10115 |
| rs75426387 | A357T | 1.092 | 0.25 | −3.02814 |
| rs149185431 | S379F | 0.060 | 0.10 | −3.68242 |
| rs28472545 | Q421P | 1.951 | 0.22 | −3.04438 |
| rs28705368 | Q421H | 0.796 | 0.67 | −1.65307 |
| rs141830068 | K463M | 1.746 | 0.11 | −3.06604 |
| rs149867741 | Q468R | 2.006 | 0.01 | −1.65016 |
| rs139912214 | L485F | 1.686 | 0.48 | −1.97522 |
| rs114151695 | P497A | 1.843 | 0.31 | −1.4794 |
| rs114151695 | P497S | 0.634 | 0.84 | −2.04363 |
| rs144699266 | H579L | 1.380 | 0.93 | −1.65184 |
| rs140448154 | S673G | 1.288 | 0.50 | −1.87589 |
| rs185913484 | H677N | 1.965 | 0.64 | −1.55921 |
| rs141874074 | Q698H | 0.533 | 0.65 | −1.85194 |
| rs147076169 | R734T | 1.750 | 0.02 | −2.99245 |
| rs184844868 | T762I | 1.565 | 0.02 | −2.26164 |
| rs147955048 | K786R | 1.334 | 0.20 | −2.17844 |
| rs148818578 | G787S | 0.792 | 1.00 | −2.48601 |
| rs149697952 | V788I | 1.108 | 0.00 | −1.94137 |
| rs139459123 | S811F | 1.921 | 0.03 | −3.34182 |
| rs142290334 | K819R | 1.308 | 0.26 | −2.18138 |
| rs144219237 | P851S | 2.253 | 0.18 | −2.18439 |
| rs138355120 | S874C | 1.401 | 0.02 | −4.7463 |
| rs143211398 | A909G | 1.417 | 0.13 | −2.43026 |
| rs184086211 | Q926K | 1.150 | 0.41 | −0.83315 |
| rs35447382 | S952N | 0.202 | 0.67 | −0.99103 |
| rs150267502 | Q959H | 1.795 | 0.64 | −0.9765 |
| rs148193936 | H969R | 2.634 | 0.08 | −1.32937 |
| rs78932355 | T980A | 0.461 | 0.83 | −1.57167 |
| rs13376679 | H985R | 1.997 | 0.41 | −1.09928 |
| rs144111593 | V1008L | 1.558 | 0.07 | −2.76718 |
| rs144586803 | V1023L | 1.498 | 0.05 | −1.95788 |
| rs143956189 | N1057S | 0.639 | 0.66 | −1.09625 |
| rs190918041 | S1086L | 2.002 | 0.02 | −2.56936 |
| rs114431636 | A1119E | 1.881 | 0.00 | −4.58102 |
| rs112563569 | D1144N | 0.298 | 1.00 | −1.51967 |
| rs3766317 | A1146V | 1.204 | 0.28 | −1.12085 |
| rs145089798 | E1163K | 1.364 | 0.41 | N/A |
| rs139856969 | A1191T | 0.040 | 1.00 | −1.44233 |
| rs144746030 | P1194L | 2.224 | 0.02 | −3.69541 |
| rs148592489 | R1232Q | 1.612 | 0.38 | −2.6037 |
| rs142210835 | I1252V | 0.098 | 1.00 | −0.98147 |
| rs142282148 | V1272I | 1.108 | 0.00 | −2.51625 |
| rs138444507 | V1278A | 1.649 | 0.01 | −3.19615 |
3.2. Prediction of disease-associated nsSNPs
The goal of our work was to predict the most deleterious nsSNP in STIL protein coding gene that could disrupt its recruitment process to centrosomal region and thereby deregulating the centriole biogenesis and duplication mechanism. To further classify the predicted deleterious nsSNP's as disease related, we used Support Vector Machine based PhD-SNP tool. In total, 10 SNPs were selected for carrying out disease association study on the basis of the common SNPs predicted to be deleterious in SIFT, Polyphen and PANTHER tools, (Table 2). Prediction carried out by PhD-SNP depends on intensive supervised training for over million amino acid polymorphism datasets [56] and so the prediction efficiency is remarkably higher. Out of 10 input SNP dataset, 6 mutations R104L, Q228H, M238T, R242C, S296F and A1119E were predicted to be disease-associated (60%). To confirm this prediction, we further used artificial neural network (ANN) based Pmut tool, that predicted 7 pathological mutation out of the 10 which were given as input (Table 2). Six mutations M238T, R242C, S296F, R327W, A1119E and P1194L were found to be showing high pathological phenotype having pathogenicity index > 0.8. MutPred tool was the used to predict the SNP disease-association probability and probable change in the molecular mechanism in the mutant. We found 5 disease-associated mutations of which 3 mutations R104L, M238T and R242C were commonly reported by PhD-SNP and Pmut tool (Table 2). One mutation P1194L was predicted to be significant by MutPred and Pmut tools but was predicted to be non-disease-associated by PhD-SNP. Mutation R242C was found to be extremely deleterious with General probability ( g) score 0.781 and was also predicted to induce methylation at the neighbouring residue at 243rd position ( P = 0.0191) with a confident prediction hypothesis (Table 2). Hence it was selected for further structural and interaction studies. Other two mutations (R104L and M238T) were showing actionable hypothesis for their deleterious property with relatively low confidence of prediction as obtained from MutPred results (Table 2). Thus R104L and M238T were considered as unfit for further analysis. The correlation of prediction results obtained from PhD-SNP and Pmut, PhD-SNP and MutPred, and Pmut and MutPred was 0.356, 0.251 and 0.534 respectively. This showed that the prediction carried out by Pmut and MutPred has a significant correlation whereas it was least when PhD-SNP and MutPred was used. These statistics provided an insight into the mechanism of prediction which significantly differs among them as their predictions are based on the diverse range of biochemical parameters used by these tools.
Table 2.
The disease-associated SNPs are predicted from PhD-SNP server results, pathogenicity index obtained from Pmut server and g score, P score, molecular variations and prediction reliability calculated from MutPred server. Here the possible scores with disease-association probability are displayed in bold.
| SNP ID | Amino acid change | PhD-SNP result | Pathogenicity index | g score | P score | Molecular variation | Prediction reliability |
|---|---|---|---|---|---|---|---|
| rs143587840 | R104L | Disease | 0.7498 | 0.600 | 0.0384 | Loss of disorder | Actionable hypothesis |
| rs145383640 | Q228H | Disease | 0.4502 | 0.532 | 0.0587 | Loss of ubiquitination at K232 | No reliable inference |
| rs149813552 | M238T | Disease | 0.8069 | 0.616 | 0.0181 | Loss of sheet | Actionable hypothesis |
| rs149813552 | M238T | Disease | 0.8069 | 0.616 | 0.0217 | Loss of stability | Actionable hypothesis |
| rs147744459 | R242C | Disease | 0.8935 | 0.781 | 0.0191 | Gain of methylation at K243 | Confident hypothesis |
| rs140282820 | S296F | Disease | 0.8879 | 0.469 | 0.0016 | Gain of sheet | No reliable inference |
| rs142574808 | R327W | Neutral | 0.9749 | 0.471 | 0.0028 | Gain of sheet | No reliable inference |
| rs139459123 | S811F | Neutral | 0.4233 | 0.149 | 0.0241 | Loss of phosphorylation at S811 | No reliable inference |
| rs114431636 | A1119E | Disease | 0.8542 | 0.339 | 0.0472 | Loss of MoRF binding | No reliable inference |
| rs144746030 | P1194L | Neutral | 0.8819 | 0.512 | 0.0402 | Loss of disorder | Actionable hypothesis |
| rs138444507 | V1278A | Neutral | 0.3437 | 0.271 | 0.033 | Loss of methylation at K1279 | No reliable inference |
3.3. Homology modelling and docking analysis
Confidence levels of modelled structures were observed by evaluating ProCHECK and ProSA scores. Native STIL protein model showed 87.2% residues in allowed region, 0.9% in disallowed and z-score value of −7.86 whereas the mutant STILR242C protein model showed 85.4% residues in allowed, 0.9% in disallowed region and z-score value of −7.13. CENPJ modelled structure showed 83.7% residues in allowed, 0.4% in disallowed region and z-score value of −6.93. Docking of native and mutant STIL protein with CENPJ was carried out by ClusPro server. The binding free energy weighted score for native STIL–CENPJ complex was −1161.1 whereas for mutant STILR242C–CENPJ complex it was −987.7. Interfacial analysis of each complex was performed using InterProSurf. Native STIL showed more residues at interface as compared to mutant STILR242C in their complex with CENPJ protein (Table 3). Moreover, L291, L305, E309, A318, R320 and F322 were not present at interface of mutant STILR242C protein during complex formation with CENPJ (Table 3).
Table 3.
The interfacial residues of STIL – CENPJ complex. Bold residues are specific to the respective category and is absent in other.
| Protein complex | Interfacial residues in complex |
|---|---|
| Native STIL – CENPJ | D282, F283, E284, Q286, K287, E290, L291, K298, L305, E308, R309, K310, F312, E313, Y315, T316, A318, A319, R320, F322, P323, D324, K326, R328, E329, H356, R358, M380, P464. |
| Mutant STILR242C – CENPJ | D282, F283, E284, Q286, K287, E290, K298, E308, K310, F312, E313, Y315, T316, A319, P323, D324, K326, R328, E329, H356, R358, M380, F383. |
3.4. Molecular dynamics simulation of native and mutant STIL–CENPJ complex
We calculated the RMSD for all Cα atoms from the initial structure (Fig. 2). After 83 ps the native complex structure showed higher RMSD score till 414 ps, after which an abrupt rise in RMSD score was observed in mutant complex with RMSD value of ∼1.03 whereas native showed RMSD value of ∼0.65 at 5 ns. Higher RMSF values were seen for mutant protein complex as compared to the native (Fig. 3). Further we observed a high increase in energy value of mutant STILR242C–CENPJ domain docked structure as compared to the native (Fig. 4). The radius of gyration plot of Cα atoms of the mutant structure further showed higher fluctuation level as compared to native (Fig. 5). In native STIL–CENPJ domain docked structure the average Rg value was found to be 3.022105e+00 whereas for mutant it was 3.728599e+00. Further the mutant complex structure showed large Rg fluctuation with standard deviation score of 5.839118e−02 whereas for native it was found to be 4.284456e−02. Mutant STILR242C–CENPJ docked structure indicated greater values of SASA with time while native showed smaller values of SASA with time (Fig. 6). We observed notable differences in hydrogen pattern during simulation, where the mutant complex structure showed less participation in NH bonds formation with other amino acids, while in native complex structure showed more number of NH bonds (Fig. 7). The large-scale collective motions of the native and mutant protein using ED analysis were determined. The value for trace of the diagonalised covariance matrix for native protein was 46.3368 nm2 and for mutant it was 121.794 nm2 at 300 K. The mutant structure covered a larger region of phase space particularly along PC1 plane than native (Fig. 8). The snapshots of each complex conformation were observed at 0 ns, 0.9 ns, 1.8 ns, 2.7 ns, 3.6 ns and 4.8 ns during the simulations and it is depicted in Fig. 9. The Phi Psi angle change in native and mutant structure for 243rd position was examined to understand the structural dependency of prediction obtained from MutPred tool. A notable collapse in Psi angle at 243rd position was observed for mutant structure (Fig. 10).
Fig. 2.
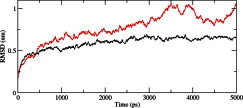
Time evolution of backbone RMSDs are shown as a function of time of the native and mutant STIL–CENPJ interaction domain complex at 300 K. The symbol coding scheme is as follows: native complex (in black colour) and mutant complex (in red colour). (For interpretation of the references to colour in this figure legend, the reader is referred to the web version of this article.)
Fig. 3.
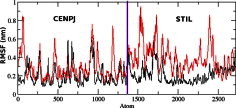
RMSF of the backbone C-alpha atoms for native and mutant structure at 300 K is shown. The symbol coding scheme is as follows: native complex (in black colour) and mutant complex (in red colour). (For interpretation of the references to colour in this figure legend, the reader is referred to the web version of this article.)
Fig. 4.
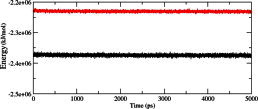
Plot of total energy as a function of time for the MD simulations. The symbol coding scheme is as follows: native complex (in black colour) and mutant complex (in red colour). (For interpretation of the references to colour in this figure legend, the reader is referred to the web version of this article.)
Fig. 5.
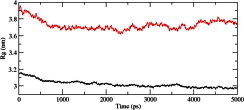
Radius of gyration of Cα atoms of native and mutant native and mutant structure versus time at 300 K. The symbol coding scheme is as follows: native complex (in black colour) and mutant complex (in red colour). (For interpretation of the references to colour in this figure legend, the reader is referred to the web version of this article.)
Fig. 6.
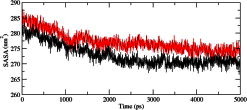
Solvent-accessible surface area (SASA) of native and mutant complex structure. The symbol coding scheme is as follows: native complex (in black colour) and mutant complex (in red colour). (For interpretation of the references to colour in this figure legend, the reader is referred to the web version of this article.)
Fig. 7.
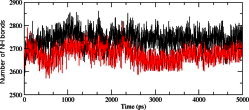
Average number of intramolecular hydrogen bonds in native and mutant complex structure versus time at 300 K. The symbol coding scheme is as follows: native complex (in black colour) and mutant complex (in red colour). (For interpretation of the references to colour in this figure legend, the reader is referred to the web version of this article.)
Fig. 8.
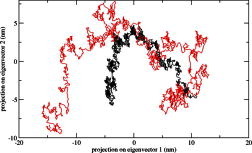
Projection of the motion of the protein in phase space along the first two principal eigenvectors at 300 K. The symbol coding scheme is as follows: native complex (in black colour) and mutant complex (in red colour). (For interpretation of the references to colour in this figure legend, the reader is referred to the web version of this article.)
Fig. 9.
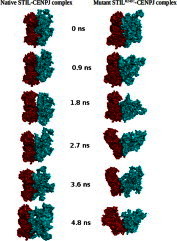
Surface representation of conformational states of native STIL–CENPJ and mutant STILR242C–CENPJ complex at different time intervals during simulations. STIL protein is shown in ruby colour and CENPJ shown in deep teal colour. (For interpretation of the references to colour in this figure legend, the reader is referred to the web version of this article.)
Fig. 10.
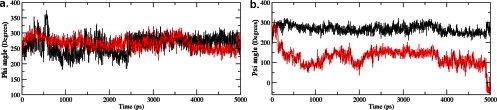
Phi and Psi angle deviation in native and mutant complex structure. (a) Phi angle deviation versus time intervals during simulations. (b) Psi angle deviation versus time intervals during simulations. The symbol coding scheme is as follows: native complex (in black colour) and mutant complex (in red colour). (For interpretation of the references to colour in this figure legend, the reader is referred to the web version of this article.)
4. Discussion
By the advancement in high throughput sequencing technologies the amount of data in databases are increasing exponentially. Certain amino acid substitution occurred as the cause of SNPs could possibly induce structural and functional damages. These may further lead to pathological phenotypic consequences. Majority of SNPs available in SNP databases are yet to be characterised in terms of their affect on structural and functional aspects of protein. We used set of computational tools to examine the nsSNPs in STIL protein coding gene and prioritised R242C mutation as deleterious and disease associated. The prediction was based on SIFT, Polyphen, PANTHER, PhD-SNP, Pmut and MutPred tools. Prediction carried out by these tools depends on their specific criterion and thus by combining the results obtained from these servers can together provide high prediction accuracy. Statistically observed, the correlation between the predictions carried by the multiple servers was not up to a significant level. The correlation coefficients between the SIFT, Polyphen and PANTHER was 0.32 to 0.45 which is not impressive. It seems as if the simple consensus prediction might not recognise the most deleterious nsSNPs, although the tools used in this work implements different computational approaches combinedly to examine the deleterious consequences of SNPs. It is possible that the consensus prediction might fail to report SNPs that may induce deleterious consequences on individual phenomenon, but the combined prediction made at the end in this work includes the usage of algorithms that calculates diverse properties associated with mutations and hence the accuracy of predicting the chance of reported SNP to be disease-association is high as compared to the approaches that implements these methodology separately. To verify this, we further carried MDS analysis and we observed that the predicted disease-associated SNP has induced major phenotypic consequence on the native conformation of the protein as well as its interaction behaviour.
To examine the structural consequences of predicted deleterious and disease-associated point mutation we further modelled the interaction domain of native and mutant STIL and CENPJ protein. The modelled structures were subjected to energy minimisation and docking studies. The binding free energy weighted score for native STIL–CENPJ complex was −1161.1 whereas for mutant STILR242C–CENPJ complex it was −987.7. The result obtained from ClusPro docking server implicates towards the loss of binding affinity of mutant STILR242C protein domain towards CENPJ. It is believed that the amount of atomic interactions between two protein molecules is directly related to number of interfacial residues present at their interface. Interfacial residual analysis of each complex was performed to understand the variation in docking score. Native STIL showed more residues at interface as compared to mutant STILR242C in their complex with CENPJ protein (Table 3). Higher docking score of native STIL–CENPJ complex was due to more interfacial residues of native STIL protein and that were available for interactions with CENPJ protein while compared to native STIL, mutant STIL acquired less number of interfacial residues and it was the reason for less docking score of mutant STILR242C–CENPJ complex. To investigate the dynamic behaviour of native and mutant structures in complex, we conducted molecular dynamic simulation of native and mutant STIL functional domain protein complex with CENPJ functional domain protein. We highlighted RMSF of C-alpha carbon by trajectory analysis obtained through MD simulation. Distinct NH bond analysis was performed to understand the flexibility behaviour of residues. In order to verify the system stabilised along the MD simulations, we showed the plot of energy variation for the MD simulations. We calculated the RMSD for all the Cα atoms from the initial structure, which were considered as a central criterion to measure the convergence of the protein system concerned (Fig. 2). In Fig. 2, mutant STILR242C–CENPJ docked structure showed overall greater RMSD scores as compared to native, resulting in a backbone RMSD of ∼1.03 nm and ∼0.6 nm respectively at the end of simulation. The energy plot was also in accordance to this result. We observed increase energy values of mutant STILR242C–CENPJ complex as compared to native complex (Fig. 4). Moreover, energy plot STIL–CENPJ complex clearly indicated that the mutant complex was less energetically stable as compared to native complex.
A more detailed picture of differences in residue mobility within and between simulations obtained from graph of the RMSF of Cα atoms relative to the average structure and it is showed in Fig. 3. In Fig. 3, mutant STIL protein backbone atoms showed more flexibility as compared to native in their complex form and behaviour also affect the flexibility behaviour of CENPJ domain in complex. The increased flexibility of mutant STIL in complex affects its binding behaviour with CENPJ protein and it was the reason of less docking score in docking process. We conducted Rg and SASA analysis to further evaluate conformational changes in native and mutant STIL protein complex. The Rg is defined as the mass-weighted root mean square distance of a collection of atoms from their common centre of mass. Hence, this analysis gives us insight into the overall dimensions of the protein. The plot of radius of gyration of Cα atoms of the protein versus time at 300 K is showed in Fig. 5. We observed the major fluctuation in both native and mutant between 0 and 5000 ps. The Rg graph implicates towards the high structural deviation of mutant in comparison to the native. In native complex the average Rg value was found to be 3.022105e+00 whereas for mutant it was 3.728599e+00 which indicated expanded conformation of mutant complex as compared to native. The change of SASA of the native and mutant structure with time is shown in Fig. 6. Mutant STILR242C–CENPJ docked structure indicated greater values of SASA with time while native STIL–CENPJ docked structure showed smaller values of SASA with time. The large fluctuation in radius of gyration in mutant indicated that the protein might be undergoing a significant structural transition. This was also supported by the fluctuations in solvent-accessible surface areas (Fig. 6). The expansion of mutant complex structure due to alteration in flexibility was further validated by observing SASA analysis.
Intermolecular NH bond was calculated for native and mutant complex during the simulation time and it is depicted in Fig. 8. More intermolecular NH bonds in native complex help it to maintain rigidity while less tendency of the mutant in NH bonds formation with neighbouring residues which makes it more flexible. Mutant structure Cα atoms has exhibited more flexibility and have also shown less participation in NH bonds with other amino acids, while in native structure it was more rigid and have more H-bonds. On the basis of RMSF observation and NH bond analysis, it is confirmed that the occurrence of the mutation leads to a more flexible conformation due to the formation of less number of hydrogen bonds.
A better view of dynamical mechanical properties of the investigated system has been obtained by using essential dynamics (ED) analysis. To further support our MD simulation result, the large-scale collective motions of the native and mutant structure using ED analysis were determined. The dynamics of two structures is best achieved via characterisation of its phase space behaviour. The eigenvectors of the covariance matrix are called its principle components. The change of particular trajectory along each eigenvector was obtained by this projection. The spectrum of the corresponding eigenvalues (Fig. 8) indicates that the fluctuation of the system is basically confined within the first two eigenvectors. The projection of trajectories obtained at 300 K onto the first two principal components (PC1, PC2) shows the motion of two proteins in phase space. On these projections, we see clusters of stable states. Two features are very apparent from these plots. Firstly, the clusters are well defined in native complex than mutant. Secondly, mutant complex covers a larger region of phase space particularly along PC1 plane than native and it is depicted in Fig. 8. Our observation thus corroborates with the idea of higher flexibility of mutant than native at 300 K. The overall flexibility of two proteins was also calculated by the trace of the diagonalised covariance matrix of the Cα atomic positional fluctuations. We have obtained the following values for native protein 46.3368 nm2 and mutant protein 121.794 nm2 again confirming the overall increased flexibility of mutant complex than native at 300 K. After observing RMSD, RMSF, Rg, SASA, NH bonds and PCA results, it was confirmed that mutation in STIL protein leads it toward expanded and flexible conformation and it affect the binding behaviour of mutant protein. The whole picture was cleared after analysing the snapshots of complex conformation during simulation (Fig. 9). Mutant complex started to form an open conformation after 2 ns timescale and continued till the end of simulation whereas no major unfolding and structural disruption was observed in native complex. This observation further supports our hypothesis, pointed towards the deleterious property of STIL protein R242C mutation.
In MutPred analysis, mutation at 242nd position from arginine to cysteine in STIL protein was predicted to induce methylation at 243rd position. In notion to understand the dynamic behaviour of leucine at 243rd position, we plotted the dihedral Phi (Fig. 10(a)) and Psi (Fig. 10(b)) angles of this residue of mutant and native structure. We observed a major angular variation in Psi angle of 243rd residue in mutant structure as compared to the native (Fig. 10(b)). It started from 200 and reached to 0 at 5 ns whereas in native it started from 230 and reached to 254 at 5 ns. Low relative variations were found in Phi angle at 243rd position of native and mutant. This observation showed the level of conformational variation in mutant at 243rd residue position as compared to the native and this conformational change might induce methylation as predicted by MutPred server. Our results reported that the substitution of cysteine at 242nd position in STIL has decreased the tendency to bind with CENPJ domain due to acquiring high flexible conformation and thus play major role in initiating pathogenic phenotype.
The observation obtained in this work could facilitate in future SNP characterisation and predicting their functional impacts. In previous study Kumar et al. [9] has reported mutations that were found to be directly associated with MCPH disorder. Although the mutations reported in their work were either nonsense variants or induced nucleotide deletion, which in turn led to the truncated protein, but it was notable to observe that all the mutations were found to be located in the exon18 position, in the C-terminal domain of protein. STIL protein has been recently shown to assist in the recruitment of CENPJ and hSAS6 proteins through its N-terminal region. Until now, there is no previous information regarding the amino acid variants in this region of STIL that may cause major functional loss or affect its scaffold cascades. Activity regulations of the cell cycle associated proteins are significantly dependent on the efficiency and specificity of the corresponding scaffold cascades. The scaffold mechanisms are maintained by the specific conformational and dynamic property of these proteins. Non-synonymous amino acid variations inducing damaging conformational changes in the protein will significantly affect its functional behaviour and thus will lead to the disease-associated phenomena. Our study has first time demonstrated the functional impact of computationally predicted N-terminal amino acid variant in STIL and has suggested its pathological consequences owing to the corresponding conformational changes. Further investigation will be required to examine the exact molecular mechanisms behind the pathogenicity that might be associated with this mutation and will significantly differ from the MCPH associated variants that has been reported in the C-terminal region of STIL protein [7]. Further it will also provide an insight into functional characteristics of its N-terminal region.
5. Conclusion
Non-synonymous SNPs (nsSNPs), account for the majority of human diseases. This occurs in the coding region of the gene and changes the amino acid residue at a particular position. Identifying these disease-associated SNPs and filtering the non-significant ones will facilitate in future genomics researches and drug discovery. Most of the traditional computational methods uses sequence or structure-based prediction techniques but are not much effective in genotype–phenotype correlation studies. Here we used the combination of deleterious SNP detection tools to predict the highly deleterious and disease associated mutations. Homology modelling, protein–protein interaction analysis and molecular dynamics simulation were further carried out. Mutation R242C was predicted as most deleterious and disease associated. Interaction analysis of native and mutant STIL protein with CENPJ provided clue to investigate the molecular dynamic behaviour of complex structure. Disorder in functionality of one protein may adversely affect the entire pathway [58]. Conformational analysis of STIL–CENPJ and STILR242C–CENPJ complex showed that mutation at 242nd position from arginine to cysteine drastically affects the native conformation of STIL protein and it might be a key factor behind disruption of centrosomal localisation of CENPJ protein. Genome-wide genetic alterations are fundamentally important for the development of cancers, but the proteomic of these aberrations is poorly understood. Our findings demonstrate a highly deleterious STIL mutation is the molecular basis of disruption of essential CENPJ recruitment process to centromere and causes aneuploidy, provide a framework for understanding oncogenesis and highlight the relationship between genomic and structural changes in human cancers. We believe our observations have critical implications for the understanding of STIL associated aneuploidy and the development of novel therapies for this disease.
Conflict of interest
Authors have no potential conflict of interest to disclose.
Acknowledgments
We gratefully acknowledge the management of Vellore Institute of Technology University for providing the facilities to carry out this work. We thank the anonymous reviewers for their helpful comments and critical reading of the manuscript.
References
- 1.Kumar A, Purohit R. Computational investigation of pathogenic nsSNPs in CEP63 protein. Gene. 2012;503:75–82. doi: 10.1016/j.gene.2012.04.032. [DOI] [PubMed] [Google Scholar]
- 2.Kumar A, Purohit R. Computational screening and molecular dynamics simulation of disease associated nsSNPs in CENP-E. Mutat Res 2012. doi:10.1016/j.mrfmmm.2012.08.005. [DOI] [PubMed]
- 3.Kumar A, Purohit R. Computational centrosomics: an approach to understand the dynamic behaviour of centrosome. Gene 2012. doi:10.1016/j.gene.2012.09.040 [DOI] [PubMed]
- 4.Tang CJ. The human microcephaly proteinSTIL interacts with CPAP and is required for procentriole formation. EMBO J. 2011;30:4790–4804. doi: 10.1038/emboj.2011.378. [DOI] [PMC free article] [PubMed] [Google Scholar]
- 5.Izraeli S. Expression of the SIL gene is correlated with growth induction and cellular proliferation. Cell Growth Differ. 1997;8:1171–1179. [PubMed] [Google Scholar]
- 6.Whitfield ML. Identification of genes periodically expressed in the human cell cycle and their expression in tumors. Mol Biol Cell. 2002;13:1977–2000. doi: 10.1091/mbc.02-02-0030.. [DOI] [PMC free article] [PubMed] [Google Scholar]
- 7.Smith CM. The mouse Gene Expression Database (GXD) Nucleic Acids Res. 2007;35:D618–D623. doi: 10.1093/nar/gkl1003. [DOI] [PMC free article] [PubMed] [Google Scholar]
- 8.Erez A. Sil overexpression in lung cancer characterizes tumors with increased mitotic activity. Oncogene. 2004;23:5371–5377. doi: 10.1038/sj.onc.1207685. [DOI] [PubMed] [Google Scholar]
- 9.Kumar A, Girimaji SC, Duvvari MR, Blanton SH. Mutations in STIL, encoding a pericentriolar and centrosomal protein, cause primary microcephaly. Am J Hum Genet. 2009;84:286–290. doi: 10.1016/j.ajhg.2009.01.017. [DOI] [PMC free article] [PubMed] [Google Scholar]
- 10.Kitagawa D. Spindle positioning in human cells relies on proper centriole formation and on the microcephaly proteins CPAP and STIL. J Cell Sci. 2011;124:3884–3893. doi: 10.1242/jcs.089888. [DOI] [PubMed] [Google Scholar]
- 11.Mochida GH. Genetics and biology of microcephaly and lissencephaly. Semin Pediatr Neurol. 2009;16:120–126. doi: 10.1016/j.spen.2009.07.001. [DOI] [PMC free article] [PubMed] [Google Scholar]
- 12.Mahmood S, Ahmad W, Hassan MJ. Autosomal recessive primary microcephaly (MCPH): clinical manifestations, genetic heterogeneity and mutation continuum. Orphanet J Rare Dis. 2011;6:39. doi: 10.1186/1750-1172-6-39. [DOI] [PMC free article] [PubMed] [Google Scholar]
- 13.Karkera JD. The genomic structure, chromosomal localization, and analysis of SIL as a candidate gene for holoprosencephaly. Cytogenet Genome Res. 2002;97:62–67. doi: 10.1159/000064057. [DOI] [PubMed] [Google Scholar]
- 14.Golling G. Insertional mutagenesis in zebrafish rapidly identifies genes essential for early vertebrate development. Nat Genet. 2002;31:135–140. doi: 10.1038/ng896. [DOI] [PubMed] [Google Scholar]
- 15.Lin SY, Rai R, Li K, Xu ZX, Elledge SJ. BRIT1/MCPH1 is a DNA damage responsive protein that regulates the Brca1-Chk1 pathway, implicating checkpoint dysfunction in microcephaly. Proc Natl Acad Sci USA. 2005;102:15105–15109. doi: 10.1073/pnas.0507722102. [DOI] [PMC free article] [PubMed] [Google Scholar]
- 16.Pfaff KL, Straub CT, Chiang K, Bear DM, Zhou Y, Zon LI. The zebra fish cassiopeia mutant reveals that SIL is required for mitotic spindle organization. Mol Cell Biol. 2007;27:5887–5897. doi: 10.1128/MCB.00175-07. [DOI] [PMC free article] [PubMed] [Google Scholar]
- 17.Erez A. The SIL gene is essential for mitotic entry and survival of cancer cells. Cancer Res. 2007;67:4022–4027. doi: 10.1158/0008-5472.CAN-07-0064. [DOI] [PubMed] [Google Scholar]
- 18.Kasai K, Inaguma S, Yoneyama A, Yoshikawa K, Ikeda H. SCL/TAL1 interrupting locus derepresses GLI1 from the negative control of suppressor-of-fused in pancreatic cancer cell. Cancer Res. 2008;68:7723. doi: 10.1158/0008-5472.CAN-07-6661. [DOI] [PubMed] [Google Scholar]
- 19.Colaizzo-Anas T, Aplan PD. Cloning and characterization of the SIL promoter. Biochim Biophys Acta. 2003;1625:207–213. doi: 10.1016/s0167-4781(02)00597-3. [DOI] [PubMed] [Google Scholar]
- 20.Bash RO. Clinical features and outcome of T-cell acute lymphoblastic leukemia in childhood with respect to alterations at the TAL1 locus: a Pediatric Oncology Group Study. Blood. 1993;81:2110–2117. [PubMed] [Google Scholar]
- 21.Aplan PD. Disruption of the human SCL locus by “illegitimate” V-(D)-J recombinase activity. Science. 1990;250:1426–1429. doi: 10.1126/science.2255914. [DOI] [PubMed] [Google Scholar]
- 22.Ramaswamy S, Ross KN, Lander ES, Golub TR. A molecular signature of metastasis in primary solid tumors. Nat Genet. 2003;33:49–54. doi: 10.1038/ng1060. [DOI] [PubMed] [Google Scholar]
- 23.Drabovich AP, Krylov SN. Identification of base pairs in single-nucleotide polymorphisms by MutS protein-mediated capillary electrophoresis. Anal Chem. 2006;78:2035–2038. doi: 10.1021/ac0520386. [DOI] [PubMed] [Google Scholar]
- 24.Capriotti E, Altman RB. Improving the prediction of disease-related variants using protein three-dimensional structure. BMC Bioinformatics. 2011;4:S3. doi: 10.1186/1471-2105-12-S4-S3. [DOI] [PMC free article] [PubMed] [Google Scholar]
- 25.Sherry ST. dbSNP: the NCBI database of genetic variation. Nucleic Acids Res. 2001;29:308–311. doi: 10.1093/nar/29.1.308. [DOI] [PMC free article] [PubMed] [Google Scholar]
- 26.Bailey RC. Research spotlight: new multiparameter bioanalytical technologies for applications in personalized medicine, drug discovery and fundamental biology. Bioanalysis. 2009;1:1043–1047. doi: 10.4155/bio.09.101. [DOI] [PMC free article] [PubMed] [Google Scholar]
- 27.Kumar P, Henikoff S, Ng PC. Predicting the effects of coding non-synonymous variants on protein function using the SIFT algorithm. Nat Protoc. 2009;4:1073–1081. doi: 10.1038/nprot.2009.86. [DOI] [PubMed] [Google Scholar]
- 28.Sunyaev S. Prediction of deleterious human alleles. Hum Mol Genet. 2001;10:591–597. doi: 10.1093/hmg/10.6.591. [DOI] [PubMed] [Google Scholar]
- 29.Thomas PD. PANTHER: a library of protein families and subfamilies indexed by function. Genome Res. 2003;13:2129–2141. doi: 10.1101/gr.772403. [DOI] [PMC free article] [PubMed] [Google Scholar]
- 30.Capriotti E, Calabrese R, Casadio R. Predicting the insurgence of human genetic diseases associated to single point protein mutations with support vector machines and evolutionary information. Bioinformatics. 2006;22:2729–2734. doi: 10.1093/bioinformatics/btl423. [DOI] [PubMed] [Google Scholar]
- 31.Ferrer-Costa C, Gelpí JL, Zamakola L, Parraga I, de la Cruz X, Orozco M. PMUT: a web-based tool for the annotation of pathological mutations on proteins. Bioinformatics. 2005;14:3176–3178. doi: 10.1093/bioinformatics/bti486. [DOI] [PubMed] [Google Scholar]
- 32.Li B. Automated inference of molecular mechanisms of disease from amino acid substitutions. Bioinformatics. 2009;25:2744–2750. doi: 10.1093/bioinformatics/btp528. [DOI] [PMC free article] [PubMed] [Google Scholar]
- 33.Purohit R, Rajasekaran R, Sudandiradoss C, Doss GP, Ramanathan K, Sethumadhavan R. Studies on flexibility and binding affinity of Asp25 of HIV-1 protease mutants. Int J Biol Macromol. 2008;42:386–391. doi: 10.1016/j.ijbiomac.2008.01.011. [DOI] [PubMed] [Google Scholar]
- 34.Purohit R, Sethumadhavan R. Structural basis for the resilience of Darunavir (TMC114) resistance major flap mutations of HIV-1 protease. Interdiscip Sci. 2009;1:320–328. doi: 10.1007/s12539-009-0043-8. [DOI] [PubMed] [Google Scholar]
- 35.Purohit R, Rajendran V, Sethumadhavan R. Relationship between mutation of serine residue at 315th position in M. tuberculosis catalase-peroxidase enzyme and Isoniazid susceptibility: an in silico analysis. J Mol Mod. 2011;17:869–877. doi: 10.1007/s00894-010-0785-6. [DOI] [PubMed] [Google Scholar]
- 36.Purohit R, Rajendran V, Sethumadhavan R. Studies on adaptability of binding residues and flap region of TMC-114 resistance HIV-1 protease mutants. J Biomol Struct Dyn. 2011;29:137–152. doi: 10.1080/07391102.2011.10507379. [DOI] [PubMed] [Google Scholar]
- 37.Rajendran V, Purohit R, Sethumadhavan R. In silico investigation of molecular mechanism of laminopathy cause by a point mutation (R482W) in lamin A/C protein. Amino acids. 2012;43:603–615. doi: 10.1007/s00726-011-1108-7. [DOI] [PubMed] [Google Scholar]
- 38.Sayers EW, Barrett T, Benson DA, Bryant SH, Canese K. Database resources of the National Center for Biotechnology Information. Nucleic Acids Res. 2009;37:D5–D15. doi: 10.1093/nar/gkn741. [DOI] [PMC free article] [PubMed] [Google Scholar]
- 39.Berman HM. The Protein Data Bank. Nucleic Acids Res. 2000;28:235–242. doi: 10.1093/nar/28.1.235. [DOI] [PMC free article] [PubMed] [Google Scholar]
- 40.Altschul SF. Gapped BLAST and PSI- BLAST: a new generation of protein database search programs. Nucleic Acids Res. 1997;25:3389–3402. doi: 10.1093/nar/25.17.3389. [DOI] [PMC free article] [PubMed] [Google Scholar]
- 41.Punta M. The Pfam protein families database. Nucleic Acids Res. 2012;40:D290–D301. doi: 10.1093/nar/gkr1065. [DOI] [PMC free article] [PubMed] [Google Scholar]
- 42.Krogh A, Larsson B, von Heijne G, Sonnhammer EL. Predicting transmembrane protein topology with a hidden Markov model: application to complete genomes. J Mol Biol. 2001;305:567–580. doi: 10.1006/jmbi.2000.4315. [DOI] [PubMed] [Google Scholar]
- 43.Delorenzi M, Speed T. An HMM model for coiled-coil domains and a comparison with PSSM-based predictions. Bioinformatics. 2002;18:617–625. doi: 10.1093/bioinformatics/18.4.617. [DOI] [PubMed] [Google Scholar]
- 44.Sickmeier M. DisProt: the database of disordered proteins. Nucleic Acids Res. 2007;35:D786–D793. doi: 10.1093/nar/gkl893. [DOI] [PMC free article] [PubMed] [Google Scholar]
- 45.Radivojac P. Calmodulin signaling: analysis and prediction of a disorder-dependent molecular recognition. Proteins. 2006;63:398–410. doi: 10.1002/prot.20873. [DOI] [PubMed] [Google Scholar]
- 46.Thusberg J, Olatubosun A, Vihinen M. Performance of mutation pathogenicity prediction methods on missense variants. Hum Mutat. 2001;32:358–368. doi: 10.1002/humu.21445. [DOI] [PubMed] [Google Scholar]
- 47.Iakoucheva LM. The importance of intrinsic disorder for protein phosphorylation. Nucleic Acids Res. 2004;32:1037–1049. doi: 10.1093/nar/gkh253. [DOI] [PMC free article] [PubMed] [Google Scholar]
- 48.Radivojac P. Identification, analysis, and prediction of protein ubiquitination sites. Proteins. 2010;78:365–380. doi: 10.1002/prot.22555. [DOI] [PMC free article] [PubMed] [Google Scholar]
- 49.Fiser A, Sali A. Modeller: generation and refinement of homology-based protein structure models. Methods Enzymol. 2003;374:461–491. doi: 10.1016/S0076-6879(03)74020-8. [DOI] [PubMed] [Google Scholar]
- 50.Hess B, Kutzner C, van der Spoel D, Lindahl E. GROMACS 4: algorithms for highly efficient, load-balanced, and scalable molecular simulation. J Chem Theory Comput. 2008;4:435–447. doi: 10.1021/ct700301q. [DOI] [PubMed] [Google Scholar]
- 51.Laskowski RA, MacArthur MW, Moss DS. Thornton JM: PROCHECK-a program to check the stereochemical quality of protein structures. J App Cryst. 1993;26:283–291. [Google Scholar]
- 52.Wiederstein M, Sippl MJ. ProSA-web: interactive web service for the recognition of errors in three-dimensional structures of proteins. Nucleic Acids Res. 2007;35:W407–W410. doi: 10.1093/nar/gkm290. [DOI] [PMC free article] [PubMed] [Google Scholar]
- 53.Comeau SR, Gatchell DW, Vajda S, Camacho CJ. ClusPro: a fully automated algorithm for protein–protein docking. Nucleic Acids Research. 2004;32:W96–W99. doi: 10.1093/nar/gkh354. [DOI] [PMC free article] [PubMed] [Google Scholar]
- 54.Negi SS, Schein CH, Oezguen N, Power TD, Braun W. InterProSurf: a web server for predicting interacting sites on protein surfaces. Bioinformatics. 2007;23:3397–3399. doi: 10.1093/bioinformatics/btm474. [DOI] [PMC free article] [PubMed] [Google Scholar]
- 55.Berendsen HJC, Postma JPM, van Gunsteren WF, DiNola A, Haak JR. Molecular dynamics with coupling to an external bath. J Chem Phys. 1984;8:3684–3690. [Google Scholar]
- 56.Cheatham TE, Miller JL, Fox T, Darden TA, Kollman PA. Molecular dynamics simulations on solvated biomolecular systems: the particle mesh Ewald method leads to stable trajectories of DNA, RNA, and proteins. J Am Chem Soc. 1995;14:4193–4194. [Google Scholar]
- 57.Amadei A, Linssen ABM, Berendsen HJC. Essential dynamics of proteins. Proteins. 1993;17:412–425. doi: 10.1002/prot.340170408. [DOI] [PubMed] [Google Scholar]
- 58.Kumar A, Mishra M. Computational analysis of genetic network involved in pancreatic cancer in human. BMC Bioinformatics. 2011;12(Suppl. 11):A11. [Google Scholar]