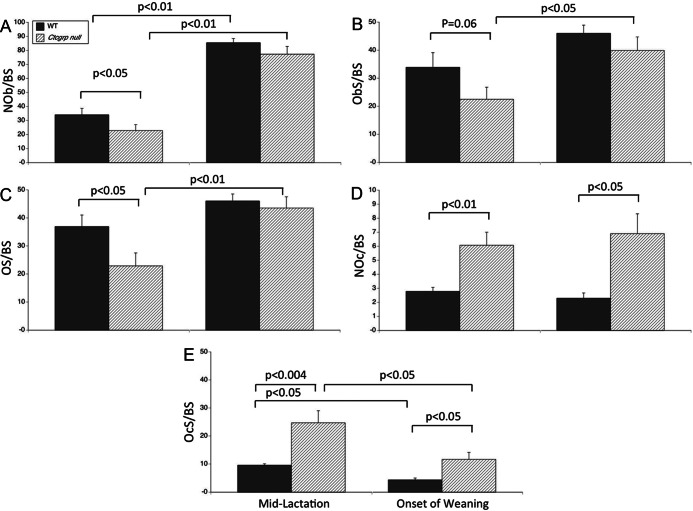
Figure 2.
Histomorphometry of tibiae at midlactation and onset of weaning. Similar to the vertebrae, osteoblast parameters (A–C, left panels) were halved, whereas osteoclast parameters (D and E, left panels) were doubled in lactating Ctcgrp null mice vs WT mice. These findings are consistent with Ctcgrp null mice losing twice as much BMC as WT mice during lactation. At the onset of postweaning, osteoblast parameters (A–C, right panels) increased. The relative increase was greater in Ctcgrp null mice such that osteoblast parameters no longer differed between genotypes. In Ctcgrp null mice, osteoclast parameters (D and E, right panels) remained double the WT values, but osteoclast surface (E, right panel) declined significantly in both genotypes from midlactation. NOb/BS, osteoblast number; NOc/BS, osteoclast number; ObS/BS, osteoblast surface; OcS/BS, osteoclast surface; OS/BS, osteoid surface.

