

Abstract
Objective
Glucocorticoid (GC) therapy is associated with increased fracture risk in rheumatoid arthritis (RA) patients. To elucidate the cause of this increased risk, we examined the effects of chronic inflammatory-erosive arthritis and GC treatment on bone quality, structure, and biomechanical properties in a murine model.
Methods
Transgenic mice expressing human TNF-α-transgene (TNF-tg) with established arthritis and wild-type (WT) littermates were continually treated with GC (subcutaneous prednisolone controlled-release pellet; 5 mg/kg/day) or placebo for 14, 28 and 42 days. Microstructure, biomechanical properties, chemical composition, and morphology of tibiae and lumbar vertebral bodies were assessed by micro-CT, biomechanical testing, Raman spectroscopy, and histology, respectively. Serum markers of bone turnover were also determined.
Results
TNF-tg and GC treatment additively decreased mechanical strength and stiffness in both tibiae and vertebral bodies. GC treatment in the TNF-tg mice increased the ductility of tibiae under torsional loading. These changes were associated with significant alterations in the biochemical and structural composition of the mineral and organic components of the bone matrix, a decrease in osteoblast activity and bone formation, and an increase in osteoclastic activity.
Conclusions
Our findings indicate that the concomitant decrease in bone strength and increase in ductility associated with chronic inflammation and GC therapy, coupled with the significant changes in the bone quality and structure, may increase the susceptibility of the bone to failure under low energy loading. This may explain the mechanism of symptomatic insufficiency fractures in patients with RA receiving GC therapy without radiographic manifestation of fracture.
Keywords: Glucocorticoid, Rheumatoid Arthritis, Bone Quality, Degree of Mineralization
Introduction
Nearly 1.3 million Americans are affected by the debilitating autoimmune inflammatory disease rheumatoid arthritis (RA). To ease the pain of inflammation, RA patients are routinely prescribed glucocorticoid (GC) therapy, which unfortunately leads to bone loss and increases the incidence of symptomatic insufficiency fractures, with rates reaching 30 to 50% (1). RA has been demonstrated to be an independent risk factor for fractures, which in 70% of the cases could be classified as insufficiency fractures (2, 3). Changes in systemic bone metabolism associated with RA could be attributed to pro-inflammatory cytokines such as tumor necrosis factor alpha (TNF-α) (4–7), which are released from local inflammatory lesions into systemic circulation. Previous studies have demonstrated that TNF-α overexpression significantly increases osteoclast activity and decreases osteocalcin levels in mice (8). Furthermore, Diarra et al. demonstrated a significant increase in Dkk-1 level in the TNF-tg mice, which implicates a deficiency in bone formation in this model (9) Collectively, these observations indicate that systemic inflammation involving overexpression of TNF-α leads to a decoupling of osteoblast-mediated bone formation and osteoclast-mediated bone resorption, effecting an imbalance in bone metabolism towards bone loss. Administration of GCs has also been identified as a substantial risk factor for fragility fracture (2, 10). Numerous studies have demonstrated that GCs have a strong negative effect on bone metabolism, leading to deterioration in bone quantity and quality. The pathogenesis of GC-induced osteoporosis has also been attributed to an imbalance in bone turnover; however, there are multiple factors influencing bone metabolism that confound our ability to identify the underlying mechanisms leading to bone fragility. These factors include age, gender, disease severity and duration, level of physical activity, and the concomitant use of GCs and other immunosuppressive agents (11). However, these factors are not independently presented in clinical cases of RA or GC-induced osteoporosis, which confounds our ability to clinically assess fracture risk in these patients.
In this study, we sought to investigate how chronic inflammation leads to fracture risk and how GC therapy increases this risk in the setting of inflammatory-erosive arthritis. We hypothesized that the mechanism of the additive effect of GCs on fracture risk in patients with RA encompasses reductions in bone strength due to decreasing bone quantity (e.g. due to osteoclastic erosion) as a result of the inflammatory condition, and deterioration in bone quality at the microstructural and compositional levels as a consequence of the GC therapy. We also sought to understand why RA patients receiving long-term GC therapy have a higher risk for insufficiency fracture at various sites of the skeleton that are less common in primary osteoporosis.
To address these questions, an established transgenic mouse model, which expresses human TNF-α-transgene (TNF-tg) was chosen as a model of inflammatory-erosive arthritis for this study based on the observation that these mice develop generalized osteoporosis, severe local erosion of cartilage and bone, and periarticular osteopenia similar to the clinical presentation of RA (5, 6, 8, 12, 13). Specifically, we investigated the effects of TNF-α chronic overexpression, GC treatment, and the combination of these two factors on bone quality in polyarthritic TNF-tg mice and healthy wild-type (WT) mice using histology, serum analysis, Raman spectroscopy, micro computed tomography imaging, and detailed biomechanical analysis of long bone diaphysis (mid-shaft tibiae) and flat bones (vertebral bodies).
Materials & Methods
Animals and experimental design
All animal studies were performed in accordance with protocols approved by the University of Rochester’s Committee on Animal Resources. Experiments were performed with male TNF-tg mice and WT littermate controls. Based on our previous study on the natural history of joint inflammation in this transgenic mouse (14), we initiated GC administration at the age of 5 months when mice invariably develop severe joint arthritis.
Five-month-old male mice received, by subcutaneous implantation, either placebo or prednisolone pellets (Innovative Research of America, Sarasota, FL, USA), which release GCs at a dosage of 5mg/kg/day, as previously described (15). The mice were divided into 4 groups (n=12 per group). Groups 1 and 2 were WT littermates that received placebo or prednisolone, respectively. Groups 3 and 4 were TNF-tg mice that received placebo or prednisolone, respectively. The mice were sacrificed at 14, 28, or 42 days post-treatment respectively (n=4 per time point per treatment), and blood was immediately collected from the vena cava during autopsy and the serum was stored at −80°C until biochemical markers analysis. The left tibiae were examined by Raman spectroscopy after which they were stored at −80°C until microcomputer tomography (micro-CT) analysis and subsequent biomechanical testing. To evaluate the baseline (day 0) values of all measured parameters, a separate set of 8 WT littermates and 8 TNF-tg mice were sacrificed at the age of 5 months.
Raman spectroscopic analysis of bone chemical composition
Raman spectroscopy was used to measure the biochemical composition of each tibia as previously described (16, 17). Briefly, spectra were acquired from the medial side of the proximal, distal, and mid-diaphysis regions of the excised tibiae with an exposure time of 300 s per region. A locally constructed Raman spectroscopy system delivered approximately 80 mW of 830-nm excitation light to a 1.5-mm diameter spot on the surface of the bone. Following acquisition, the spectra were background corrected, smoothed, and normalized to the area under the amide I peak near 1660 cm−1. A number of metrics related to bone biochemistry were calculated, including the mineral-to-matrix ratio (MTMR; PO43−/amide I, 960 cm−1/1660 cm−1 peak area ratio), which describes the degree of phosphate mineralization, the carbonate-to-phosphate ratio (CTPR; CO32−/PO43−, 1070 cm−1/960 cm−1 peak area ratio), which describes the amount of carbonate substitution in the apatite crystal lattice, and the 1660 cm−1/1690 cm−1 intensity ratio. The PO43−, CO32−, and amide I peak-areas were calculated by summing the Raman intensity between 900 cm−1 and 990 cm−1, 1040 cm−1 and 1120 cm−1, and 1630 cm−1 and 1730 cm−1, respectively.
Micro-CT bone structure analysis
Left tibiae and L2 vertebral bodies were scanned and measured individually by micro-CT (VivaCT 40; Scanco Medical, Bassersdorf, Switzerland), at a 10.5-micron isotropic resolution using an integration time of 300 ms, energy of 55 kVp, and intensity of 145 μA. Thresholds for segmentation of trabecular bone and cortical bone as determined apriori were 375 and 423 mg HA/ccm, respectively, based on comparing the grey scale images with the binary images per published standards (18).
The whole bone mineral density (BMD, mg HA/ccm) of each tibia was measured in the proximal half of the bone. A volume of interest of 502.5 μm (50-slices) encompassing the region of the proximal metaphysis, distal to the growth plate was used to assess trabecular bone morphology. For L2 vertebral bodies, the centrum of each specimen, from cephalad to caudal endplates and inside the endosteal margin, was used to assess trabecular bone. Cortical bone was assessed over 200 μm thick (19-slices) regions of the tibial mid-diaphysis and the mid-level of L2 vertebral body, and the results for tibia and L2 vertebral body were averaged over these slices.
Trabecular bone parameters of the tibial metaphysis and vertebral body, including bone volume fraction (BV/TV), connectivity density (Conn.D), structural model index (SMI), trabecular number (Tb.N), trabecular thickness (Tb.Th), and trabecular separation (Tb.Sp), were determined using Scanco’s 3D analysis tools (direct model) (18). For cortical bone analysis of the tibiae, tissue mineral density (TMD, calibrated to hydroxyapatite), cortical thickness (Ct.Th), and polar moment of inertia (J) were determined using the manufacturer’s analysis tools.
Biomechanical testing
The biomechanical properties of the proximal third of the tibial diaphysis were measured by torsional testing as previously described (19). The ends of the tibiae were cemented into square 6.35mm2 aluminum tube holders using PMMA and were then hydrated and mounted on an EnduraTec TestBenchTM system (200N.mm torque cell; Bose Corporation, Minnetonka, MN) and tested in torsion at a rate of 1°/s. The data were used to determine the yield and maximum torques, torsional rigidity, energy to yield and maximum torques, and post-yield rotation and energy. The post-yield rotation, a measure of ductility, was defined as the normalized rotational deformation (radians of rotation divided by specimen gage length) beyond the yield point up to the point of maximum load. The yield point was determined by the intersection of the torque-normalized rotation curve with a line parallel to the linear elastic region, offset by 0.0007 rad/mm (approximately 0.065% strain), based on standard recommendations (20).
The L2 vertebral bodies were tested in compression following modified published methods (5). In brief, the end plates of the vertebral body were cemented onto small plastic plates using PMMA to ensure axial alignment of the bodies and even load distribution. The specimens were hydrated and then tested in compression, with a 1N preload, at a rate of 1 mm/min until failure using a DynaMight 8841 servo-hydraulic materials testing machine (Instron, Norwood, MA). Compressive data were analyzed similar to the torsional data, with displacements normalized by the height of each vertebral body, to determine the corresponding mechanical parameters in compression.
Biochemical markers of bone turnover
Sandwich enzyme-linked immunosorbent assays (ELISA) were performed using commercially available kits to determine serum levels of osteocalcin (Biomedical Technologies), Dickkopf related protein 1 (Dkk-1; R&D Systems), and type 5b tartrate-resistant acid phosphatase (TRAP5b; Immunodiagnostic Systems). All samples were assayed in duplicates. A standard curve was generated for each protein, and the absolute concentrations were extrapolated from the standard curve.
Histology and histomorphometry
The tibiae were fixed in 10% neutral buffered formalin, and decalcified in 10% EDTA. For each specimen, at least two nonconsecutive 3-μm paraffin embedded mid-sagittal sections were stained for tartrate resistant acid phosphatase (TRAP) activity. Two nonconsecutive parasagittal sections, which are at least 100μm apart, were measured in each animal and average values were used. Therefore, a total of 14 fields (0.875mm2) per animal were analyzed. Histomorphometric analysis for osteoclast activity was performed using Osteometrics software (OsteoMetrics, Inc., Decatur, GA). The number of osteoclasts per millimeter of trabecular bone surface (Tb.Oc.N/BS) and on endosteal cortical bone surface (E.Ct.Oc.N/BS) was measured at the proximal metaphyses of the tibiae and the proximal tibial diaphyses, respectively.
TUNEL staining was performed on paraffin sections of the tibiae using an ApopTag® Peroxidase In Situ Apoptosis Detection Kit (Millipore, Billerica, MA) according to the manufacturer’s instructions. To calculate the percentage of osteocyte apoptosis, an average of 1000 osteocytes were counted from the cortical bone of the tibial diaphysis.
For dynamic bone formation analysis, calcein (10 mg/kg) and alizarin red (10 mg/kg) were injected subcutaneously 7 and 2 days before the mice were sacrificed. Distal femurs were fixed in 10% neutral buffered formalin and subjected to undecalcified tissue processing. The specimens were dehydrated in a graded ethanol series, embedded in glycolmethacrylate, and sectioned at 5 μm in the coronal plane. Trabecular bone at the distal metaphysis of each femur was observed by fluorescence microscopy (Axio Imager M1m, Carl Zeiss) to evaluate dynamic parameters for bone formation. Interlabel width, single- and double-labeled surface perimeter (sLS and dLS), and total bone surface (BS) were measured. Mineral apposition rate (MAR), mineralized surface (mineralized surface/bone surface [MS/BS]), and bone formation rate (BFR/BS) were calculated from the sLS, dLS, and BS according to Parfitt et al (21).
Statistical analysis
Two-way analysis of variance (ANOVA) tests were used to determine the statistical significance of the treatment (GC), genotype (TNF-tg), and their interaction effect on each measured parameter. Student’s t-tests were used to compare baseline values of WT and TNF-tg mice. Significance was defined as p<0.05.
Results
Effects of TNF-α chronic overexpression and GC treatment on bone biomechanical properties
The torsional biomechanical properties of the proximal tibiae were evaluated at 0, 14, 28, and 42 days post pellet-implantation. In general, the placebo treated tibiae from both WT and TNF-tg mice did not exhibit any significant changes over time, and the treatment-related differences were qualitatively similar at each time point. Thus, only day 42 data are discussed here in detail (Fig. 1).
Figure 1. Biomechanical properties of tibial diaphysis under torsional loading.

A: Averaged torque-rotation curves of each experimental group at 42 days post-treatment. Error bars represent the standard error of the mean torques (vertical bars) and rotations (horizontal bars) at the maximum loading point (solid bars) and yield point (dashed bars). B–G: Biomechanical parameters of tibiae derived from torsional testing after 42 days of treatment. Bars represent group means and error bars represent the standard deviation (n=4 per group). H: Summary of p-values from two-way ANOVA tests of the biomechanical parameters at 42 days of treatment. Statistical significance was defined as p < 0.05.
At day 42, the tibiae from GC-treated TNF-tg mice were significantly weaker, more compliant, and more ductile (Fig. 1A). Compared to placebo-treated WT mice, tibiae from GC-treated WT mice exhibited a significant decrease in yield and maximum torques, respectively (Fig. 1-B and -C) (p<0.05). Chronic overexpression of TNF-α independently decreased the yield and maximum torques compared to placebo-treated WT tibiae (p<0.05). Treatment of the TNF-tg mice with GC further decreased the yield and maximum torques of the tibiae compared to placebo-treated WT bones (p<0.05). However the interaction of chronic TNF-α overexpression and GC treatment were not significant (Fig. 1-H), indicating additive but not synergistic effects of these risk factors on long bone fragility. GC treatment had no significant effects on the torsional rigidity (Fig. 1-D). However the chronic overexpression of TNF-α resulted in significant decreases in torsional rigidity of the tibiae compared to WT (p<0.05 – Fig. 1-H) with no significant interaction effects. The energy to yield (Fig. 1-E), however, was significantly decreased by both chronic overexpression of TNF-α and GC treatment with no significant interaction. The energy to maximum torque or toughness (Fig. 1-F) was decreased by GC in WT mice, but was increased by GC in TNF-tg mice and showed a significant interactive effect. The post-yield rotation was increased by GC treatment (Fig. 1-G) with no significant interaction effects.
Biomechanical properties from compression tests of L2 vertebral bodies at day 42 post-treatment are shown in Figure 2. The maximum compressive force (Fig. 2-A) was decreased by GC treatment (p<0.05) regardless of the genotype. Chronic overexpression of TNF-α also reduced the compressive strength (p<0.05) compared to WT specimens. However, there were no significant interaction effects on the maximum compressive force between chronic overexpression of TNF-α and GC treatment. Similar trends were observed for the yield force (Fig. 2B), albeit significant reductions were only observed due to chronic overexpression of TNF-α (p<0.05). Despite trends suggesting decreased compressive stiffness due chronic overexpression of TNF-α, there were no significant effects of genotype and treatment (Fig. 2-C). Despite trends suggesting decreases in the energy to maximum force (Fig. 2-D) and post-yield strain (Fig. 2-E) with both chronic overexpression of TNF-α and GC treatment, these effects were not statistically significant.
Figure 2. Biomechanical properties of L2 vertebral bodies examined by compression testing at day 42 after treatment.
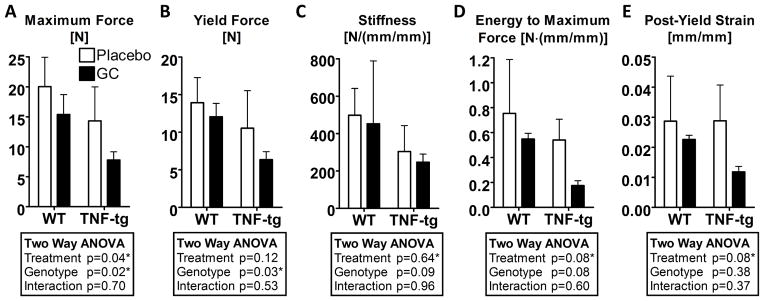
Bars represent group means and error bars represent the standard deviation (n=4 per group). A summary of p-values from two-way ANOVA tests of the biomechanical parameters at 42 days of treatment is tabulated for each of the compressive properties. Statistical significance was defined as p < 0.05.
Effects of TNF-α chronic overexpression and GC treatment on cortical and trabecular bone structure and volume
The BMD of the proximal half of the whole tibia was significantly decreased by overexpression of TNF-α, while the effects of GC treatment were not statistically significant (Table 1). The main effect of overexpression of TNF-α had a statistically significant impact upon the Conn.D, Tb.N, Tb.Th, Tb.Sp, Ct.TMD, Ct.Th, and J values. GC treatment had a statistically significant effect only upon the Ct.TMD. None of the interaction effects were statistically significant.
Table 1.
Micro-CT parameters of tibiae and L2 vertebral bodies (Mean ± SD)
| Day 0 (5 months old)
|
Day 42 post-treatment
|
Two-way ANOVA (p-value)
|
||||||||
|---|---|---|---|---|---|---|---|---|---|---|
| WT | TNF-tg | WT
|
TNF-tg
|
Treatment | Genotype | Interaction | ||||
| Placebo | GC | Placebo | GC | |||||||
| Placebo vs GC | WT vs TNF-tg | |||||||||
| Tibia Proximal Half | BMD (mgHA/ccm) | 1121±31 | 1099±48 | 1089±18 | 1072±25 | 1048±16 | 1038±7 | 0.16 | 0.001* | 0.74 |
|
| ||||||||||
| Tibial Metaphysis Trabecular Region | BV/TV (%) | 19.3±4 | 11.1±5.7 | 13.9±2.6 | 14±7 | 11.5±6.2 | 9.9±6.7 | 0.81 | 0.29 | 0.77 |
| Conn.D (1/mm3) | 110±36 | 81±49 | 90±16 | 78±60 | 30±9 | 44±22 | 0.95 | 0.01* | 0.45 | |
| SMI | 1.9±0.5 | 2.4±0.5 | 2.1±0.3 | 2.3±0.5 | 2.1±0.7 | 2.6±0.6 | 0.19 | 0.57 | 0.64 | |
| Tb.N (1/mm) | 5.0±0.4 | 4.6±0.9 | 4.1±0.2 | 4.4±0.9 | 3.3±0.1 | 3.9±0.4 | 0.07 | 0.03* | 0.69 | |
| Tb.Th (mm) | 0.057±0.004 | 0.043±0.006 | 0.052±0.006 | 0.052±0.009 | 0.042±0.006 | 0.037±0.002 | 0.54 | 0.001* | 0.4 | |
| Tb.Sp (mm) | 0.19±0.02 | 0.22±0.04 | 0.24±0.02 | 0.23±0.05 | 0.3±0.01 | 0.25±0.03 | 0.07 | 0.01* | 0.25 | |
|
| ||||||||||
| Tibial Diaphysis Cortical Region | TMD (mgHA/ccm) | 1240±26 | 1210±23 | 1270±25 | 1240±34 | 1234±12 | 1204±23 | 0.03* | 0.01* | 0.99 |
| Ct.Th (mm) | 0.22±0.01 | 0.17±0.01 | 0.21±0.03 | 0.19±0.02 | 0.16±0.01 | 0.15±0.02 | 0.19 | 0.0003* | 0.56 | |
| J (mm4) | 0.26±0.06 | 0.2±0.04 | 0.33±0.11 | 0.26±0.08 | 0.16±0.05 | 0.15±0.03 | 0.24 | 0.002* | 0.37 | |
|
| ||||||||||
| L2 Trabecular Bone | BV/TV (%) | 22.9±2.8 | 17.1±2.8 | 21.3±2.1 | 20.4±4.5 | 12.3±3.6 | 15.0±1.2 | 0.62 | 0.001* | 0.31 |
| Conn.D (1/mm3) | 243±44 | 209±45 | 173±36 | 143±25 | 126±21 | 141±27 | 0.63 | 0.12 | 0.15 | |
| SMI | 1.0±0.2 | 1.5±0.2 | 0.9±0.1 | 1.2±0.3 | 1.3±0.5 | 1.6±0.2 | 0.10 | 0.04* | 0.89 | |
| Tb.N (1/mm) | 5.3±0.4 | 5.1±0.4 | 4.7±0.5 | 4.4±0.3 | 4.2±0.2 | 4.4±0.3 | 0.80 | 0.21 | 0.23 | |
| Tb.Th (mm) | 0.048±0.003 | 0.042±0.002 | 0.050±0.006 | 0.052±0.006 | 0.044±0.006 | 0.042±0.002 | 0.97 | 0.01* | 0.5 | |
| Tb.Sp (mm) | 0.18±0.01 | 0.19±0.02 | 0.21±0.02 | 0.22±0.02 | 0.23±0.01 | 0.22±0.02 | 0.94 | 0.23 | 0.31 | |
|
| ||||||||||
| L2 Cortical Bone | Ct.Th (mm) | 0.069±0.007 | 0.062±0.005 | 0.073±0.009 | 0.066±0.004 | 0.058±0.008 | 0.054±0.005 | 0.16 | 0.004* | 0.61 |
In L2 vertebral bone, chronic overexpression of TNF-α significantly decreased BV/TV and Tb.Th, and increased SMI, but had no effect on Conn.D, Tb.N, or Tb.Sp (Table 1). GC treatment did not significantly influence any of these microstructural parameters. As with the tibiae, the Ct.Th of the L2 vertebral bodies was significantly decreased by overexpression of TNF-α, while GC treatment induced no statistically significant effects despite decreasing trends.
Effects of TNF-α chronic overexpression and GC treatment on Raman spectroscopic parameters
Overexpression of TNF-α significantly and GC treatment independently decreased the MTMR of the proximal tibia, which indicates a reduction in the mineralization of the bone, and significantly increased CTPR, which indicates the amount of carbonate substitution for phosphate or hydroxide in the mineral crystals (Table 2). These changes are consistent with other studies that observed an increase in the CTPR in rodent bones due to aging (22). Overexpression of TNF-α did not affect the 1660 cm−1/1690 cm−1 intensity ratio, however, GC treatment significantly increased this parameter. There were no interactive effects of chronic overexpression of TNF-α and GC treatment on any of the Raman spectroscopy parameters.
Table 2.
Raman spectroscopic biochemical parameters§ of the tibiae (Mean ± SD)
| Day 0 (5 months old)
|
Day 42 post-treatment
|
Two-way ANOVA (p-value)
|
|||||||
|---|---|---|---|---|---|---|---|---|---|
| WT | TNF-tg | WT
|
TNF-tg
|
Treatment Placebo vs GC |
Genotype WT vs TNF-tg |
Interaction | |||
| Placebo | GC | Placebo | GC | ||||||
| MTMR | 1.02±0.08 | 0.85±0.22 | 1.00±0.08 | 0.87±0.07 | 0.87±0.17 | 0.72±0.04 | 0.02* | 0.02* | 0.88 |
|
| |||||||||
| CTPR | 0.99±0.06 | 1.06±0.12 | 1.00±0.03 | 1.05±0.03 | 1.04±0.09 | 1.12±0.02 | 0.02* | 0.06 | 0.67 |
|
| |||||||||
| 1660 cm−1/1690 cm−1 Ratio | 0.98±0.11 | 0.99±0.24 | 1.00±0.02 | 1.10±0.06 | 0.99±0.14 | 1.13±0.06 | 0.02* | 0.85 | 0.64 |
The Raman parameters have been normalized by the average value calculated among mice in the WT placebo-treated group. (Normalization values were 3.1, 0.3, and 1.7 for the MTMR, CTPR, and 1660 cm−1/1690 cm−1 intensity ratio, respectively).
Effects of TNF-α chronic overexpression and GC treatment on systemic bone metabolism
Serum TRAP5b level was significantly increased in TNF-tg mice compared to WT mice at baseline as shown in Figure 3. Chronic overexpression of TNF-α and GC treatment also increased TRAP5b levels in both WT and TNF-tg mice at 14 days post-treatment. While the effect of overexpression of TNF-α on TRAP5b levels was also statistically significant at days 28 and 42, the GC treatment effects were not significant at these time points, suggesting that the GC treatment-induced osteoclast activation is transient. Joint synovitis and bone destructive changes were seen in all TNF-tg mice (Fig. 3B-M); however, these lesions were limited to the joint region and did not progress beyond the epiphysis (Fig. 3 H-M). The number of osteoclasts was slightly increased in TNF-tg mice in both trabecular bone and cortical bone. GC treatment dramatically increased the number of osteoclasts on both trabecular bone surfaces and endocortical surfaces at 14 days post-treatment, but these effects were lessened at 28 days post-treatment (Fig. 3 N-Q).
Figure 3. TNF-tg mice have higher osteoclast activity than WT mice and GC treatment transiently increases osteoclast activity.

A represents serum TRAP5b levels as measured by ELISA. B-M show representative TRAP stained micrographs of the proximal tibia at day 14 post-treatment. Osteoclasts were stained red. B–D: WT mouse treated with placebo, E–G: WT mouse treated with GCs, H–J: TNF-tg mouse treated with placebo, K–M: TNF-tg mouse treated with GCs. Higher magnification micrographs of trabecular regions (C, F, I, L) and cortical regions (D, G, J, M) are shown. N–Q represent histomorphometry plots obtained from TRAP staining micrographs. N and O represent the number of osteoclasts on the bone surface of trabecular bone (Tb.Oc.N/BS) at day 14 and 28 post-treatment respectively. P and Q represent the number of osteoclasts on the endosteal surface of cortical bone (E.Ct.Oc.N/BS) at day 14 and 28 post-treatment respectively. Bars represent group means and error bars represent the standard deviation (n=4 per group). A summary of p-values from two-way ANOVA of the data is tabulated for each measure. Statistical significance was defined as p < 0.05.
Serum osteocalcin level showed a decreasing trend, albeit insignificant, in TNF-tg mice compared to WT as shown in Figure 4A, consistent with our previously published observations (8). At day 14, GC treatment dramatically decreased osteocalcin levels in both WT and TNF-tg mice. This trend persisted in GC treated animals throughout the observation period of 42 days. Serum Dkk-1 levels showed an opposite trend to osteocalcin. Dkk-1 was significantly elevated in TNF-tg mice compared to WT mice at day 0. GC treatment also significantly increased Dkk-1 levels in both WT and TNF-tg mice (Fig. 4B).
Figure 4. GCs suppressed bone formation in both WT and TNF-tg mice.

A and B show time course changes in serum osteocalcin (OC) and Dkk-1 levels, respectively, as measured by ELISA. C-J show representative micrographs of trabecular bone labeled with calcein green and alizarin red (5 days intervals). C–F are representative merged bright field micrographs with the green and red fluorescence micrographs. G–J are higher magnification merged green and red fluorescence micrographs (bar = 50μm). C & G: WT mouse treated with placebo, D & H: WT mouse treated with GCs. E & I: TNF-tg mouse treated with placebo, F & J: TNF-tg mouse treated with GCs. K–M represent the mineral apposition rate (MAR), mineralization surface/bone surface (MS/BS), and bone formation rate/bone surface (BFR/BS) from day 21 to day 26 post-treatment. N represents the percentage of osteocyte apoptosis in cortical bone of the tibial diaphysis at day14 post-treatment. Bars represent group means and error bars represent the standard deviation (n=4 per group). A summary of p-values from the statistical analysis of the data is tabulated for each of the parameters. Statistical significance was defined as p < 0.05.
Analysis of bone formation rates from day 21 to day 26 on day 28 specimens revealed that double-labeled surfaces decreased in specimens from GC-treated WT and TNF-tg mice (Fig. 4 C, D, E, F). The distance between double labeling was smaller in GC-treated mice (Fig. 4 G, H, I, J). MAR (Fig. 4K) was significantly decreased by GC treatment and MS/BS (Fig. 4L) was significantly decreased by both GC treatment and the TNF-α transgene. Consequently, BFR/BS, which is calculated from MAR and MS/BS was suppressed in placebo-treated TNF-tg mice compared to placebo-treated WT mice, and was also suppressed by GC treatment in both WT mice and TNF-tg mice (Fig. 4M). The percentage of apoptotic osteocytes was significantly larger in the GC-treated mice. However, the percentage of apoptotic osteocytes in the GC-treated TNF-tg mice was only 2% on average (Fig. 4N).
Discussion
The results of this study show that chronic overexpression of TNF-α significantly decreases bone strength and that GC treatment has an additive negative impact on bone strength in the TNF-tg mouse model of RA. These results are consistent with the findings in clinical studies, which report that RA patients who are not taking GCs have an increased risk of fracture and that GC treatment independently increases fracture risk in RA patients (2, 23). The results of this study support our hypothesis by demonstrating that GCs mainly induce biochemical changes in bone; however, the mechanism of increased fracture risk caused by the inflammatory-erosive arthritis appears to be more complicated than hypothesized. Chronic overexpression of TNF-α significantly decreased bone quality parameters including trabecular and cortical bone architecture and composition of bone matrix including TMD, suggesting that chronic inflammation has pleiotropic effects on bone metabolism as reported previously (4, 7).
We observed different results from biomechanical testing of long bone diaphyses (mid-shaft tibiae) and flat bones (vertebral bodies) under different modes of loading (in torsion and compression, respectively). It should be noted that torsional testing of the tibiae was performed since it represents a mode of loading that commonly leads to long bone fractures in humans. However, qualitatively similar results would be expected from bending tests as has been reported during skeletal growth (24) and in a model of skeletal fragility (25). In contrast to the increased ductility observed in the tibiae, the vertebral bones exhibited decreased ductility under compressive loading. In both compressive and torsional loading, the mineral phase primarily contributes to the stiffness (elastic modulus) and yield strength (26–28). However, the mechanisms of plastic deformation (ductility) in bone are different between torsional and compressive loading (27, 29–31). Under tensile and shear stresses, as the bone yields and failure initiates in the form of micro-cracks through the mineral phase, the collagen matrix can act as a significant toughening mechanism against failure (30). Ductility in the compression of vertebral bodies largely arises from structural plasticity, which refers to the geometric displacement of composite materials in the cortical bone (i.e. slip-planes) (31) as well as buckling of individual trabeculae (32). Thus we propose that the increased yielding of the more ductile long bone without fracture may lead to microfractures and diffuse damage that are undetectable by radiographs but can become symptomatic with pain and edema, which are the hallmarks of insufficiency fractures. Further, deterioration in the bone matrix biochemical composition (MTMR and CPTR) as well as in macrostructure including cortical thickness, polar moment of inertia, and mineral density likely contribute to the increased fragility fracture risk in cortical bone (33).
In addition to changes in the degree of mineralization (MTMR) and relative carbonate content (CTPR), we observed an alteration of the 1660 cm−1/1690 cm−1 intensity ratio in GC-treated mice as measured by Raman spectroscopy. Infrared spectroscopy studies have shown that this parameter is indicative of the ratio of mature (pyridinoline) to immature (dehydro-dihydroxylysinonorleucine or deH-DHLNL) collagen cross-links (34). Therefore, the GC-induced increase in the 1660 cm−1/1690 cm−1 intensity ratio suggests that collagen maturity may be increased by GC treatment. Given that newly formed “young bone” contains less mature pyridinoline cross-links, a GC-induced increase in collagen maturity is considered to reflect strong inhibition of new bone formation (35). This change in the collagen matrix may be associated with alterations in the biomechanical properties of bone that were observed in this study, consistent with reports that collagen cross-linking is an important determinant of bone strength, especially in post-yield mechanical properties (36–39).
One limitation in this study is that the TNF-Tg animals lost body mass over time compared to WT. In addition, all animals lost body mass with GC treatment (data not shown). While normalization of structural properties by body mass could theoretically correct for size differences, it may not be appropriate in this study as GC treatment and inflammatory arthritis might also effect changes in physical activity and food intake due to pain, joint dysfunction, and systemic inflammation. These are difficult to quantify and account for. Therefore, we believe that the effects of GC treatment and joint arthritis on bone biomechanics encompass the changes in body mass, physical activity, food intake, and other symptoms associated with bone metabolism.
As for the biological mechanisms responsible for increased fracture risk due to erosive arthritis and GC treatment, most of our findings are consistent with current concepts of the pathophysiology of GC- and RA-induced osteoporosis (4, 10, 11, 40). Both GC therapy and RA induce a slower bone turnover with a disproportionate increase in bone resorption over a reduction in bone formation. This phenomenon can be explained by the direct negative effect of GCs and proinflammatory cytokines on osteoblasts and osteoblastic precursor cells (4–6, 8, 41). Our data suggest that Wnt signaling inhibitor Dkk-1 contributes to both GC- and RA-induced suppression of systemic bone formation. This idea is not novel and has been reported in recent studies (9, 42, 43). Other studies using mice show that GCs induce osteocyte apoptosis, resulting in an enlargement of their lacunar space and the generation of a surrounding sphere of hypomineralized bone (15, 44–47). In this study; however, the percentage of apoptotic osteocytes was slightly increased following GC treatment in TNF-tg mice with the maximum ratio of 2%, but was unchanged by GC treatment in WT mice.
Although increased serum TRAP5b may be largely due to increased osteoclast activity at inflamed joints in TNF-tg mice, increased osteoclast activity at the tibial diaphysis (Fig. 4N&P) indicates that enhanced bone resorption may also occur at sites outside of joints. This is not surprising because of increased circulating proinflammatory cytokines such as TNF-α and osteoclast precursors (48). Interestingly, we found that while increased osteoclast activity is persistent in TNF-tg mice, GC-induced osteoclastogenesis appears to be transient. Similar observations have been reported in both clinical and animal studies (15, 49). Reduction of osteoprotegerin (OPG) levels, which antagonizes receptor activator of NFκB ligand (RANKL) stimulation of osteoclast differentiation, in the early phase of GC treatment may be associated with the transient increase in osteoclast activity (50).
A limitation of this study is the small sample size at each time point. To assess the sample size effect on the validity of the conclusions from the multiple comparisons, the positive false discovery rate, or the expected proportion of significant parameters that are false positives, was calculated using the distribution of p-values from all multiple comparisons (51). Specifically, this estimate (along with a 95% confidence interval) was 0.03 [0.01 0.06], 0.05 [0.02 0.09], and 0.20 [0.09 0.52] for the genotype, treatment, and interaction effects, respectively, suggesting that the majority of the statistically significant findings described herein were not false discoveries, despite the small sample size.
CONCLUSIONS
Chronic overexpression of TNF-α and GC treatment additively decrease bone strength and increase its ductility with concomitant deterioration in bone microstructure and biochemical composition. Changes in tissue mineralization, microstructure, and organic matrix crosslinking may be associated with the high incidence of insufficiency fractures at various sites in patients with RA receiving GC therapy. These observations have important implications for the development of therapeutic strategies for RA.
Acknowledgments
Masahiko Takahata and Jason R Maher contributed equally to this work and share first author status. We would like to thank Ryan Tierney and the histology core for their excellent technical assistance. We also thank Michael Thullen for assistance with micro-CT. The 3647 line of human TNF-tg mice, which develops inflammation and erosive arthritis, was originally acquired from Dr. George Kollias (Institute of Immunology, Alexander Fleming Biomedical Sciences Research Center, Vari, Greece). This work was funded in part by a University of Rochester Provost’s Multidisciplinary Award and NIH Grants R21AR061285, R01s AR048697, AR053586, AR54041, and P30 AR061307.
References
- 1.Angeli A, Guglielmi G, Dovio A, Capelli G, de Feo D, Giannini S, et al. High prevalence of asymptomatic vertebral fractures in post-menopausal women receiving chronic glucocorticoid therapy: a cross-sectional outpatient study. Bone. 2006;39(2):253–9. doi: 10.1016/j.bone.2006.02.005. [DOI] [PubMed] [Google Scholar]
- 2.Kanis JA, Johansson H, Oden A, Johnell O, de Laet C, Melton IL, et al. A meta-analysis of prior corticosteroid use and fracture risk. Journal of bone and mineral research : the official journal of the American Society for Bone and Mineral Research. 2004;19(6):893–9. doi: 10.1359/JBMR.040134. [DOI] [PubMed] [Google Scholar]
- 3.Nampei A, Hashimoto J, Koyanagi J, Ono T, Hashimoto H, Tsumaki N, et al. Characteristics of fracture and related factors in patients with rheumatoid arthritis. Modern rheumatology/the Japan Rheumatism Association. 2008;18(2):170–6. doi: 10.1007/s10165-008-0032-5. [DOI] [PubMed] [Google Scholar]
- 4.Goldring SR. Inflammatory mediators as essential elements in bone remodeling. Calcified tissue international. 2003;73(2):97–100. doi: 10.1007/s00223-002-1049-y. [DOI] [PubMed] [Google Scholar]
- 5.Guo R, Yamashita M, Zhang Q, Zhou Q, Chen D, Reynolds DG, et al. Ubiquitin ligase Smurf1 mediates tumor necrosis factor-induced systemic bone loss by promoting proteasomal degradation of bone morphogenetic signaling proteins. The Journal of biological chemistry. 2008;283(34):23084–92. doi: 10.1074/jbc.M709848200. [DOI] [PMC free article] [PubMed] [Google Scholar]
- 6.Kaneki H, Guo R, Chen D, Yao Z, Schwarz EM, Zhang YE, et al. Tumor necrosis factor promotes Runx2 degradation through up-regulation of Smurf1 and Smurf2 in osteoblasts. The Journal of biological chemistry. 2006;281(7):4326–33. doi: 10.1074/jbc.M509430200. [DOI] [PMC free article] [PubMed] [Google Scholar]
- 7.Nanes MS. Tumor necrosis factor-alpha: molecular and cellular mechanisms in skeletal pathology. Gene. 2003;321:1–15. doi: 10.1016/s0378-1119(03)00841-2. [DOI] [PubMed] [Google Scholar]
- 8.Zhao L, Huang J, Zhang H, Wang Y, Matesic LE, Takahata M, et al. Tumor necrosis factor inhibits mesenchymal stem cell differentiation into osteoblasts via the ubiquitin E3 ligase Wwp1. Stem Cells. 2011;29(10):1601–10. doi: 10.1002/stem.703. [DOI] [PMC free article] [PubMed] [Google Scholar]
- 9.Diarra D, Stolina M, Polzer K, Zwerina J, Ominsky MS, Dwyer D, et al. Dickkopf-1 is a master regulator of joint remodeling. Nat Med. 2007;13(2):156–63. doi: 10.1038/nm1538. [DOI] [PubMed] [Google Scholar]
- 10.Pennisi P, Trombetti A, Rizzoli R. Glucocorticoid-induced osteoporosis and its treatment. Clin Orthop Relat Res. 2006;443:39–47. doi: 10.1097/01.blo.0000200238.29931.1f. [DOI] [PubMed] [Google Scholar]
- 11.Goldring SR, Goldring MB. Rheumatoid Arthritis and other Inflammatory Joint Pathologies. In: Seibel MJ, Robins SP, Bilezikian JP, editors. Dynamics of Bone and Cartilage Metabolism. Burlington, MA: Academic Press; 2006. pp. 843–69. [Google Scholar]
- 12.Li P, Schwarz EM. The TNF-alpha transgenic mouse model of inflammatory arthritis. Springer Semin Immunopathol. 2003;25(1):19–33. doi: 10.1007/s00281-003-0125-3. [DOI] [PubMed] [Google Scholar]
- 13.Keffer J, Probert L, Cazlaris H, Georgopoulos S, Kaslaris E, Kioussis D, et al. Transgenic mice expressing human tumour necrosis factor: a predictive genetic model of arthritis. EMBO J. 1991;10(13):4025–31. doi: 10.1002/j.1460-2075.1991.tb04978.x. [DOI] [PMC free article] [PubMed] [Google Scholar]
- 14.Proulx ST, Kwok E, You Z, Beck CA, Shealy DJ, Ritchlin CT, et al. MRI and quantification of draining lymph node function in inflammatory arthritis. Ann N Y Acad Sci. 2007;1117:106–23. doi: 10.1196/annals.1402.016. [DOI] [PubMed] [Google Scholar]
- 15.Lane NE, Yao W, Balooch M, Nalla RK, Balooch G, Habelitz S, et al. Glucocorticoid-treated mice have localized changes in trabecular bone material properties and osteocyte lacunar size that are not observed in placebo-treated or estrogen-deficient mice. J Bone Miner Res. 2006;21(3):466–76. doi: 10.1359/JBMR.051103. [DOI] [PMC free article] [PubMed] [Google Scholar]
- 16.Maher JR, Berger AJ. Determination of Ideal Offset for Spatially Offset Raman Spectroscopy. Appl Spectrosc. 2010;64(1):61–5. doi: 10.1366/000370210790571936. [DOI] [PubMed] [Google Scholar]
- 17.Maher JR, Takahata M, Awad HA, Berger AJ. Raman spectroscopy detects deterioration in biomechanical properties of bone in a glucocorticoid-treated mouse model of rheumatoid arthritis. Journal of Biomedical Optics. 2011;16(8) doi: 10.1117/1.3613933. [DOI] [PMC free article] [PubMed] [Google Scholar]
- 18.Bouxsein ML, Boyd SK, Christiansen BA, Guldberg RE, Jepsen KJ, Muller R. Guidelines for assessment of bone microstructure in rodents using micro-computed tomography. Journal of bone and mineral research : the official journal of the American Society for Bone and Mineral Research. 2010;25(7):1468–86. doi: 10.1002/jbmr.141. [DOI] [PubMed] [Google Scholar]
- 19.Reynolds DG, Hock C, Shaikh S, Jacobson J, Zhang X, Rubery PT, et al. Micro-computed tomography prediction of biomechanical strength in murine structural bone grafts. J Biomech. 2007;40(14):3178–86. doi: 10.1016/j.jbiomech.2007.04.004. [DOI] [PubMed] [Google Scholar]
- 20.Cowin SC, editor. Bone Mechanics Handbook. 2. Boca Raton, FL: CRC Press; 2001. [Google Scholar]
- 21.Parfitt AM, Drezner MK, Glorieux FH, Kanis JA, Malluche H, Meunier PJ, et al. Bone histomorphometry: standardization of nomenclature, symbols, and units. Report of the ASBMR Histomorphometry Nomenclature Committee. Journal of bone and mineral research : the official journal of the American Society for Bone and Mineral Research. 1987;2(6):595–610. doi: 10.1002/jbmr.5650020617. [DOI] [PubMed] [Google Scholar]
- 22.Akkus O, Adar F, Schaffler MB. Age-related changes in physicochemical properties of mineral crystals are related to impaired mechanical function of cortical bone. Bone. 2004;34(3):443–53. doi: 10.1016/j.bone.2003.11.003. [DOI] [PubMed] [Google Scholar]
- 23.van Staa TP, Geusens P, Bijlsma JW, Leufkens HG, Cooper C. Clinical assessment of the long-term risk of fracture in patients with rheumatoid arthritis. Arthritis and Rheumatism. 2006;54(10):3104–12. doi: 10.1002/art.22117. [DOI] [PubMed] [Google Scholar]
- 24.Brodt MD, Ellis CB, Silva MJ. Growing C57Bl/6 mice increase whole bone mechanical properties by increasing geometric and material properties. Journal of bone and mineral research : the official journal of the American Society for Bone and Mineral Research. 1999;14(12):2159–66. doi: 10.1359/jbmr.1999.14.12.2159. [DOI] [PubMed] [Google Scholar]
- 25.Silva MJ, Brodt MD, Wopenka B, Thomopoulos S, Williams D, Wassen MH, et al. Decreased collagen organization and content are associated with reduced strength of demineralized and intact bone in the SAMP6 mouse. Journal of bone and mineral research : the official journal of the American Society for Bone and Mineral Research. 2006;21(1):78–88. doi: 10.1359/JBMR.050909. [DOI] [PubMed] [Google Scholar]
- 26.Battaglia TC, Tsou AC, Taylor EA, Mikic B. Ash content modulation of torsionally derived effective material properties in cortical mouse bone. J Biomech Eng. 2003;125(5):615–9. doi: 10.1115/1.1611513. [DOI] [PubMed] [Google Scholar]
- 27.Burstein AH, Zika JM, Heiple KG, Klein L. Contribution of collagen and mineral to the elastic-plastic properties of bone. J Bone Joint Surg Am. 1975;57(7):956–61. [PubMed] [Google Scholar]
- 28.Currey JD. The effect of porosity and mineral content on the Young’s modulus of elasticity of compact bone. J Biomech. 1988;21(2):131–9. doi: 10.1016/0021-9290(88)90006-1. [DOI] [PubMed] [Google Scholar]
- 29.Boskey AL, Wright TM, Blank RD. Collagen and bone strength. Journal of bone and mineral research : the official journal of the American Society for Bone and Mineral Research. 1999;14(3):330–5. doi: 10.1359/jbmr.1999.14.3.330. [DOI] [PubMed] [Google Scholar]
- 30.Burr DB. The contribution of the organic matrix to bone’s material properties. Bone. 2002;31(1):8–11. doi: 10.1016/s8756-3282(02)00815-3. [DOI] [PubMed] [Google Scholar]
- 31.Reilly DT, Burstein AH. Review article. The mechanical properties of cortical bone. J Bone Joint Surg Am. 1974;56(5):1001–22. [PubMed] [Google Scholar]
- 32.Turner CH. Yield behavior of bovine cancellous bone. J Biomech Eng. 1989;111(3):256–60. doi: 10.1115/1.3168375. [DOI] [PubMed] [Google Scholar]
- 33.Bi X, Patil CA, Lynch CC, Pharr GM, Mahadevan-Jansen A, Nyman JS. Raman and mechanical properties correlate at whole bone- and tissue-levels in a genetic mouse model. J Biomech. 2011;44(2):297–303. doi: 10.1016/j.jbiomech.2010.10.009. [DOI] [PMC free article] [PubMed] [Google Scholar]
- 34.Paschalis EP, Verdelis K, Doty SB, Boskey AL, Mendelsohn R, Yamauchi M. Spectroscopic characterization of collagen cross-links in bone. Journal of bone and mineral research : the official journal of the American Society for Bone and Mineral Research. 2001;16(10):1821–8. doi: 10.1359/jbmr.2001.16.10.1821. [DOI] [PubMed] [Google Scholar]
- 35.Paschalis EP, Recker R, DiCarlo E, Doty SB, Atti E, Boskey AL. Distribution of collagen cross-links in normal human trabecular bone. Journal of bone and mineral research : the official journal of the American Society for Bone and Mineral Research. 2003;18(11):1942–6. doi: 10.1359/jbmr.2003.18.11.1942. [DOI] [PubMed] [Google Scholar]
- 36.Valcourt U, Merle B, Gineyts E, Viguet-Carrin S, Delmas PD, Garnero P. Non-enzymatic glycation of bone collagen modifies osteoclastic activity and differentiation. The Journal of biological chemistry. 2007;282(8):5691–703. doi: 10.1074/jbc.M610536200. [DOI] [PubMed] [Google Scholar]
- 37.Viguet-Carrin S, Roux JP, Arlot ME, Merabet Z, Leeming DJ, Byrjalsen I, et al. Contribution of the advanced glycation end product pentosidine and of maturation of type I collagen to compressive biomechanical properties of human lumbar vertebrae. Bone. 2006;39(5):1073–9. doi: 10.1016/j.bone.2006.05.013. [DOI] [PubMed] [Google Scholar]
- 38.Viguet-Carrin S, Garnero P, Delmas PD. The role of collagen in bone strength. Osteoporosis international : a journal established as result of cooperation between the European Foundation for Osteoporosis and the National Osteoporosis Foundation of the USA. 2006;17(3):319–36. doi: 10.1007/s00198-005-2035-9. [DOI] [PubMed] [Google Scholar]
- 39.Paschalis EP, Shane E, Lyritis G, Skarantavos G, Mendelsohn R, Boskey AL. Bone fragility and collagen cross-links. Journal of bone and mineral research : the official journal of the American Society for Bone and Mineral Research. 2004;19(12):2000–4. doi: 10.1359/JBMR.040820. [DOI] [PMC free article] [PubMed] [Google Scholar]
- 40.den Uyl D, Bultink IE, Lems WF. Advances in glucocorticoid-induced osteoporosis. Curr Rheumatol Rep. 2011;13(3):233–40. doi: 10.1007/s11926-011-0173-y. [DOI] [PMC free article] [PubMed] [Google Scholar]
- 41.Yao W, Cheng Z, Busse C, Pham A, Nakamura MC, Lane NE. Glucocorticoid excess in mice results in early activation of osteoclastogenesis and adipogenesis and prolonged suppression of osteogenesis: a longitudinal study of gene expression in bone tissue from glucocorticoid-treated mice. Arthritis Rheum. 2008;58(6):1674–86. doi: 10.1002/art.23454. [DOI] [PMC free article] [PubMed] [Google Scholar]
- 42.Ohnaka K, Tanabe M, Kawate H, Nawata H, Takayanagi R. Glucocorticoid suppresses the canonical Wnt signal in cultured human osteoblasts. Biochem Biophys Res Commun. 2005;329(1):177–81. doi: 10.1016/j.bbrc.2005.01.117. [DOI] [PubMed] [Google Scholar]
- 43.Ohnaka K, Taniguchi H, Kawate H, Nawata H, Takayanagi R. Glucocorticoid enhances the expression of dickkopf-1 in human osteoblasts: novel mechanism of glucocorticoid-induced osteoporosis. Biochem Biophys Res Commun. 2004;318(1):259–64. doi: 10.1016/j.bbrc.2004.04.025. [DOI] [PubMed] [Google Scholar]
- 44.Weinstein RS, Jilka RL, Parfitt AM, Manolagas SC. Inhibition of osteoblastogenesis and promotion of apoptosis of osteoblasts and osteocytes by glucocorticoids. Potential mechanisms of their deleterious effects on bone. J Clin Invest. 1998;102(2):274–82. doi: 10.1172/JCI2799. [DOI] [PMC free article] [PubMed] [Google Scholar]
- 45.Weinstein RS, Wan C, Liu Q, Wang Y, Almeida M, O’Brien CA, et al. Endogenous glucocorticoids decrease skeletal angiogenesis, vascularity, hydration, and strength in aged mice. Aging Cell. 2010;9(2):147–61. doi: 10.1111/j.1474-9726.2009.00545.x. [DOI] [PMC free article] [PubMed] [Google Scholar]
- 46.Plotkin LI, Manolagas SC, Bellido T. Glucocorticoids induce osteocyte apoptosis by blocking focal adhesion kinase-mediated survival. Evidence for inside-out signaling leading to anoikis. The Journal of biological chemistry. 2007;282(33):24120–30. doi: 10.1074/jbc.M611435200. [DOI] [PubMed] [Google Scholar]
- 47.Bonewald LF. Osteocyte biology: its implications for osteoporosis. Journal of musculoskeletal & neuronal interactions. 2004;4(1):101–4. [PubMed] [Google Scholar]
- 48.Yao Z, Li P, Zhang Q, Schwarz EM, Keng P, Arbini A, et al. Tumor necrosis factor-alpha increases circulating osteoclast precursor numbers by promoting their proliferation and differentiation in the bone marrow through up-regulation of c-Fms expression. The Journal of biological chemistry. 2006;281(17):11846–55. doi: 10.1074/jbc.M512624200. [DOI] [PubMed] [Google Scholar]
- 49.Weinstein RS. Glucocorticoid-induced osteoporosis. Reviews in endocrine & metabolic disorders. 2001;2(1):65–73. doi: 10.1023/a:1010007108155. [DOI] [PubMed] [Google Scholar]
- 50.Hofbauer LC, Khosla S, Dunstan CR, Lacey DL, Boyle WJ, Riggs BL. The roles of osteoprotegerin and osteoprotegerin ligand in the paracrine regulation of bone resorption. Journal of bone and mineral research : the official journal of the American Society for Bone and Mineral Research. 2000;15(1):2–12. doi: 10.1359/jbmr.2000.15.1.2. [DOI] [PubMed] [Google Scholar]
- 51.Storey JD. A direct approach to false discovery rates. J Roy Stat Soc B. 2002;64:479–98. [Google Scholar]