Abstract
Due to the numerous challenges in hit identification from random RNAi screening, we have examined current practices with a discovery of a variety of methodologies employed and published in many reports; majority of them, unfortunately, do not address the minimum associated criteria for hit nomination, as this could potentially have been the cause or may well be the explanation as to the lack of confirmation and follow up studies, currently facing the RNAi field. Overall, we find that these criteria or parameters are not well defined, in most cases arbitrary in nature, and hence rendering it extremely difficult to judge the quality of and confidence in nominated hits across published studies. For this purpose, we have developed a simple method to score actives independent of assay readout; and provide, for the first time, a homogenous platform enabling cross-comparison of active gene lists resulting from different RNAi screening technologies. Here, we report on our recently developed method dedicated to RNAi data output analysis referred to as the BDA method applicable to both arrayed and pooled RNAi technologies; wherein the concerns pertaining to inconsistent hit nomination and off-target silencing in conjugation with minimal activity criteria to identify a high value target are addressed. In this report, a combined hit rate per gene, called “H score”, is introduced and defined. The H score provides a very useful tool for stringent active gene nomination, gene list comparison across multiple studies, prioritization of hits, and evaluation of the quality of the nominated gene hits.
Keywords: BDA method, H score, HTS, HCS, RNAi, screening, randomness, Off-target effect, seed sequence, heptamer, miRNA, 3′UTR, siRNA, shRNA, esiRNA
INTRODUCTION
RNAi screening technology is viewed by many as a promising exploratory tool and researchers worldwide have embarked on it to reap the benefits from its ability to allow for single gene knockdown. RNAi, often referred to as the scientist’s Holy Grail, has since been adapted to conduct up to genome-wide screens to study the entire genome repertoire and to advance our current understanding of gene function and its role in various disease states [1]. Despite the assuring progress in the discovery of a wide array of gene candidates, none of them have come to fruition especially as novel molecular targets for therapeutic intervention; and in most cases, failed further validation. More recently, the RNAi field has been faced with the challenge of poor reproducibility and lack of confirmatory studies [2-4].
In 2008, three HIV host-virus interaction siRNA screens were published by Konig [5] and co-workers, Brass and co-workers [6], and Zhou and co-workers [7]; and in the following year an additional shRNA screen was also reported by Yeung and co-workers [8]. Intuitively, one would have expected to observe a significant overlap among the genes causing the strongest phenotypes across the four screens irrespective of the type of RNAi technology used. Surprisingly, none of the genes overlapped across all four screens; while only three genes overlapped across the three siRNA screens namely, RELA, MED6 and MED7 [2,3]. This obviously has caused a big dent in the field and questioned the sophistication of the sequence predicting algorithms used by the various vendors in the first place followed by a strong call for standardization of the RNAi field. Additionally, a follow up study summarizing the screening meta data from three reports (Konig, Brass, and Zhou) concluded that overall the three screens, though not having identified the identical genes; they nevertheless identified their molecular pathways as an explanation for the lack of overlap [2]. Unfortunately, a few more examples have posed similar concerns of poor cross study overlap, and are now begging the question as to the true merits of hits identified through RNAi screening [4, 9-10]. From a screening analysis perspective, the observed screening output discordances could well be explained by the following three statements: 1) Inconsistent methods of phenotypic scoring, 2) Minimal criteria of overall gene activity, and 3) Disregard for prevalent off-target effects (OTEs) in nominated hits. Each statement has its own merit in identifying artifactual hits from random RNAi screening.
During the conception days of RNAi screening, investigators applied the common hit selection practices applied for many years to chemical screening for hit identification. However, by doing so, a major aspect of the 1:1 relationship of compound to observed activity versus 1: many RNAi targeting sequences per gene relationship was totally ignored. Various groups still use multiple methods for hit selection in RNAi screening such as percentage inhibition of activity, z-score, B-score, statistical test, and various other ranking methods [11]. In 2007, strictly standardized mean difference (SSMD) method was developed specifically for RNAi screening data analysis as an siRNA duplex ranking method based on the duplex’s effect size relative to the negative control and was proposed to yield hits with reduced false positive and false negative rates when compared to the traditional methods like z-score and percentage inhibition [12]. Although this method enabled active duplex identification, yet it did not address the minimal active gene identification criteria for RNAi experiments. Later in the same year, the redundant siRNA activity (RSA) method was introduced, and it partly addressed the issue of the combinatorial nature of RNAi screens for the first time as it assigned a p-value to a gene based on the performance of all its corresponding duplexes [13]. However, the RSA method ranks a gene based on the collective activity of all its corresponding duplexes and thus it is likely that the performance of ill-behaved duplexes might consequentially skew the analysis results. Therefore, although the minimal criterion for determining gene activity is crucial due to the inherent combinatorial nature of RNAi screening, yet it has always remained a widely ignored parameter in the published data analysis workflows.
Off-target silencing has become a major handicap in RNAi screening and efforts have been directed towards designing oligonucleotides with maximal target specificity [14]. Recent studies have widened our understanding regarding the off-target silencing, attributing this behavior to a microRNA (miRNA) like mimic activity of the exogenous oligonucleotides [15-16]. Meanwhile, the role of seed sequences in determining the target specificity has also been described. Based on these observations, various computational approaches have been developed to identify off-target in the screening results. These approaches rely on one or the other factors that putatively lead to off-target effects (OTEs), such as seed over-representation in hits, miRNA enrichments, or 3′UTR enrichments [17-19]. Despite the development of these computational tools for OTE identification in RNAi screening data, none of the reported strategies have been currently incorporated into a standardized hit nomination workflow. One of the major requirements of the field is to incorporate all these three factors, and to include them as an integral step in a comprehensive hit nomination workflow, dedicated solely to identify the high confidence targets from random RNAi screening campaigns.
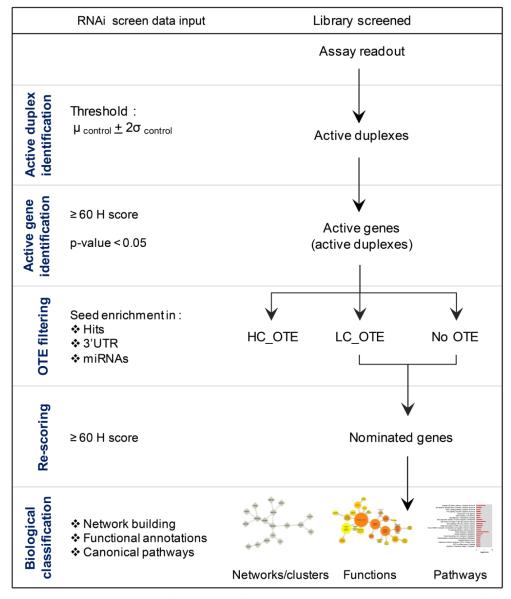
In this report, we introduce a simple method, referred to as the BDA method (Fig 1), as a standardized workflow pipeline in general encompassing most of the issues described above; we also introduce the H score and the OTE filtering specifically enhancing confidence in hit nomination from random RNAi screening. We perform a control-based analysis to best address the systems heterogeneity while also incorporating OTE filtering to address the prevalence of OTEs, and have streamlined a workflow to standardize the hit selection methodologies. We also introduce the concept of hit rate per genes referred to as an H score to address the combinatorial nature of the RNAi screening as an attempt to avoid the pitfalls of calling an outlier a high value gene target. We have applied our newly developed methodology to data obtained from two published shRNA screens as case studies, with one report using an arrayed shRNA approach against 19 cell lines [20] and the second using a pooled shRNA approach against 102 cell lines [21]. We report on our findings as to nominated hits using the BDA method versus those published gene lists.
Figure 1.
Schematic workflow of the developed BDA method
The five steps of the BDA method are depicted. HC_OTE: High confidence Off-Target Effects, LC_OTE: Low confidence Off-Target Effects; No OTE: no Off-Target Effects.
MATERIALS AND METHODS
Sequence Databases
Human genome-wide 3′UTR sequences were obtained from the University of California at Santa Cruz (UCSC) genome browser assembly GRCh37/hg19 (genome.ucsc.edu, [22]). The nucleotide (nt) sequences less than 10 nt in length were excluded from the analysis. The human microRNA (miRNA) sequences were obtained from miRbase release 18 (mirbase.org, [23]) and the information relating to their experimentally validated targets was obtained from Tarbase 6.0 [24]. The 330,687 oligonucleotide sequences for the TRC library were downloaded from the Broad Institute portal (www.broadinstitute.org/IGP/home).
Seed Sequence Heptamer Selection
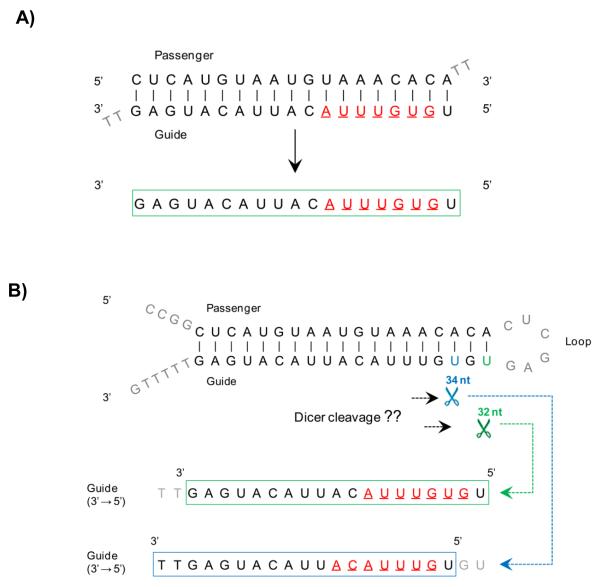
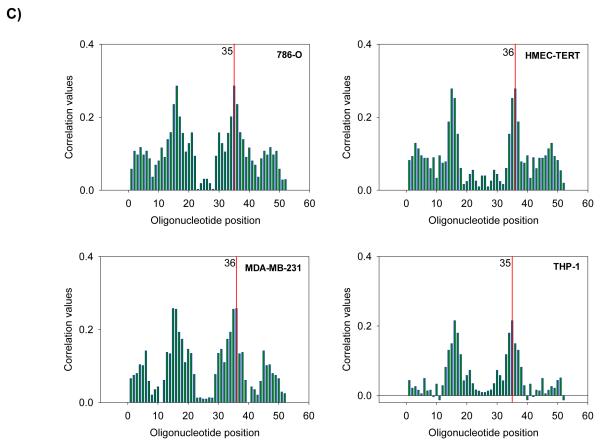
The 7-mer seed sequence, referred to as the seed heptamer, was selected from the antisense (guide) strand (Fig 2A). Guide strand is selected over passenger strand due to its predominant role in OTEs [14, 17, 25]. The choice of a heptamer seed over 6-mer or 8-mer seed was based on previous findings regarding higher specificity of a heptamer [25-26]. For siRNA duplexes, the seed heptamer was defined as the 7 nt long sequence with its start position determined at the second nt from the 5′ end of the guide strand. For shRNA hairpins, the seed heptamer was defined as the 7 nt long sequence with its start position determined by two methods: 1) theoretically, based on the ideal seed start position on the oligonucleotide, and 2) empirically, based on the duplex performance in the screen using a method developed by Dr. Eugen Buehler (NIH, MD), referred hereafter as empirical seed-selection (ESS) (Fig 2B). This enables us to generate two lists of the seed heptamers to perform OTE filtering analysis on them separately and merge the results into one list of High Confidence OTEs (HC_OTEs).
Figure 2.
Seed heptamer sequence attributes and location on resulting RNAi duplexes
A) Seed heptamer determination in siRNA duplexes. B) Seed heptamer determination in shRNA hairpins based on differential dicer cleavage scenarios considered in the BDA method. Seed heptamers are depicted in red. C) Correlation assessment of seed heptamer starting nucleotide performed using ESS method in four representative screened cell lines from the Barbie screen. Red line indicates nucleotide position with highest correlation value in guide strand.
The BDA Method
The BDA method is comprised of five steps (Fig 1) defined below, and takes into account activities of “duplexes” referring to either siRNA duplexes, shRNA hairpins, or esiRNA duplexes:
1) Active duplex identification
The active duplexes were scored based on a threshold determined at the mean (μ) ± 2 standard deviations (2σ) of the controls. The outliers in the control data maybe identified and removed using the interquartile range before determining thresholds. The selection of controls and determination of threshold is screen dependent. The RNAi screening raw data does not necessarily follow a classic Gaussian distribution; and is more often bimodal in nature [27]. Therefore, we incorporated the control-based analysis allowing for hit selection in the two distributions observed independent of the duplex performance distribution.
By setting a control-based threshold for active duplex identification, we would miss those with activities just below the cuts. Thus, after actives identification, we find it important to examine breakpoints in output values of all the duplexes to assess where strong activity breakpoints are located. This analysis is done in order to determine clear breaks in the readout values and to score such duplexes as active if no clear performance differential is observed. We present two examples of 10 genes each, one for a gain of function assay measuring EGFP fluorescence enhancement against an siRNA library with a control based threshold set at > 259; and the second example is a lethal shRNA hairpin assay measuring residual nuclei count with a control based threshold set at 2,440. The analysis identifies and re-scores as active those duplexes which have values around the set threshold (Suppl Fig 1).
2) Active gene identification
Active genes were identified from the active duplexes obtained from step 1 and based on two criteria described as follows:
a) H score to identify active genes
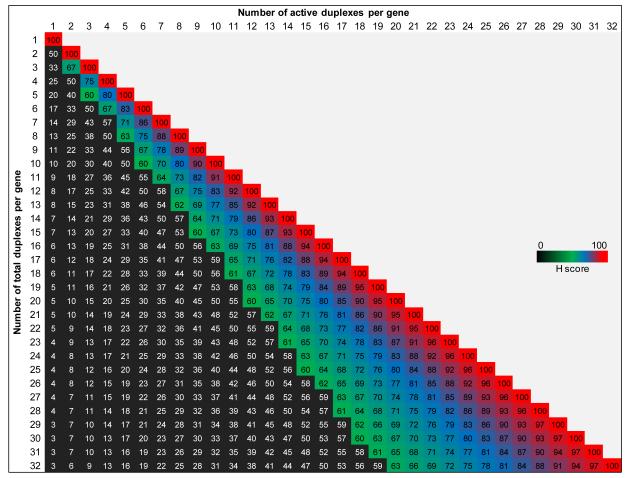
The active genes were nominated from the active duplex list using a hit rate per gene score (H score) with a threshold set at ≥ 60. An H score of 60 translates into 2 active siRNA/esiRNA duplexes or 3 active shRNA hairpins in a typical RNAi library comprising of at least 3 siRNA/esiRNA duplexes or 5 shRNA hairpins targeting each gene, respectively; yielding a hit rate of > 60% under each scenario (Fig 3). The H score is defined as follows:
Figure 3.
Inherent flexibility and diversity of H score
The proportional variance in H score based on the changing numbers of total duplexes coverage per gene in an overall representation of analyzed RNAi libraries.
Considering the inherent gene coverage heterogeneity of most RNAi libraries (Table 1), where we do find a percentage coverage of > 3 duplexes for si/esi- and > 5 duplexes for shRNA hairpins and ranging from 0.11 to up to 21%, we have made provisions to the H score analysis whereby a t-test is performed to determine if the performance of the active duplexes was significantly different from the performance of the inactive ones as described below. Genes with coverage of < 2 duplexes in any given RNAi library were completely excluded from the analysis to maintain high level of stringency.
Table 1.
Duplex coverage, frequency and library attributes of four analyzed RNAi libraries
| Provider | Library | Technology | Coverage | Duplex Coverage | Duplex Frequency (%) | Validated duplexes (%) |
|---|---|---|---|---|---|---|
| Ambion | Silencer Select | siRNA duplex | Genome-wide (21,565 genes) |
1 duplex 2 duplexes 3 duplexes > 3 duplexes |
0.02 0.03 99.83 0.12 |
4 |
| MSKCC | MSK | siRNA duplex | Druggable Genome (6,016 genes) |
1 duplex 2 duplexes 3 duplexes > 3 duplexes |
6.05 8.99 64.33 20.63 |
Unknown |
| Sigma-Aldrich | Druggable Genome | siRNA duplex | Druggable Genome (6,623 genes) |
1 duplex 2 duplexes 3 duplexes > 3 duplexes |
0.39 0.95 97.57 1.09 |
Unknown |
| Sigma-Aldrich | TRC 1.0 | shRNA hairpin | Genome-wide (16,039 genes) |
1 hairpin 2 hairpins 3 hairpins 4 hairpins 5 hairpins > 5 hairpins |
0.16 0.41 1.63 9.95 84.19 3.66 |
28 |
b) Statistical test to assess duplex performance
On average, an RNAi library either contains 3 siRNA or 5 shRNA hairpins per gene; these numbers do vary. It is important, however, to account for differential performance amongst duplexes for such genes especially in scenarios where high H scores of ≥ 80 would otherwise be expected; 4 active shRNA hairpins or 3 active duplexes based on the average library statistics. This also helps to assess the possibility of inactive duplexes for genes targeted by high numbers of duplexes in the library as being inactive. The duplexes targeting such genes were divided into two categories, those active in the screen and those inactive in the screen; and a statistical t-test was applied to assess the difference in the performance between the two categories. The null hypothesis (H0) was defined as no difference in the mean of performance between the two categories and the H0 was rejected at a p-value threshold set at < 0.05 [28]. The t-test was performed using the Statistics::TTest module in PERL.
3) OTE Filtering
The overall active duplexes corresponding to the active genes nominated in step 2 were assessed for OTEs. The OTE activity was defined for the seed heptamer corresponding to individual duplexes. The seed heptamer was subjected to three analyses for OTE filtering, defined as follows:
a) Seed heptamer enrichment in hits
The seed heptamer enrichment was determined based on the hypergeometric distribution [29] to find the probability of obtaining the number of matches for seed heptamer in the active duplexes at least as extreme as actually observed. The H0 was defined as to observe the number of seed heptamer matches in the active duplexes by chance and the threshold for rejecting H0 was determined at < 0.05 [28], therefore indicating an over-representation of a seed heptamer in the list of active duplexes versus the inactive duplexes. If, l is a seed heptamer; N is the total number of seed heptamers in the library; n is the total number of seed heptamers in the active duplexes; k is the number of l in the library; x is the number of l in the active duplexes, then, the p-value for l is calculated as follows:
b) Seed heptamer enrichment in 3′UTR sequences
The seed heptamer enrichment was found in the 3′UTR sequences and the percent (%) 3′UTR enrichment is calculated as follows:
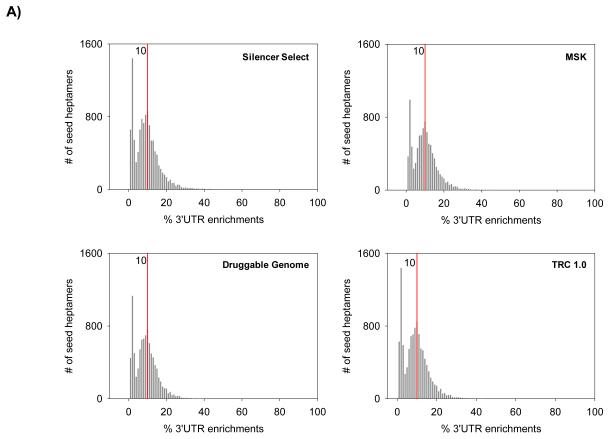
The multiple seed heptamer matches within a single 3′UTR sequence were considered. We calculated the percent % 3′UTR enrichment of the unique seed heptamers obtained from the four RNAi libraries. The distribution plot for the % 3′UTR enrichments from the RNAi libraries revealed two peaks, one peak at approx. 2%, indicative of the seed heptamers with minimal enrichments, and the second peak at 10%, representative of highest enrichment among the seed heptamers with higher number of matches in the 3′UTR sequences (Fig 4A). Based on these findings from the four different library enrichments, the threshold for scoring high enrichments in 3′UTR sequences was set at greater than 10%.
Figure 4.
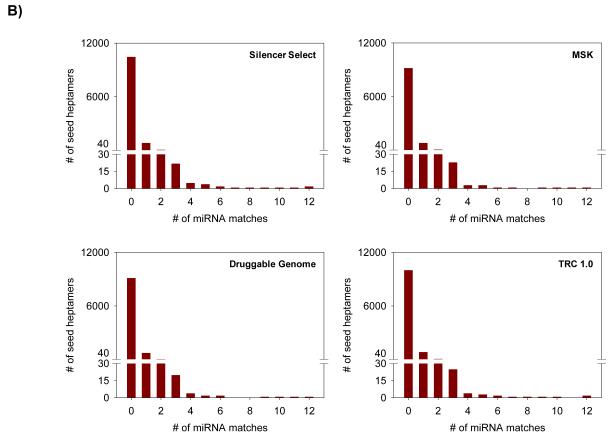
Frequency distribution and enrichment of the seed heptamer sequences in four analyzed RNAi libraries
A) 3′UTR enrichment in the four RNAi libraries expressed as percentage of total. Red line indicates the highest enrichment at 10%. B) miRNA exact seed sequence matches and frequency distribution in the four RNAi libraries.
c) Seed heptamer enrichment in miRNA sequences
The seed heptamers with exact seed heptamer match with the miRNA sequences are likely to mimic the corresponding endogenous miRNAs and therefore, a potential avenue for off-target silencing. Thus, the seed heptamer matches had to be evaluated to rule out the miRNA mimics as a plausible cause of OTEs. Analysis of the TRC shRNA hairpin library revealed on an average one exact seed heptamer matches with seed heptamers from the library (Fig 4B). Therefore, the human genome miRNA sequences were scrutinized for an exact seed heptamer match and the threshold was set at observing a minimal of one exact seed heptamer match. The experimentally validated targets for the identified miRNAs were retrieved from Tarbase 6.0 [25] and used to identify putative off-target transcripts.
The active duplexes that qualified in all three criteria described above represented strong off-target candidates and were therefore deemed HC_OTEs. The HC_OTEs were eliminated from further consideration and analysis. The duplexes that qualified in at least two criteria were flagged as low-confidence OTEs (LC_OTE) but retained for subsequent analysis. It is important to tag LC_OTEs in the list, as this information would act as filter in selecting candidates for confirmatory studies. Duplexes qualifying in utmost one criterion were ignored based on our selection threshold and deemed no OTE duplexes.
4) Re-scoring & final hit nomination
The active gene list was then re-scored by recalculating the H score for the remaining active duplexes deemed not affected by OTEs. After re-scoring, the genes candidates that failed to meet the criterion of an H score > 60 were filtered out as false positives due to OTEs (Fig 3). The step of re-scoring after OTE filtering is critical to re-assess the H score association with the active genes and to remove the ones which, after OTE filtering, fail to the score. For the genes targeted by greater than the average duplexes in the RNAi library, p-values for the differential performance between active versus inactive duplexes were considered. The remaining genes constituted the final list of nominated gene hits wherein the duplexes with strong potential OTEs had been eliminated. Statistical analysis for hit identification was performed using PERL scripts and Sigmaplot (SYSTAT, CA).
5) Biological Classification
Biological classifications were performed using the available bioinformatics resources and were used to identify enrichments in the following three categories: 1) Gene networks or clusters, 2) Functional classes, and 3) Canonical pathway associations. Cytoscape’s MiMI plug-in was first used to create a master network from the list of nominated genes. The protein-protein interaction (PPI) databases used to construct the networks available within MiMi were BIND, CCSB, DIP, HPRD, KEGG, MDC, MINT and REACTOME [30]. Cytoscape’s MCODE plug-in was used to find over-connected gene clusters within the master network [31]. BiNGo was used to visualize enriched GO categories in Cytoscape [32]. The nominated hits were annotated with the corresponding GO identifiers and the functional classes were assigned to the nominated hits based on enrichments determined using DAVID Functional Annotation Tool (www.david.abcc.ncifcrf.gov/) [33] and PANTHER classification system [34]. Canonical pathway analysis was done using Gene Go’s Metacore software (www.genego.com/metacore.php). Threshold for statistical level of significance was determined at a p-value of < 0.05.
RESULTS
Fundamental consideration in random RNAi screening hit nomination
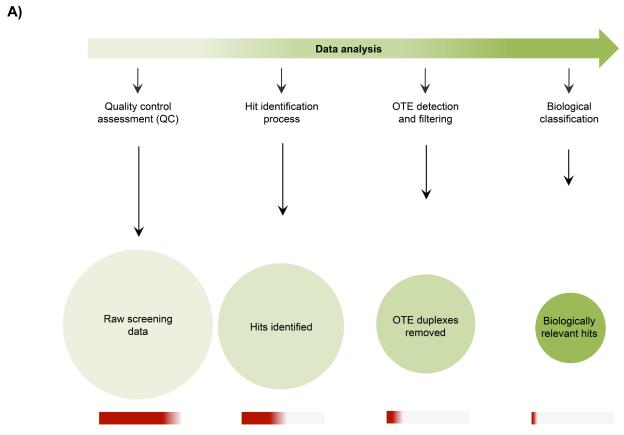
Data analysis to identify meaningful information from RNAi screens has four major considerations: 1) quality control assessment (QC), 2) hit identification process, 3) OTE detection and filtering, and 4) biological classification. A systematic implementation of these considerations in a data processing pipeline filters the raw data to yield a final set of biologically relevant gene candidates (Fig 5A). The QC step incorporates the assessment of the overall screen performance including controls and library duplexes; and can be determined using various QC metrics for example, signal to background (S:B) ratio, coefficient of variation (CV) and Z’ factor; though low Z’ values have been observed in RNAi screening data output [11, 35, 36]. In addition, we have also observed that RNAi screening data does not necessarily follow a classic bell-shaped Gaussian distribution; in that the data distribution is very heterogeneous and with high standard deviations [Djaballah et al, unpublished observations]. Bimodal distributions have also been observed in some siRNA duplex screen outputs [27].
Figure 5.
Hit nomination strategies in RNAi screening data
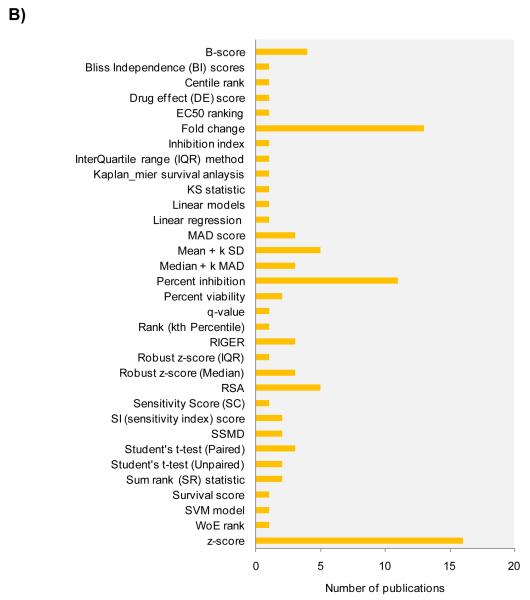
A) Typical four step considerations towards enrichment in high confidence value of biologically relevant hits from random RNAi screening. B) Representative and predominant RNAi screening data analysis methods for hit selection reported in approx 300 RNAi screening publications.
These two observations indicate that the heterogeneity and inherent noise of an RNAi screen data are typical culprits and therefore, brings into question the value of RNAi data pre-processing via normalization, which are based on either control data or library data [11]. Most of the data normalization techniques assume a Gaussian distribution and their data scaling is sensitive to outliers. Moreover, few normalization techniques assume the library data to behave as negative controls against which the data values are adjusted, and might be misleading if there are multiple actives within a plate [11]. As an example, 19 frequency distributions plots are illustrated for B-score normalized data from an arrayed shRNA hairpin cell viability screen by Barbie and co-workers [20] (Suppl Fig 2). It was observed that the normalized B-score values appear to have low noise and to follow a near normal distribution, possibly because the B-score normalization tends to alter the plate data to behave as de facto negative controls and might excessively modify data in case no real systematic errors exist. Therefore it might be more informative and prudent to use raw screening data for the purpose of analysis.
In the second layer of hit identification, a suitable data analysis strategy can be selected based on the control well performances during the screen. Due to the combinatorial nature of the RNAi screen, it becomes critical at this stage to set a minimal selection criteria to call a gene active based on the number of active duplexes. To inspect this aspect of the current trends of data analysis, we have reviewed methodologies used in approx. 300 published RNAi screens. Importantly, we have observed inconsistent methods of hit selection across all studies and also found that majority of the studies did not use the minimal active duplex threshold for nominating a hit. We have found 33 different hit selection methodologies in 80 representative reports (Fig 5B), highlighting the urgent call for standardization of data analysis in random RNAi screens. Of prominence in the methodologies was the z-score, followed by fold change and percent inhibition for hit selection. The z-score, although convenient to implement, does not take into account the controls of the screen, which might serve as valuable reference points in the RNAi screen output. In addition, z-score also assumes the underlying data to follow normal distribution. The other two commonly used methods, percent inhibition and fold change, fail to take into account the inherent data variability. Of note, the fold change method was observed predominantly for analysis of pooled shRNA hairpin screens conducted to measure relative hairpin depletions.
In the third layer of OTE detection and filtering, duplexes corresponding to active genes must be assessed for potential sequence-dependent off-target activity; and we observed that most of the published RNAi screen results were not subjected to filtering through an OTE detection strategy. Recent studies have reported prominence of OTEs in their top scoring hits especially due to miRNA like mimic activity exhibited by the exogenous RNAi seed sequences [16, 18, 25]. Taken together, these facts indicate an urgency to incorporate a concept based OTE filtering strategy in the data analysis workflow wherein seed heptamer enrichments within the active duplexes, 3′ UTR sequences and miRNA sequences must be evaluated.
Finally, it becomes important to perform a knowledge-based enrichment through biological classification of the hits. In order to understand their relevance in a biological context, the resultant functional and canonical pathway perturbations along with the network associations need to be elucidated. However, the applicability of this step is limited to our current understanding of functional genomics, and thus a recommended strategy might be to incorporate maximal bioinformatics tools and resources available to identify significant biological interactions within the RNAi screen results.
Attributes of RNAi screening libraries
We took advantage of the in-house availability of four RNAi libraries obtained from three different sources and used them as representatives to study the attributes of library duplexes in general (Table 1). We have evaluated the duplexes thus obtained for three characteristics 1) duplex frequency per gene in the library, 2) 3′UTR enrichments of the seed heptamers corresponding to the unique duplexes in the library, and 3) miRNA enrichments of the seed heptamers corresponding to the unique duplexes in the library. A breakdown of hairpin frequencies per gene revealed on an average 3 duplexes per gene in an siRNA duplex library and 5 hairpins per gene in an shRNA hairpin library; deviations from the average duplex numbers were observed across the board (Table 1).
Next, we extracted the seed heptamers from the unique duplex sequences constituting the four libraries and evaluated them individually for 3′UTR enrichments, also taking into account multiple matches within 3′UTR sequences. Interestingly, the frequency plots of the enrichments for all the four libraries revealed a similar pattern and we observed two distinct distributions; one being representative of minimal 3′UTR sequence matches up to 4% perhaps originating from random seed heptamer matches, while the second being representative of relatively stronger 3′UTR enrichments (> 4%). In the second distribution, we have observed a peak at 10%, indicating that the highest number of seed heptamers in the library had 10% enrichment within the 3′UTR sequences (Fig 4A). This observation can be instrumental to determine thresholds for 3′UTR enrichments in OTE filtering for active duplexes identified in a random RNAi screen.
In the third part of the analysis, we searched for identical seed heptamer matches between the RNAi libraries and the human microRNA sequences. Similar to 3′UTR enrichment findings, we have observed results of miRNA enrichments to be consistent across all four libraries wherein the maximal number of duplexes did not have an identical seed heptamer match with the miRNA sequences under consideration. Importantly, highest proportion of the remaining seed heptamers had identical match with utmost one miRNA (Fig 4B). On the extreme end of the distribution spectrum, we have found four seed heptamers (AAAGTAA, AAGTGCT, TCTAGAG, and GAGGTAG) in total from the four libraries which had an identical match with > 10 miRNAs; wherein seed heptamer TCTAGAG was found in duplexes of all four libraries (Suppl Table 1). A total of 45 miRNAs were associated with these four seed heptamers and belong to 9 distinct miRNA families. We also observed that 21% miRNAs with seed heptamer GAGGTAG found to be members of the let-7 family, and were identified to have approx. 400 targets in Tarbase 6.0 (Suppl Table 1). Therefore, it is critical at this stage to be cautious of these seed heptamers in active duplexes, as they might be hot spots resulting in putative OTEs.
The BDA method: a simple and systematic workflow for hit nomination
Based on the considerations described above, we have introduced a standardized analysis workflow referred to as the BDA method for hit nomination. The method systematically addresses the current bottlenecks of RNAi data analysis in five steps: 1) Active duplex identification, 2) Active gene identification, 3) OTE filtering, 4) Re-scoring, and 5) Biological classifications (Fig 1). In the first step of active duplex identification, we determine the controls to be used in the analysis based on the biology of the assay under consideration and the threshold is defined at μ ± 2σ of the controls. The selection of the controls is conceptual for example, puromycin treated non-transduced wells can be used to determine the threshold for essential gene in a cell viability shRNA hairpin screen [Djaballah et al, unpublished observations]. μ ± k σ is a simple and common data analysis practice of hit selection in high throughput screens (HTS) and is more than often used for threshold determination in transformed data, for example data converted to z-scores or B-scores [11]. Theoretically, k = 2 gives the probability of a data value being within the range of (μ − 2σ, μ + 2σ) and is approximately equal to 0.9545 for a normally distributed data.
In the second step of active gene identification, we have introduced the H score to quantify the duplex activity per gene. H score emerges as a powerful metric due to its flexibility in incorporating the duplex activity information when compared to a static number based threshold and proportionally adjusts to accommodate the varying duplex frequency per gene (Fig 3). The threshold for the H score must be > 60 to identify only those genes that have maximal duplex activity. The total number of duplexes per gene may well be higher than the average within a given RNAi library. Therefore, it would be a logical consideration to assess the performance difference amongst the active versus inactive duplexes. To address this, we applied a statistical test for those genes that have > 4 active duplexes. A p-value score is indicative of a statistically significant difference in mean performance of the active duplexes versus their inactive counterparts. The genes targeted by less than three shRNA hairpins or less than two siRNA duplexes in the RNAi library were excluded from the analysis to maintain a stringent hit nomination process.
In the third step of OTE filtering, seed heptamers are first determined in the guide strand from nt position 2 to 7 from the 5′ end (Fig 2A). The guide strand yields prominent OTEs compared to the passenger strand, and therefore was the selected for OTE filtering [14, 17, 19, 25]. Of note, heptamers inherently harbor hexamers and are also reportedly a preferred seed length [25, 26]. Compared to siRNA duplexes, seed determination in shRNA hairpins, is more complicated owing to their intracellular processing by dicer cleavage, which might not be specific [37, 38]. Taking that into consideration, we have selected seed heptamers using two methods: 1) theoretically, based on the ideal location at nt position 33 on the oligonucleotide and 2) empirically, based on the positions calculated by the ESS method (Fig 2B). The ESS method reports on the correlation values calculated from screen data output for each nt position on the oligonucleotide; highest correlation value indicative of the start of seed heptamer. Of note, two distinct peaks can be observed when the correlation values are plotted on a histogram, and are representative of the passenger strand and the guide strand respectively (Fig 2C). More than often we have observed an offset of 2 nt in the empirically determined start position as compared to the theoretically determined start position
Next, the active duplexes corresponding to the active genes identified in step two are subjected to a three-tier analysis for seed heptamer enrichments in 1) active duplexes relative to the library, 2) 3′UTR sequences, and 3) miRNA sequences; The thresholds for 3′UTR enrichments and miRNA seed matches are determined based on the RNAi library attributes wherein we had observed the highest 3′UTR enrichments at 10% (Fig 4A) and highest miRNA identical seed heptamer matches at one (Fig 4B). OTE filtering for siRNA duplexes is performed for the seed heptamers identified in the guide strand; while that for shRNA hairpins is performed for the heptamers obtained from the two methods of seed determination independently and results are merged for a comprehensive OTE profile. Furthermore, a stringent segregation of the OTE filtering output reveals those duplexes that qualify in all 3 criteria, therefore HC_OTEs, those that qualify in at least two criteria, therefore LC_OTEs, and those that qualify in utmost one criterion, therefore No OTEs. HC_OTEs were deemed as highly likely off-targets as they represent strong enrichments across the board, and were removed from subsequent analysis while the LC_OTEs were only flagged in the list of active genes.
In the fourth step of re-scoring, we re-calculate the H score for the active genes after removing the HC_OTEs and the genes that now fail to meet the minimal H score criterion of at least 60, thus resulting in final list of nominated candidates with a much higher degree of confidence. Rescoring successfully allows maintaining a high stringency in hit nomination by preserving only those genes that, after successive steps of filtering still retain maximal active duplexes. In the fifth and final step of biological classifications, we analyze the nominated hits through a combination of available bioinformatics tools and review enrichments in three categories: 1) Gene networks/clusters, 2) Functions, and 3) Canonical pathways. This step can be viewed as a strategy for hit prioritization as the most probable hits are likely to form statistically significant networks or be involved in perturbation of specific canonical pathways and cellular functions.
BDA method to assess nominated hits in published RNAi screens
Case Study One: Arrayed shRNA hairpin Screening Data Re-Analysis
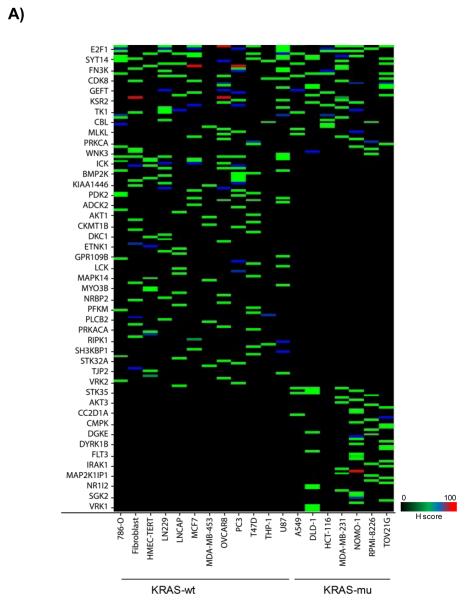
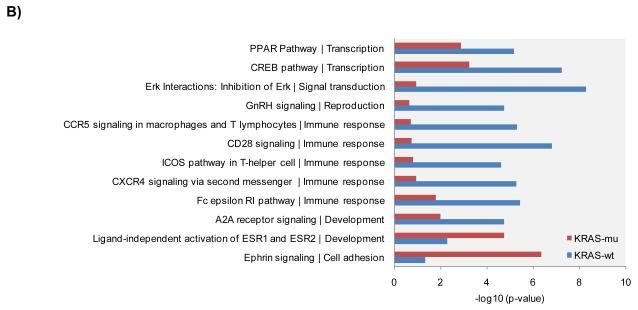
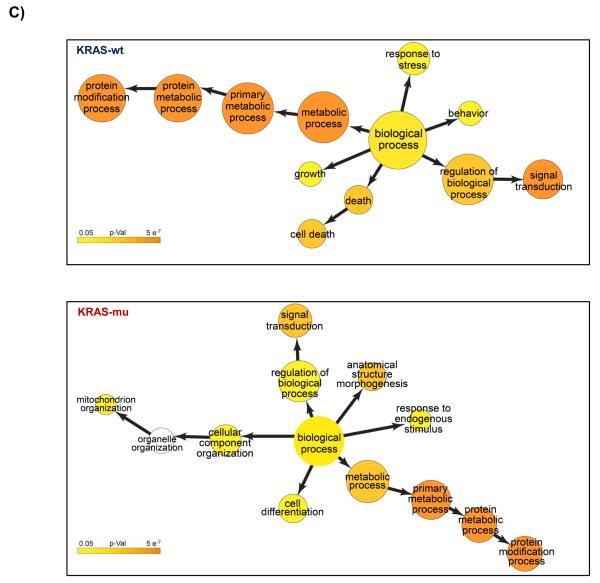
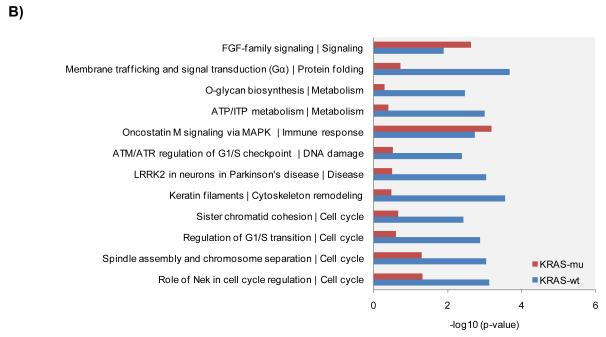
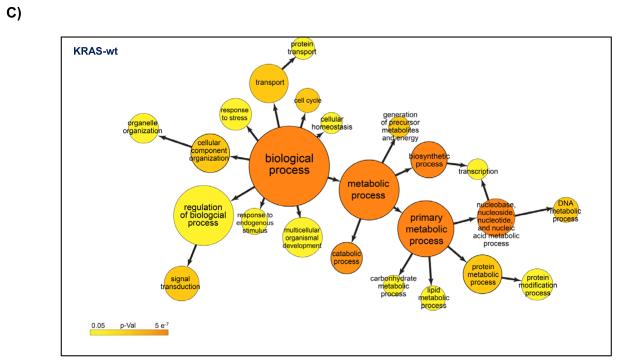
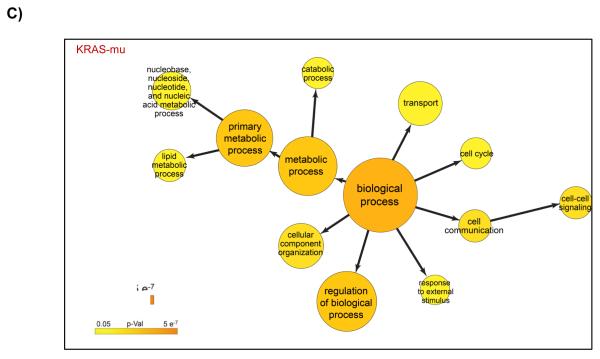
We re-analyzed the data from published arrayed shRNA hairpin screens performed by Barbie and co-workers [20]. They reported a set of 45 genes essential specific for cells harboring KRAS mutation with TBK1 emerging as a high value target. The shRNA hairpins were deemed active below a threshold determined at a B-score value of −1. We found that majority of the genes had either one or two active duplexes (Suppl Fig 3). We have calculated the H score and found that approx. 6% of the genes in the library were targeted by greater than five shRNA hairpins and therefore subjected them to a statistical test to evaluate the statistical difference in the overall performance. The active duplexes corresponding to the active genes were subjected to the OTE analysis. When using the ESS method, we have found eleven cell lines with a seed heptamer start position determined at nt position 35 and the remaining eight cell lines with a seed heptamer start position determined at nt position 36; four representative correlation histograms are shown (Fig 2C). An evaluation of the miRNAs identified in the HC_OTE list revealed the involvement of 136 distinct miRNAs (Suppl Table 2). Post OTE filtering, the H scores were recalculated. In summary, the BDA workflow yielded a set of 192 combined candidate genes across the 19 cell lines (Suppl Fig 4 & Fig 6A). Biological classification of the resulting candidates was split into 95 KRAS-wt specific and 51 KRAS-mu specific genes and revealed differentially enriched pathways and functions between the two groups (Figs 6B & 6C). We compared our results to the 45 genes reported by Barbie, and found a marginal overlap of 19 genes (Suppl Fig 5), 6 genes were KRAS-wt specific, while the remaining 4 genes were common between the two groups. Surprisingly, TBK1 did not emerge as a high value target but was rather inactive across all 19 cell lines based on the BDA method.
Figure 6.
BDA method to nominate genes in 19 cell lines from arrayed shRNA hairpin screen performed by Barbie and co-workers
A) Heat map plot of the H scores values for the nominated genes per cell line; including an overlap analysis between KRAS-wt and KRAS-mu cell lines in the study. KRAS-wt represents cell lines harboring wild type KRAS. KRAS-mu represents cell lines harboring mutated KRAS. B) Canonical pathways associated with nominated hits in both the KRAS-wt and KRAS-mu cell lines. C) Functional enrichments associated with nominated hits in both the KRAS-wt and KRAS-mu cell lines.
Case Study Two: Pooled shRNA hairpin Screening Data Re-Analysis
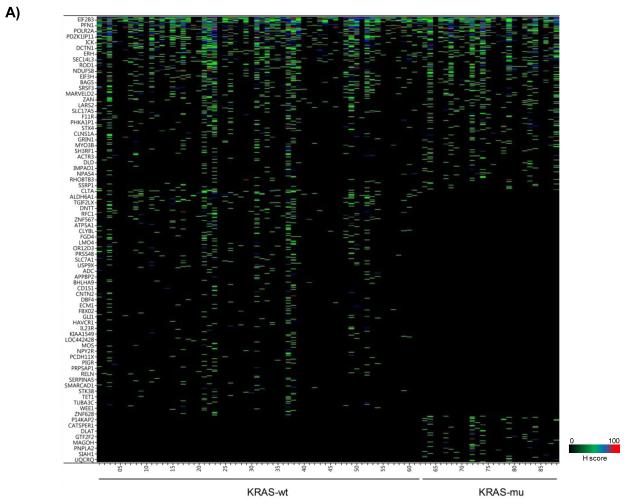
We re-analyzed the data from published genome-wide pooled shRNA hairpin screens performed by Cheung and co-workers, where they have also reported cell-lineage specific essential genes for cancer [21]. We obtained the FC values for the shRNA hairpin library for the 102 cell lines from the Broad Institute (Suppl Table 3). We used the FC values for the negative control pools, and calculated a threshold for individual cell lines based on the μ − 2σ of the FC values corresponding to the controls. We found a prominence of less than equal to two active shRNA hairpins per gene (Suppl Fig 6). We have calculated the H score for each gene based on the corresponding active duplexes. We found that approx. 2% of the genes in the library were targeted by greater than five shRNA hairpins where we applied a statistical test as described above. OTE filtering analysis was subsequently performed. Using the ESS method, we found that 101 cell lines had a seed heptamer start position determined at nt 35; whereas only one cell line (QGP-1) had seed heptamer start position determined at nt 36 (data not shown). Post OTE filtering, the H scores were recalculated. In summary, the BDA method nominated 2,083 combined candidate genes across the 102 cell lines (Suppl Table 4; Suppl Fig 7). Interestingly, we found miR-145 which was found in active duplexes for 3 genes (FOLR1, KCNK5, RET); miR-145 has previously been shown to be associated with off-target silencing [16]. None of the nominated genes were active across all with only 25 of them active in approx half of the cell lines. We categorized the hits into three groups of KRAS-wt, KRAS-mu, and KRAS-unk. An overlap analysis revealed 812 genes in common, 1,057 genes specific to KRAS-wt, and 214 genes specific to KRAS-mu (Fig 7A); the KRAS-wt and KRAS-mu candidates were subjected to biological classifications as described above and reveals some critical differences in classifications between the KRAS-wt and KRAS-mu cell lines (Figs 7B & 7C).
Figure 7.
BDA method to nominate genes in 102 cell lines from pooled shRNA hairpin screen performed by Cheung and co-workers
A) Heat map plot of the obtained H scores values for the nominated genes per cell line; together with an overlap analysis between KRAS-wt and KRAS-mu cell lines. KRAS-wt represents cell lines harboring wild type KRAS. KRAS-mu represents cell lines harboring mutated KRAS. B) Canonical pathways associated with nominated hits in both the KRAS-wt and KRAS-mu cell lines. C) Functional enrichments associated with nominated hits in both the KRAS-wt and KRAS-mu cell lines.
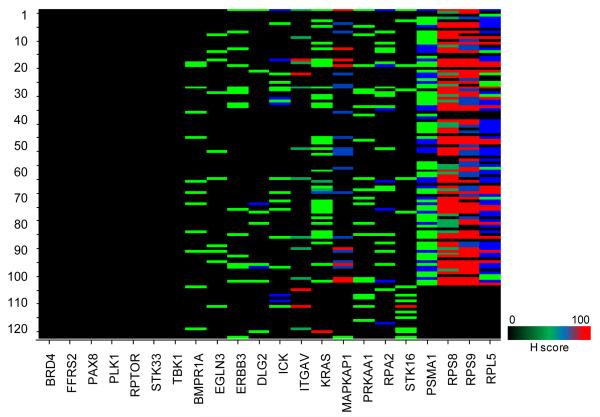
Furthermore, to compare the hits nominated in BDA method to those identified by Cheung, we obtained the published list of hits reported as lineage specific genes; which are 582 essential genes in 25 ovarian cell lines, 584 essential genes in 6 GBM cell lines, 567 essential genes in 18 colon cell lines, 578 essential genes in 7 esophageal squamous cell lines, 588 essential genes in 13 pancreatic cell lines, and 594 essential genes in 8 NSLC cell lines. Similarly, we grouped our nominated hits from the cell lines based on the tumor type and have performed an overlap analysis with the ones provided Cheung. We observed that most of the hits reported were filtered out based on H score threshold of 60 (Suppl Fig 8 & Suppl Table 5). Interestingly, we were not able to nominate PAX8, identified as a high value target in ovarian cell lines by Cheung. PLK1, routinely used control in RNAi screens [36, 39-40], emerged as inactive across all 102 cell lines. Similarly, FRS2 and RPTOR failed to qualify above the threshold set for H score (Fig 8).
Figure 8.
Cross-study comparison and evaluation of nominated hits in shRNA hairpin screens
Performance assessment of 11 representative genes in the two published shRNA screens; using the H score evaluation of actives. X-axis denotes the selected genes and Y-axis denotes the cell lines. Cell lines are numbered as defined in Suppl Table 3.
H scores for cross-study comparative analysis
we have compared the hits nominated by the BDA method in the arrayed shRNA hairpin screen performed by Barbie with the pooled shRNA hairpin screen performed by Cheung. We reviewed the performance of ten high value candidates, namely BRD4, FFRS2, PAX8, PLK1, RPTOR, STK33, TBK1, KRAS, RPA2, ICK and STK16; interestingly, none of them qualified under our stringent criteria (Fig 8). We first filtered out those genes from the analysis that did not overlap between the two screening libraries used. An overlap was then performed only between 90 genes and 54 genes nominated in Barbie and Cheung screen respectively for KRAs-wt/KRAS-wt and we found only seven genes in common for both, respectively (Suppl Fig 9). Additionally, an overlap amongst genes from the two KRAS-mu common cell lines (A549 and DLD-1) revealed only four genes in common (Suppl Fig 10).
DISCUSSION
The current trends in the field in terms of screening data interpretation is left to be desired for and in most cases not comprehensive enough; leading in part to poor data reproducibility as the emerging major concerns [2-4, 9-10]. Intuitively, one would have expected that an observed strong phenotype, associated with a given gene, be consistent across similar screens irrespective of the RNAi technology used. Unfortunately, cross study comparisons have revealed poor overlaps suggesting a likely prominence of artifacts in the screening data interpretation and subsequent results [2]; which can be potentially attributed to target knockdown specificity of given RNAi duplexes. Furthermore, there have been multiple instances where gene targeted by ≤ 2 active duplexes has been reported as high value gene targets [9, 20-21]. Therefore, the caveat of target specificity needs to be addressed at two levels during the process of hit identification: 1) Minimal number of active RNAi duplexes per gene and 2) OTE filtering. For this purpose, we have developed the BDA method as a stringent and comprehensive data analysis workflow resulting in high confidence gene candidates.
We reviewed approx 300 published RNAi screens and found an array of methods used for hit identification (Fig 5B). Through the BDA method, we aim to standardize the hit nomination process. The use of controls for defining the threshold is highly recommended for two reasons: 1) To render the analysis independent of the library data distribution, and 2) To analyze the data based on the performance of the controls. RSA, as a method, was developed to rank a gene taking into consideration the collective activity of all its duplexes [13]. In contrast, the BDA method first scores for the individual active duplexes independent of their concerted performance, followed by the H score to identify active genes based on maximal active duplexes. This feature renders the H score value independent of assay readout, RNAi technology, and data processing methodologies used. Since duplex frequencies per gene vary and most of the duplexes in the library are not necessarily validated (Table 1), there is a possibility that some of the duplexes associated with genes with high duplex frequencies might have low knockdown efficiencies and therefore inactive in the screen. To rule out this possibility, we applied statistical test to assess the activity of such genes based on the differential performance among the active duplexes versus the inactive counterparts. We believe that the test for performance difference along with H score will reduce the scoring of false negatives and false positives respectively.
OTEs are prominent in RNAi screening and besides several attempts been made to design high specificity RNAi duplexes through the use of sophisticated predicting algorithms, OTEs remain a major issue in RNAi today [14-16]. Currently, there are few strategies and tools developed for OTE filtering based on either the seed heptamer over-representation in the hit list or the 3′UTR sequence matches [17-19]. Our concept-based strategy for OTE filtering incorporates a stringent approach which takes into account three important criteria; 1) Seed heptamer over-representation amongst active duplexes, 2) 3′ UTR sequence enrichment, and 3) Seed heptamer identical match with a miRNA sequence. To determine thresholds for the last two criteria, we have studied the attributes of four RNAi libraries and the results reveal similar distribution patterns for enrichments in 3′UTR sequences and miRNA seed heptamers; with maximum library seed heptamers having 10% enrichment in 3′UTR sequences with one miRNA match. The similarity of enrichments across them could be attributed to an overlap amongst the seed heptamers from the individual libraries or simply the design algorithms used.
To achieve and maintain high stringency while eliminating putative OTEs, we demarcate the obtained list of potential OTEs into high and low-confidence; which in turn enable us to remove highly likely OTEs while also tag the less likely ones; particularly insightful when proceeding towards confirmatory studies. We believe that this approach will also restrain from over prediction of OTEs in active duplexes. Our approach also allows for examining OTE profiles based on the effects of miRNA mimics; however this effort is currently limited due to the small number of experimentally validated targets for most of the known human miRNAs.
We applied the BDA method to two shRNA screens published by the same group as they both used the same TRC libraries and in some instances same cell lines. Irrespective, one would have expected to observe a higher overlap; but on the contrary, we find a sub-marginal overlap of only seven genes. Incidentally, the high value targets TBK1 and PAX8 were not nominated as strong candidates as they had less than three active duplexes. Moreover, we did not find a function or pathway overlap amongst the nominated gene candidates from the two screens. These results, though not surprising, reflect on the inherent issues associated with pooled shRNA screens on the one hand, and on the other the dire state of the field in that it highly concur with the immediate needs to standardize RNAi screening data analysis, eliminating the unnecessary need to normalize and manipulate raw values, and to be transparent as to the process of hit nomination. The BDA method, especially the H score, is independent of any assay technology and as stringent and transparent as a method can be. Of note, as we were finishing our manuscript, a perspective was published in Science by Kaelin [41] addressing the need for prudence when one analyzes random RNAi screening data if we are to remain in love with the technology beyond the ten years honeymoon, especially that there is a growing view that RNAi has been abused at times when studying mammalian gene function.
In summary, we have developed and successfully implemented a data analysis method, referred to as the BDA method, tailored specifically for RNAi screening data, and applicable to both arrayed and pooled RNAi screening technologies. We introduce and describe the H score as a novel metric to assess overall duplex activity leading to an active gene nomination capturing the essence of the combinatorial nature of RNAi and with a high stringency consideration for active gene nomination. We incorporate an approach for OTE assessment and filtering of those active duplexes deemed artifactual due to their seed sequence similarities to miRNAs and/or 3′UTR sequences; thus causing a phenotype through an off-target silencing. We demonstrate the performance of the BDA method on two independent and published RNAi screening data sets highlighting the sheer variability in published hits, especially when both groups used the same library and in some instances the same cell lines. We hope that the BDA method would provide the initiating steps towards standardization of the RNAi screening field especially for RNAi data analysis and hit nomination; yielding a much needed transparent and unified platform for RNAi screening data output convergence, and potentially leading the technology towards a better forecast to fulfill its premise of providing us with much needed targets for drug discovery to fight and treat disease.
Supplementary Material
Suppl Figure 1. Breakpoint analysis for gene nomination
Examples highlighting breakpoint analysis towards performance assessments in both siRNA duplex and shRNA hairpin screens: A) siRNA duplexes per gene for a gain of function siRNA duplex screen. B) shRNA hairpins per gene for a lethal shRNA hairpin screen.
Suppl Figure 2. Frequency distribution plots for the 19 cell lines in the Barbie screen Near normal distribution of B-score values for 19 screened cell lines in the Barbie screen.
Suppl Figure 3. Active duplex identification in the resulting data from the 19 cell lines screens Frequency distribution plot of active shRNA hairpins per gene identified in each cell line from arrayed shRNA hairpin screen performed Barbie and co-workers; highlighting the predominance of 1-2 active hairpins per gene.
Suppl Figure 4. BDA workflow for hit nomination using the screening data from the Barbie screen
The BDA workflow based on the authors B score threshold of < −1 as the entry point for active duplex selection leading to a differential hit nomination across the 19 cell lines.
Suppl Figure 5. Overlap between genes nominated by the BDA method and those identified by Barbie and co-workers
Comparative analysis of the nominated hits using the BDA method to the reported 45 essential genes in the Barbie screen.
Suppl Figure 6. Active duplex identification in the 102 screened cell lines in the Cheung Screen
Frequency distribution plot of active shRNA hairpins per gene identified in each cell line from pooled shRNA hairpin screen performed Cheung and co-workers; highlighting the predominance of 1-2 active hairpins per gene. Cell lines are numbered as defined in Suppl Table 3.
Suppl Figure 7. Heatmap plot of the H scores values of nominated genes per cell line clustered by tumor type.
Suppl Figure 8. Lineage-specific overlaps between genes nominated by the BDA method as compared to those reported by Cheung and co-workers.
Suppl Figure 9. Overlap analysis of the BDA nominated hits in the two screens performed by Barbie and co-workers and Cheung and co-workers
Comparative analysis between KRAS-wt and KRAS-mu genes nominated by BDA; highlighting serious concerns as to the minimal overlap considering that the groups used the same TRC library and in some instances the same cell lines.
Suppl Figure 10. Overlap analysis of hits between Cheung and Barbie and against the same cell lines Minimal residual overlap of active and deemed essential genes in screens performed by Barbie and co-workers and Cheung and co-workers in two KRAS-mu cell lines (A549 and DLD-1); highlighting yet again the seriousness of lack of overlap especially for nominated high value target genes e.g. TBK1 and PAX8.
ACKNOWLEDGMENTS
The authors wish to thank members of the HTS Core Facility for their assistance during the course of this study, especially Dr Christophe Antczak and David Shum for critically reading the manuscript. Dr Eugen Buehler of the NIH for suggesting that seed sequences can be empirically determined from the data and for providing an R script to perform the analysis described in the manuscript. The HTS Core Facility is partially supported by Mr. William H. Goodwin and Mrs. Alice Goodwin and the Commonwealth Foundation for Cancer Research, the Experimental Therapeutics Center of the Memorial Sloan-Kettering Cancer Center, the William Randolph Hearst Fund in Experimental Therapeutics, the Lillian S. Wells Foundation, and by a NIH/NCI Cancer Center Support Grant 5 P30 CA008748-44.
Abbreviations
- RNAi
RNA interference
- shRNA
short hairpin RNA
- siRNA
small interfering RNA
- esiRNA
endoribonuclease-prepared siRNAs
- miRNA
microRNA
- BDA
The Bhinder-Djaballah Analysis
- H score
‘hit rate per gene’ score
- OTE
off-target effect
Footnotes
DISCLOSURE STATEMENT The authors declare no competing financial interests.
LIST OF REFERENCES
- 1.Mohr S, Bakal C, Perrimon N. Genomic screening with RNAi: Results and challenges. Annu. Rev. Biochem. 2010;79:37–64. doi: 10.1146/annurev-biochem-060408-092949. [DOI] [PMC free article] [PubMed] [Google Scholar]
- 2.Bushman FD, Malani N, Fernandes J, D’Orso I, Cagney G, Diamond TL, Zhou H, Hazuda DJ, Espeseth AS, König R, Bandyopadhyay S, Ideker T, Goff SP, Krogan NJ, Frankel AD, Young JA, Chanda SK. Host cell factors in HIV replication: meta-analysis of genome-wide studies. PLoS. Patho. 2009;5(5):e1000437. doi: 10.1371/journal.ppat.1000437. [DOI] [PMC free article] [PubMed] [Google Scholar]
- 3.Pache L, König R, Chanda SK. Identifying HIV-1 host cell factors by genome-scale RNAi screening. Methods. 2011;53(1):3–12. doi: 10.1016/j.ymeth.2010.07.009. [DOI] [PubMed] [Google Scholar]
- 4.Naik G. Scientists’ Elusive Goal: Reproducing Study Results. Wall Street Journal. 2011 [Google Scholar]
- 5.König R, Zhou Y, Elleder D, Diamond TL, Bonamy GM, Irelan JT, Chiang CY, Tu BP, DeJesus PD, Lilley CE, Seidel S, Opaluch AM, Caldwell JS, Weitzman MD, Kuhen KL, Bandyopadhyay S, Ideker T, Orth AP, Miraglia LJ, Bushman FD, Young JA, Chanda SK. Global analysis of host-pathogen interactions that regulate early-stage HIV-1 replication. Cell. 2008;135(1):49–60. doi: 10.1016/j.cell.2008.07.032. [DOI] [PMC free article] [PubMed] [Google Scholar]
- 6.Brass AL, Dykxhoorn DM, Benita Y, Yan N, Engelman A, Xavier RJ, Lieberman J, Elledge SJ. Identification of host proteins required for HIV infection through a functional genomic screen. Science. 2008;319(5865):921–926. doi: 10.1126/science.1152725. [DOI] [PubMed] [Google Scholar]
- 7.Zhou H, Xu M, Huang Q, Gates AT, Zhang XD, Castle JC, Stec E, Ferrer M, Strulovici B, Hazuda DJ, Espeseth AS. Genome-scale RNAi screen for host factors required for HIV replication. Cell Host Microbe. 2008;4(5):495–504. doi: 10.1016/j.chom.2008.10.004. [DOI] [PubMed] [Google Scholar]
- 8.Yeung ML, Houzet L, Yedavalli VS, Jeang KT. A genome-wide short hairpin RNA screening of jurkat T-cells for human proteins contributing to productive HIV-1 replication. J. Biol. Chem. 2009;284(29):19463–19473. doi: 10.1074/jbc.M109.010033. [DOI] [PMC free article] [PubMed] [Google Scholar]
- 9.Scholl C, Fröhling S, Dunn IF, Schinzel AC, Barbie DA, Kim SY, Silver SJ, Tamayo P, Wadlow RC, Ramaswamy S, Döhner K, Bullinger L, Sandy P, Boehm JS, Root DE, Jacks T, Hahn WC, Gilliland DG. Synthetic lethal interaction between oncogenic KRAS dependency and STK33 suppression in human cancer cells. Cell. 2009;137(5):821–834. doi: 10.1016/j.cell.2009.03.017. [DOI] [PubMed] [Google Scholar]
- 10.Babij C, Zhang Y, Kurzeja RJ, Munzli A, Shehabeldin A, Fernando M, Quon K, Kassner PD, Ruefli-Brasse AA, Watson VJ, Fajardo F, Jackson A, Zondlo J, Sun Y, Ellison AR, Plewa CA, San MT, Robinson J, McCarter J, Schwandner R, Judd T, Carnahan J, Dussault I. STK33 kinase activity is nonessential in KRAS-dependent cancer cells. Cancer Res. 2011;71(17):5818–5826. doi: 10.1158/0008-5472.CAN-11-0778. [DOI] [PubMed] [Google Scholar]
- 11.Birmingham A, Selfors LM, Forster T, Wrobel D, Kennedy CJ, Shanks E, Santoyo-Lopez J, Dunican DJ, Long A, Kelleher D, Smith Q, Beijersbergen RL, Ghazal P, Shamu CE. Statistical methods for analysis of high-throughput RNA interference screens. Nat. Methods. 2009;6(8):569–575. doi: 10.1038/nmeth.1351. [DOI] [PMC free article] [PubMed] [Google Scholar]
- 12.Zhang XD, Ferrer M, Espeseth AS, Marine SD, Stec EM, Crackower MA, Holder DJ, Heyse JF, Strulovici B. The use of strictly standardized mean difference for hit selection in primary RNA interference high-throughput screening experiments. J. Biomol. Screen. 2007;12(4):497–509. doi: 10.1177/1087057107300646. [DOI] [PubMed] [Google Scholar]
- 13.König R, Chiang CY, Tu BP, Yan SF, DeJesus PD, Romero A, Bergauer T, Orth A, Krueger U, Zhou Y, Chanda SK. A probability-based approach for the analysis of large-scale RNAi screens. Nat. Methods. 2007;4(10):847–849. doi: 10.1038/nmeth1089. [DOI] [PubMed] [Google Scholar]
- 14.Jackson AL, Bartz SR, Schelter J, Kobayashi SV, Burchard J, Mao M, Li B, Cavet G, Linsley PS. Expression profiling reveals off-target gene regulation by RNAi. Nat. Biotech. 2003;21(6):635–637. doi: 10.1038/nbt831. [DOI] [PubMed] [Google Scholar]
- 15.Birmingham A, Anderson EM, Reynolds A, Ilsley-Tyree D, Leake D, Fedorov Y, Baskerville S, Maksimova E, Robinson K, Karpilow J, Marshall WS, Khvorova A. 3′ UTR seed matches, but not overall identity, are associated with RNAi off-targets. Nat. Methods. 2006;3:199–204. doi: 10.1038/nmeth854. [DOI] [PubMed] [Google Scholar]
- 16.Sudbery I, Enright AJ, Fraser AG, Dunham I. Systematic analysis of off-target effects in an RNAi screen reveals microRNAs affecting sensitivity to TRAIL-induced apoptosis. BMC Genomics. 2010;11:175. doi: 10.1186/1471-2164-11-175. [DOI] [PMC free article] [PubMed] [Google Scholar]
- 17.Anderson EM, Birmingham A, Baskerville S, Reynolds A, Maksimova E, Leake D, Fedorov Y, Karpilow J, Khvorova A. Experimental Validation of the Importance of Seed Complement Frequency to siRNA Specificity. RNA. 2008;14(5):853–861. doi: 10.1261/rna.704708. [DOI] [PMC free article] [PubMed] [Google Scholar]
- 18.Sigoillot FD, Lyman S, Huckins JF, Adamson B, Chung E, Quattrochi B, King RW. A bioinformatics method identifies prominent off-targeted transcripts in RNAi screens. Nat. Methods. 2012;9(4):363–366. doi: 10.1038/nmeth.1898. [DOI] [PMC free article] [PubMed] [Google Scholar]
- 19.Marine S, Bahl A, Ferrer M, Buehler E. Common seed analysis to identify off-target effects in siRNA screens. J. Biomol. Screen. 2012;17(3):370–378. doi: 10.1177/1087057111427348. [DOI] [PubMed] [Google Scholar]
- 20.Barbie DA, Tamayo P, Boehm JS, Kim SY, Moody SE, Dunn IF, Schinzel AC, Sandy P, Meylan E, Scholl C, Fröhling S, Chan EM, Sos ML, Michel K, Mermel C, Silver SJ, Weir BA, Reiling JH, Sheng Q, Gupta PB, Wadlow RC, Le H, Hoersch S, Wittner BS, Ramaswamy S, Livingston DM, Sabatini DM, Meyerson M, Thomas RK, Lander ES, Mesirov JP, Root DE, Gilliland DG, Jacks T, Hahn WC. Systematic RNA interference reveals that oncogenic KRAS-driven cancers require TBK1. Nature. 2009;462(7269):108–112. doi: 10.1038/nature08460. [DOI] [PMC free article] [PubMed] [Google Scholar]
- 21.Cheung HW, Cowley GS, Weir BA, Boehm JS, Rusin S, Scott JA, East A, Ali LD, Lizotte PH, Wong TC, Jiang G, Hsiao J, Mermel CH, Getz G, Barretina J, Gopal S, Tamayo P, Gould J, Tsherniak A, Stransky N, Luo B, Ren Y, Drapkin R, Bhatia SN, Mesirov JP, Garraway LA, Meyerson M, Lander ES, Root DE, Hahn WC. Systematic investigation of genetic vulnerabilities across cancer cell lines reveals lineage-specific dependencies in ovarian cancer. Proc. Natl. Acad. Sci. USA. 2011;108(30):12372–12377. doi: 10.1073/pnas.1109363108. [DOI] [PMC free article] [PubMed] [Google Scholar]
- 22.Karolchik D, Hinrichs AS, Furey TS, Roskin KM, Sugnet CW, Haussler D, Kent WJ. The UCSC Table Browser data retrieval tool. Nucleic Acids Res. 2004;32:D493–D496. doi: 10.1093/nar/gkh103. [DOI] [PMC free article] [PubMed] [Google Scholar]
- 23.Kozomara A, Griffiths-Jones S. miRBase: integrating microRNA annotation and deep-sequencing data. Nucleic Acids Res. 2011;39:D152–D157. doi: 10.1093/nar/gkq1027. [DOI] [PMC free article] [PubMed] [Google Scholar]
- 24.Vergoulis T, Vlachos IS, Alexiou P, Georgakilas G, Maragkakis M, Reczko M, Gerangelos S, Koziris N, Dalamagas T, Hatzigeorgiou AG. Tarbase 6.0: Capturing the Exponential Growth of miRNA Targets with Experimental Support. Nucleic Acids Res. 2012;40:D222–229. doi: 10.1093/nar/gkr1161. [DOI] [PMC free article] [PubMed] [Google Scholar]
- 25.Schultz N, Marenstein DR, DeAngelis DA, Wang WQ, Nelander S, Jacobsen A, Marks DS, Massagué J, Sander C. Off-target effects dominate a large-scale RNAi screen for modulators of the TGF-β pathway and reveal microRNA regulation of TGFBR2. Silence. 2011;2:3. doi: 10.1186/1758-907X-2-3. [DOI] [PMC free article] [PubMed] [Google Scholar]
- 26.Lin X, Ruan X, Anderson MG, McDowell JA, Kroeger PE, Fesik SW, Shen Y. siRNA-mediated off-target gene silencing triggered by a 7 nt complementation. Nucleic Acids Res. 2005;33(14):4527–4535. doi: 10.1093/nar/gki762. [DOI] [PMC free article] [PubMed] [Google Scholar]
- 27.Carralot JP, Ogier A, Boese A, Genovesio A, Brodin P, Sommer P, Dorval T. A novel specific edge effect correction method for RNA interference screenings. Bioinformatics. 2012;28(2):261–268. doi: 10.1093/bioinformatics/btr648. [DOI] [PubMed] [Google Scholar]
- 28.Fisher RA. Statistical Methods for Research Workers. 1st ed Oliver & Boyd; Edinburgh: 1925. [Google Scholar]
- 29.Gonin HT. The use of factorial moments in the treatment of the hypergeometric distribution and in tests for regression. Philosophical Mag. 1936;7:215–226. [Google Scholar]
- 30.Gao J, Ade AS, Tarcea VG, Weymouth TE, Mirel BR, Jagadish HV, States DJ. Integrating and Annotating the Interactome using the MiMI plugin for Cytoscape. Bioinformatics. 2009;25(1):137–138. doi: 10.1093/bioinformatics/btn501. [DOI] [PMC free article] [PubMed] [Google Scholar]
- 31.Bader GD, Hogue CW. An automated method for finding molecular complexes in large protein interaction networks. BMC Bioinformatics. 2003;4:2. doi: 10.1186/1471-2105-4-2. [DOI] [PMC free article] [PubMed] [Google Scholar]
- 32.Maere S, Heymans K, Kuiper M. BiNGO: a Cytoscape plugin to assess overrepresentation of gene ontology categories in biological networks. Bioinformatics. 2005;21(16):3448–3449. doi: 10.1093/bioinformatics/bti551. [DOI] [PubMed] [Google Scholar]
- 33.Huang DW, Sherman BT, Lempicki RA. Systematic and integrative analysis of large gene lists using DAVID Bioinformatics Resources. Nature Protoc. 2009;4(1):44–57. doi: 10.1038/nprot.2008.211. [DOI] [PubMed] [Google Scholar]
- 34.Thomas PD, Kejariwal A, Campbell MJ, Mi H, Diemer K, Guo N, Ladunga I, Ulitsky-Lazareva B, Muruganujan A, Rabkin S, Vandergriff JA, Doremieux O. PANTHER: a browsable database of gene products organized by biological function, using curated protein family and subfamily classification. Nucleic Acids Res. 2003;31(1):334–341. doi: 10.1093/nar/gkg115. [DOI] [PMC free article] [PubMed] [Google Scholar]
- 35.Lupberger J, Zeisel MB, Xiao F, Thumann C, Fofana I, Zona L, Davis C, Mee CJ, Turek M, Gorke S, Royer C, Fischer B, Zahid MN, Lavillette D, Fresquet J, Cosset FL, Rothenberg SM, Pietschmann T, Patel AH, Pessaux P, Doffoël M, Raffelsberger W, Poch O, McKeating JA, Brino L, Baumert TF. EGFR and EphA2 are host factors for hepatitis C virus entry and possible targets for antiviral therapy. Nat. Med. 2011;17(5):589–595. doi: 10.1038/nm.2341. [DOI] [PMC free article] [PubMed] [Google Scholar]
- 36.Sarthy AV, Morgan-Lappe SE, Zakula D, Vernetti L, Schurdak M, Packer JC, Anderson MG, Shirasawa S, Sasazuki T, Fesik SW. Survivin depletion preferentially reduces the survival of activated K-RAS-transformed cells. Mol. Cancer Ther. 2007;6(1):269–276. doi: 10.1158/1535-7163.MCT-06-0560. [DOI] [PubMed] [Google Scholar]
- 37.Park JE, Heo I, Tian Y, Simanshu DK, Chang H, Jee D, Patel DJ, Kim VN. Dicer recognizes the 5′ end of RNA for efficient and accurate processing. Nature. 2011;475(7355):201–205. doi: 10.1038/nature10198. [DOI] [PMC free article] [PubMed] [Google Scholar]
- 38.Vermeulen A, Behlen L, Reynolds A, Wolfson A, Marshall WS, Karpilow J, Khvorova A. The contributions of dsRNA structure to Dicer specificity and efficiency. RNA. 2005;11(5):674–682. doi: 10.1261/rna.7272305. [DOI] [PMC free article] [PubMed] [Google Scholar]
- 39.Zheng M, Morgan-Lappe SE, Yang J, Bockbrader KM, Pamarthy D, Thomas D, Fesik SW, Sun Y. Inhibition and radiosensitization of glioblastoma and lung cancer cells by siRNA silencing of tumor necrosis factor receptor-associated factor 2. Cancer Res. 2009;68(18):7570–7578. doi: 10.1158/0008-5472.CAN-08-0632. [DOI] [PMC free article] [PubMed] [Google Scholar]
- 40.Cole KA, Huggins J, Laquaglia M, Hulderman CE, Russell MR, Bosse K, Diskin SJ, Attiyeh EF, Sennett R, Norris G, Laudenslager M, Wood AC, Mayes PA, Jagannathan J, Winter C, Mosse YP, Maris JM. RNAi screen of the protein kinome identifies checkpoint kinase 1 (CHK1) as a therapeutic target in neuroblastoma. Proc. Natl. Acad. Sci. USA. 2011;108(8):3336–3341. doi: 10.1073/pnas.1012351108. [DOI] [PMC free article] [PubMed] [Google Scholar]
- 41.Kaelin WG., Jr. Use and Abuse of RNAi to Study Mammalian Gene Function. Science. 2012;337(6093):421–422. doi: 10.1126/science.1225787. [DOI] [PMC free article] [PubMed] [Google Scholar]
Associated Data
This section collects any data citations, data availability statements, or supplementary materials included in this article.
Supplementary Materials
Suppl Figure 1. Breakpoint analysis for gene nomination
Examples highlighting breakpoint analysis towards performance assessments in both siRNA duplex and shRNA hairpin screens: A) siRNA duplexes per gene for a gain of function siRNA duplex screen. B) shRNA hairpins per gene for a lethal shRNA hairpin screen.
Suppl Figure 2. Frequency distribution plots for the 19 cell lines in the Barbie screen Near normal distribution of B-score values for 19 screened cell lines in the Barbie screen.
Suppl Figure 3. Active duplex identification in the resulting data from the 19 cell lines screens Frequency distribution plot of active shRNA hairpins per gene identified in each cell line from arrayed shRNA hairpin screen performed Barbie and co-workers; highlighting the predominance of 1-2 active hairpins per gene.
Suppl Figure 4. BDA workflow for hit nomination using the screening data from the Barbie screen
The BDA workflow based on the authors B score threshold of < −1 as the entry point for active duplex selection leading to a differential hit nomination across the 19 cell lines.
Suppl Figure 5. Overlap between genes nominated by the BDA method and those identified by Barbie and co-workers
Comparative analysis of the nominated hits using the BDA method to the reported 45 essential genes in the Barbie screen.
Suppl Figure 6. Active duplex identification in the 102 screened cell lines in the Cheung Screen
Frequency distribution plot of active shRNA hairpins per gene identified in each cell line from pooled shRNA hairpin screen performed Cheung and co-workers; highlighting the predominance of 1-2 active hairpins per gene. Cell lines are numbered as defined in Suppl Table 3.
Suppl Figure 7. Heatmap plot of the H scores values of nominated genes per cell line clustered by tumor type.
Suppl Figure 8. Lineage-specific overlaps between genes nominated by the BDA method as compared to those reported by Cheung and co-workers.
Suppl Figure 9. Overlap analysis of the BDA nominated hits in the two screens performed by Barbie and co-workers and Cheung and co-workers
Comparative analysis between KRAS-wt and KRAS-mu genes nominated by BDA; highlighting serious concerns as to the minimal overlap considering that the groups used the same TRC library and in some instances the same cell lines.
Suppl Figure 10. Overlap analysis of hits between Cheung and Barbie and against the same cell lines Minimal residual overlap of active and deemed essential genes in screens performed by Barbie and co-workers and Cheung and co-workers in two KRAS-mu cell lines (A549 and DLD-1); highlighting yet again the seriousness of lack of overlap especially for nominated high value target genes e.g. TBK1 and PAX8.


