Abstract
BACKGROUND
Surgery remains the first and most important treatment modality for the majority of solid tumors. Across a range of brain tumor types and grades, postoperative residual tumor has a great impact on prognosis. The principal challenge and objective of neurosurgical intervention is therefore to maximize tumor resection while minimizing the potential for neurological deficit by preserving critical tissue.
OBJECTIVE
To introduce the integration of desorption electrospray ionization mass spectrometry into surgery for in vivo molecular tissue characterization and intraoperative definition of tumor boundaries without systemic injection of contrast agents.
METHODS
Using a frameless stereotactic sampling approach and by integrating a 3-dimensional navigation system with an ultrasonic surgical probe, we obtained image-registered surgical specimens. The samples were analyzed with ambient de-sorption/ionization mass spectrometry and validated against standard histopathology. This new approach will enable neurosurgeons to detect tumor infiltration of the normal brain intraoperatively with mass spectrometry and to obtain spatially resolved molecular tissue characterization without any exogenous agent and with high sensitivity and specificity.
RESULTS
Proof of concept is presented in using mass spectrometry intraoperatively for real-time measurement of molecular structure and using that tissue characterization method to detect tumor boundaries. Multiple sampling sites within the tumor mass were defined for a patient with a recurrent left frontal oligodendroglioma, World Health Organization grade II with chromosome 1p/19q codeletion, and mass spectrometry data indicated a correlation between lipid constitution and tumor cell prevalence.
CONCLUSION
The mass spectrometry measurements reflect a complex molecular structure and are integrated with frameless stereotaxy and imaging, providing 3-dimensional molecular imaging without systemic injection of any agents, which can be implemented for surgical margins delineation of any organ and with a rapidity that allows real-time analysis.
Keywords: Brain neoplasms, Histopathology, Mass spectrometry, Neuronavigation, Neurosurgery, Stereotactic techniques
Malignant brain tumors present a major challenge in neurosurgery not only for their biological behavior but also because of their infiltration in the functioning brain. Currently preferred diagnostic imaging techniques, namely magnetic resonance imaging (MRI),1 have limited sensitivity and specificity to detect the full extent of malignant brain tumors, making it especially difficult to distinguish tumor from peritumoral edema and to recognize low density of tumor cells within otherwise normal brain tissue. Diagnosis, grading of tumors, and treatment rely primarily on neuro-pathological documentation of tissue, including cellular and nuclear morphology, proliferation, necrosis, vascu-larization, and characteristic cytogenetic aberrations.2 Moreover, when single biopsies or sparse surgical samples are used, there may be considerable heterogeneity, leading to sampling error. Surgical pathology-based approaches need to be complemented by improved intraoperative definition of tumors and their margins. This definition will help us obtain samples from appropriate histopathological areas and may provide additional molecular tissue characterization of the tumor. This improved tumor definition will help intraoperative decision making and maximize the extent of tumor resection.3
Surgery remains the first line of treatment for most brain tumor patients, and prognosis for many brain tumors depends significantly on the extent of surgical resection,4–7 but this must be balanced against preservation of functioning cortex and white matter.8–10 In recent years, there has been significant progress in developing imaging and image-guidance platforms for localizing and targeting brain tumors and revealing the full extent of infiltrating tumor with the anatomic and functional definition of involved brain areas.11–13 Frameless stereotaxy and neuro-navigation is key for aiding the neurosurgeon in the coregistration of the individual patient’s anatomy and images.
Mass spectrometry is a well-established, sensitive analytical technique used to identify and characterize molecules based on their mass and fragmentation pattern, respectively. The recent adaptation of mass spectrometers and their respective computer applications to accommodate tissue analysis provides simultaneous molecular profiling of hundreds of molecules without the need for radioactive or fluorescent tag.14 An increasing number of studies support the concept of mass spectrometry as an efficient tool to recognize and delineate pathology directly from tissue specimens.15–17 In 2004, desorption electrospray ionization (DESI) was introduced as an ambient desorption/ionization method for mass spectrometry18 and subsequently proven to be applicable to tissue imaging.19,20 The DESI technique is well suited for clinical deployment because it is a soft ionization method that allows the analysis of intact biomolecules and provides direct sampling of the tissue in the ambient environment without specialized sample preparation.21
The present study introduces the integration of DESI mass spectrometry into surgery for in vivo molecular tissue characterization and intraoperative definition of tumor boundaries, without systemic injection of contrast agents. This novel approach will provide complex molecular information during the surgery, complementing preoperative and intraoperative MRI and positron emission tomography (PET) with a potentially more sensitive and specific assessment of tumor boundaries in vivo.
PATIENTS AND METHODS
In Vivo Sampling and Image Registration
The tumor was resected with a combination of surgical forceps and the Cavitron Ultrasonic Surgical Aspirator (CUSA; Integra Radionics, Burlington, Massachusetts). Specimens dissected with surgical forceps were collected in separate clinical specimen collection containers on saline-soaked Telfa nonadherent and sterile pads (Johnson & Johnson, New Brunswick, New Jersey). The CUSA was operated at 24- or 35-kHz frequency with a neurosurgical hand piece. The surgical cavity was irrigated by a flow of saline directly from the surgical probe with simultaneous disintegration and aspiration of targeted tissue. The aspiration tube was deviated to a Lukens collection tube approximately 35 cm from the hand piece to reduce the typical sampling distance (4–5 m) without obstructing movement of the CUSA and to facilitate collection of small specimens. The collected aspirate was filtered, and both tissue and the blood-saline mixture were kept for analysis. Each sampling location was captured in correlation to the preoperative MRI study with the GE InstaTrak surgical navigation system (General Electric, Lawrence, Massachusetts). Brain outline models were created from segmentation by the FSL Brain Extraction Tool (FMRIB Analysis Group, Oxford, United Kingdom). Views were rendered in 3-dimensional (3D) Slicer (Surgical Planning Laboratory, Brigham and Women’s Hospital, Boston, Massachusetts).
Histopathology
Each specimen was formalin fixed, paraffin embedded, sectioned, and stained with hematoxylin and eosin according to standard clinical protocols for histopathological diagnosis according to World Health Organization classification. Specimens were evaluated by a neuropathologist (K.L.) and scored visually with respect to their percentage of tumor nuclei relative to the total nuclei in the sample. Samples were also characterized and assigned a qualitative from normal to infiltrative to solid, corresponding from low to high cellularity.
DESI Mass Spectrometry Analysis
Specimens each measuring approximately 0.2 × 0.2 × 0.2 cm were snap-frozen, with assistance from the Brigham and Women’s Hospital Neurooncology Program Biorepository collection. Each tissue specimen was transferred to a Histobond microscope glass slide via a sterilized stainless steel spatula and allowed to dry for approximately 5 minutes under nitrogen before analysis. When possible, the tissue specimen was secured to a cooled specimen chuck with optimal cutting media and sectioned to 10-µm thickness with a Leica CM1800 cryostat. Each tissue section was thaw-mounted onto a Histobond microscope glass slide, attached to the Omni Spray Ion Source, and then analyzed without further preparation. All DESI experiments were performed with a manual Omni Spray Ion Source (Prosolia, Inc, Indianapolis, Indiana) coupled to an LTQ XL linear ion trap mass spectrometer (Thermo Fisher Scientific, San Jose, California). The Omni Spray Ion Source conditions were as follows: solvent, 70:30 methanol:water; solvent flow rate, 2 µL/min; nebulizing gas pressure, 100 psi; incident angle, 55°; and tip-to-surface distance, 1 mm. Each spectrum was recorded by tuning the mass spectrometer to negative ion detection.
Direct Identification of Molecules With Tandem Mass Spectrometry
Tandem mass spectrometry experiments were performed on the same instrumentation and DESI experimental conditions as described for direct tissue analysis. The tandem mass spectrometry experimental conditions were the following: isolation width, 1.5 Thomson; activation time, 30 milliseconds; and normalized collision energy, 20% (manufacturer’s units).
Three-Dimensional Visualization of Mass Spectrometry Data
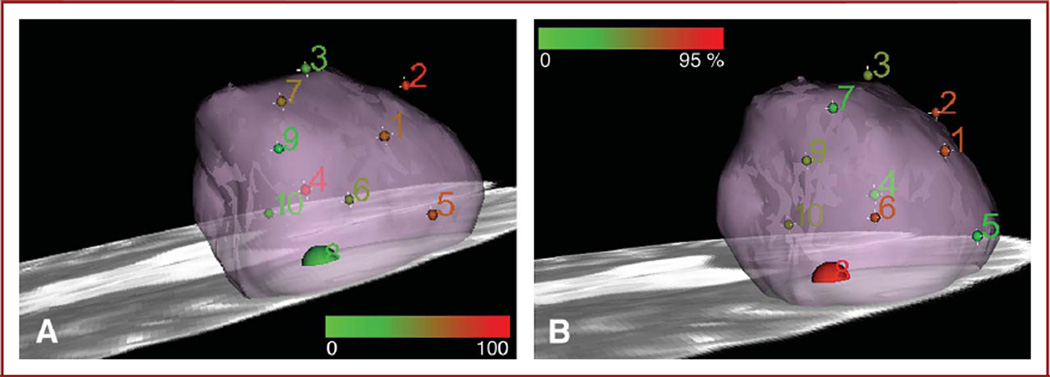
Mass spectrometry data were imported into MATLAB, and profile spectra were constructed as the sum of the spectra acquired over time for each sample. Absolute intensities were converted to relative intensities via scaling to occupy the range 0 to 1 in the m/z 600 to 1000 range. For each peak under analysis, intensities were summed in a 1-Thomson peak width. The sites were colored from green to red in proportion to increasing intensity of a selected mass spectrometry peak to be visualized. The relative intensities for m/z 768.3 ± 0.5 for each of the samples were analyzed and the values scaled to fit a color scale range of 0 to 255. The RGB format was used to render the coloring in Slicer 3, an open-source visualization tool provided by the National Alliance for Medical Image Computing consortium. Green to red indicates an increasing relative intensity corresponding to a specific m/z value. The figures were rounded to a radius of 2 mm for all sites except site 8, which was represented with a radius of 5 mm to account for the larger size of the resected specimen. Similar visualization of the tumor cell concentration is presented with the 0 to 255 color scale corresponding to 0% to 95% tumor cell concentration as scored by expert neuropathology evaluation of permanent tissue sections.
RESULTS
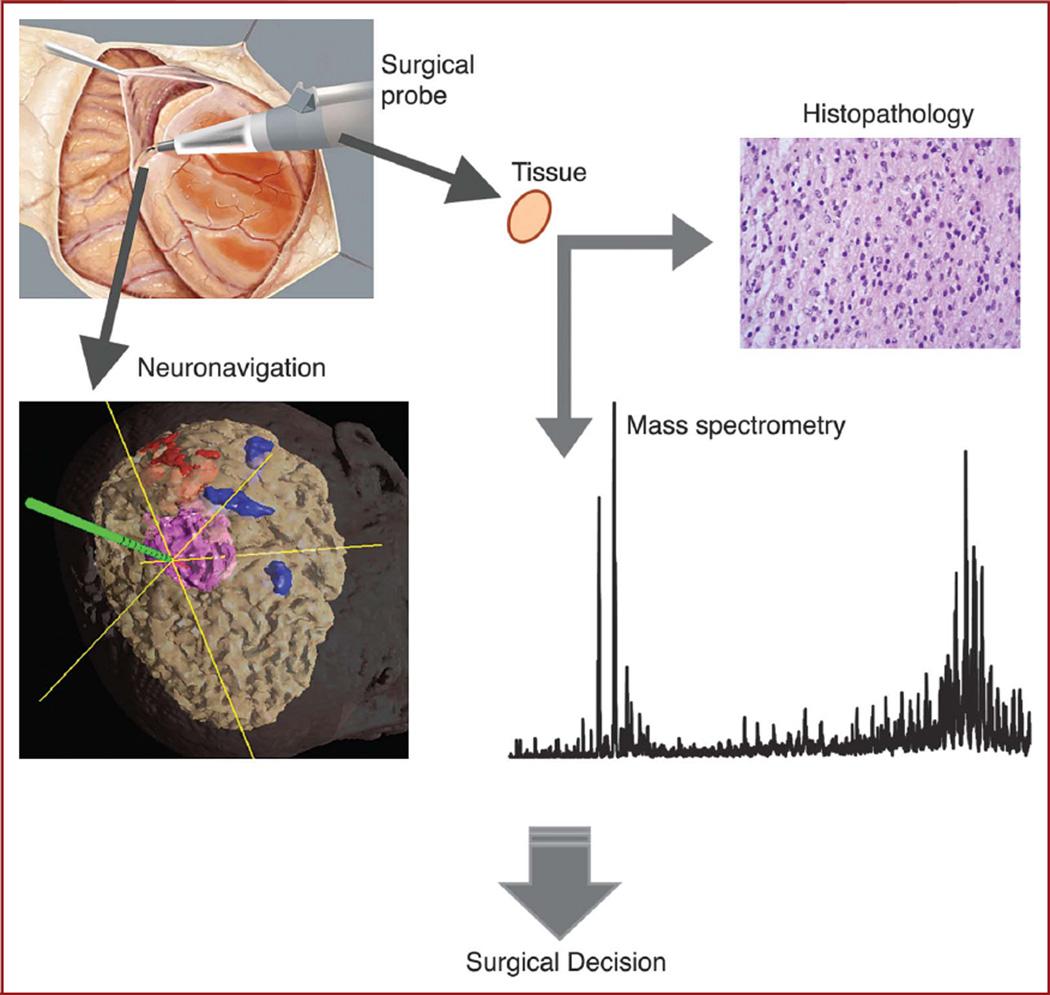
By integrating stereotactic surgery with histopathology and ambient mass spectrometry, we developed a methodology to allow intraoperative assessment of tumor margin boundaries. The methodology takes advantage of the sensitivity and specificity of mass spectrometry for the detection of tumor extent and the presence of tumor boundaries. Although detection sensitivity with DESI mass spectrometry depends on factors such as surface, solvent system, and matrix composition, studies from Cooks’ group report the high reproducibility for the detection of selected small molecules in the 10-nM range,24 and tandem mass spec-trometry of surface deposited lipids from typically 200 pmol lipids.25 Surgical sampling sites were localized and digitally registered to the preoperative MRI through the use of neuro-navigation (Figure 1). Sampling the tumor in multiple locations for mass spectrometry and subsequent histopathological evaluation is accomplished by use of the navigation system that registers the sample locations on the image. Multiple sampling sites within the tumor mass and beyond the MRI-visible enhancing margins were defined. Figure 2 illustrates the workflow in a clinical case of a patient with a recurrent left frontal oligodendroglioma, World Health Organization grade II with chromosome 1p/19q codeletion. Histopathological evaluation of each specimen further revealed heterogeneity throughout the tumor in terms of composition, cell concentration, and signs of inflammatory response.
FIGURE 1.
Intraoperative mass spectrometry for identification of tumor margins. The approach is validated by correlation of ambient mass spectrometry analysis of tissue specimens with histopathological evaluation. Both types of analysis of stereotactically resected specimens are additionally correlated to preoperative radiological presentation of the lesion by digital identification of each sampling location with the navigation system.
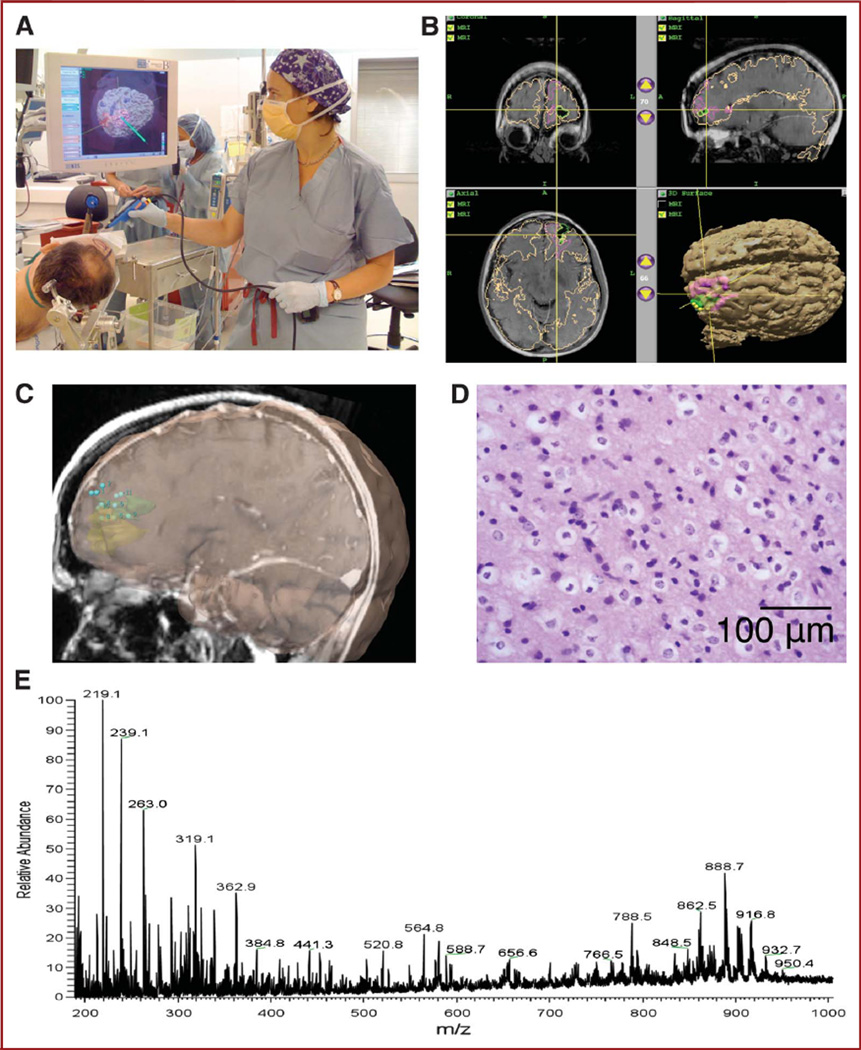
FIGURE 2.
Workflow. A, positioning and calibration of navigation probe. B, navigation with preoperative functional magnetic resonance imaging with colored overlays indicating tumor and eloquent cortex (by functional magnetic resonance imaging). C, digital registration of stereotactic sampling of the tumor bed. D, histopathology evaluation of Cavitron Ultrasonic Surgical Aspirator (CUSA) specimen with hematoxylin and eosin staining. Preservation of cellularity with the CUSA surgical probe is represented. E, direct desorption electrospray ionization mass spectrometry analysis of specimen.
Case Study
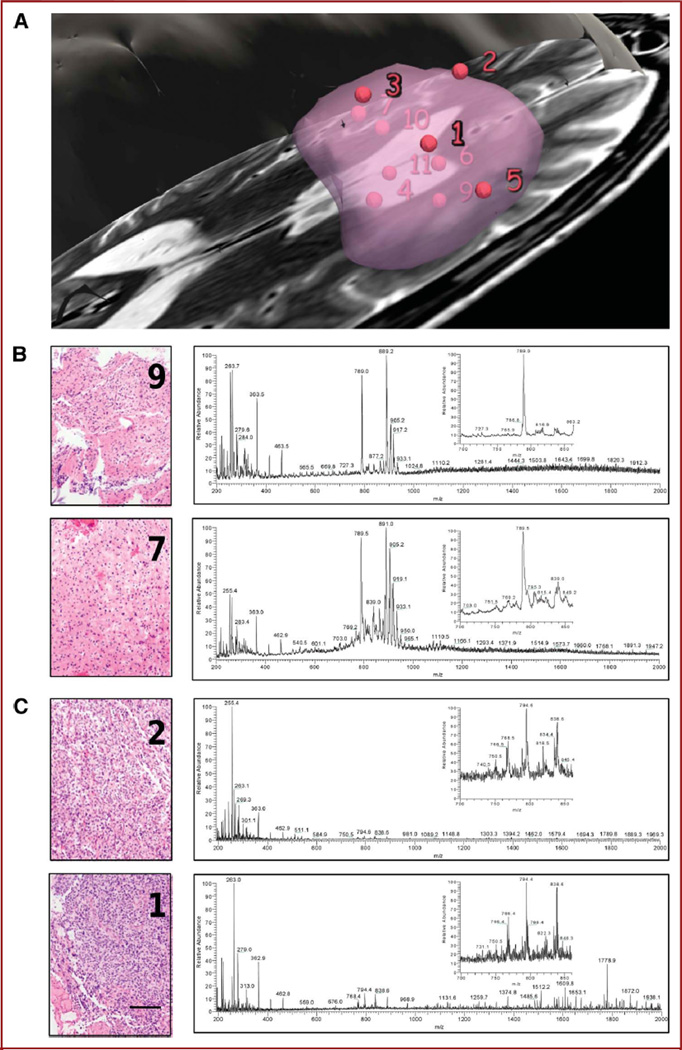
Patients gave informed consent for tissue review and investigational image-guided surgery in accordance with the Internal Review Board of Partners Healthcare. According to the standard of care, the bulk of the tumor presented in Figure 3 was promptly made available to histopathological evaluation in the frozen section room to ensure confident diagnosis. Additional specimens of approximately 2 mm3 were resected from 11 different locations within the tumor, including from superficial, interior, and deep locations (Figure 3A) in the course of standard of care intervention (ie, no specimens were taken for the sole purpose of research). Each specimen was then separated into 2 aliquots and subjected to both histological analysis of hematoxylin and eosin–stained sections by a neuropathologist and direct mass spectrometry analysis with DESI. Each MRI-registered specimen was diagnosed histopathologically on permanent section according to the World Health Organization grading system and given a score for the estimated concentration of tumor cells. Corresponding specimens were independently subjected to mass spectrometry analysis between m/z 200 and 2000 using the DESI source. The mass spectra acquired from a 200-µm2 area of the specimen were then correlated to MRI signal characteristics at a given locus and to histological micrographs of the tissue stained to depict cell nuclei and cytoplasm with hematoxylin and eosin, respectively. The estimation of tumor cell concentration was used to qualitatively correlate mass spectrometry multivariate signals (Figure 3). Tumor cell concentrations varied from 5% to 95%, showing infiltration of normal cortex and tumor heterogeneity and necrosis.
FIGURE 3.
Case analysis. A, view of sampling sites relative to manually segmented tumor. Each specimen was analyzed by mass spectrometry using a desorption electrospray ionization source combined with a linear trap mass analyzer. B, corresponding spectra for negative ions are shown for specimens of infiltrative tumor region (9 and 7), together with histopathological evaluation and 50% and 30% tumor cell concentration, respectively. C, analysis of high cell density (2 and 1) specimens with 90% tumor cell concentration. Portions of the mass spectra are enlarged (inset). Scale bar represents 100 µm.
Identification of Selected Molecules
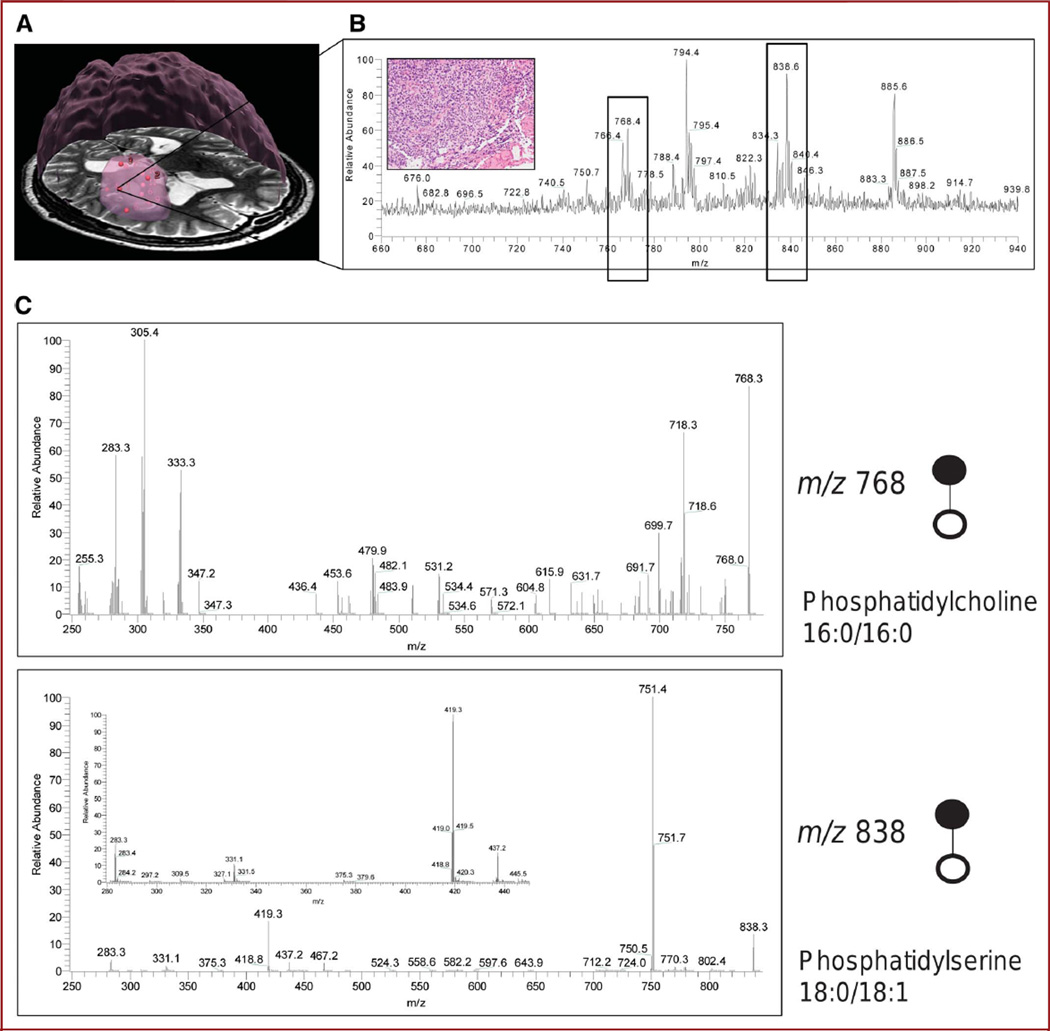
Selected molecules contributing to the mass spectral differences between regions of lower and higher tumor cell concentrations were identified by tandem mass spectrometry from specimen 1 depicted in Figure 4A, which was superficial to the apparent tumor bulk and showed high cellularity according to histopathology (Figure 4B, inset). Spectra of the product ions obtained from fragmentation of m/z 768.3 and 838.6 (Figure 4C) by collision-induced dissociation enabled the assignment of 2 differentiating peaks. On collision-induced dissociation, the peak at m/z 768 produced product ions showing the losses of the fatty acid chains indicative of the presence of phospholipid species. Furthermore, the neutral loss of 50 Da from m/z 768 is indicative of chloride adducts of phospholipids in which the product ion at m/z 718 corresponds to [M-Cl-CH3]2. Chloride adducts are commonly observed in negative ion–mode (detection of negatively charged ions) DESI mass spectrometry.26 Given the low mass resolution of the instrumentation used in these early studies, it is expected that isobaric ions will be isolated together with the selected precursor ion and thus produce a heterogeneous product ion spectrum. The peak at m/z 838 was also assigned as phosphatidylserine 18:0/18:1.25,27,28 Tandem mass spectrometry results for 4 peaks are summarized in the Table.
FIGURE 4.
Direct identification of molecules with in vivo stereotactic coordinates. A, three-dimensional rendering of the tumor from preoperative magnetic resonance image with sampling positions represented by red spheres. The bulk of the tumor is represented by a large, roughly spherical volume. B, a region of spectral differences for this highly cellular specimen (inset) was further analyzed to identify molecules contributing to tissue distinction. Two negative ions represented by peaks (boxed) at m/z 768 and 838 were subjected to tandem mass spectrometry with collision-induced dissociation. C, fragmentation patterns for the 2 negative ions of interest at m/z 768.3 and 838.6 correspond to phosphatidylcholine 16:0/16:0 and phosphatidylserine 18:0/18:1
TABLE.
Identification of Selected Peaks by Tandem Mass Spectrometry
| Identification | Precursor Ions, m/z | Product Ions, m/z |
|---|---|---|
| Phosphatidylcholine 30:0 + CHO2− | 750.4 | 732.5; 682.5; 464.4; 436.4; 375.3; 331.3; 303.3; 287.3; 256.3 |
| Phosphatidylcholine 16:0/16:0 | 768.3 | 750.0; 718.3; 699.7; 684.8; 640.5; 631.7; 534.4; 510.1; 482.1; 453.6; 436.4; 333.3; 305.4; 283.1; 255.3 |
| Phosphatidylcholine | 794.4 | 744.4; 480.3; 331.3; 283.3 |
| Phosphatidylserine 18:0/18:1 | 838.6 | 778.5; 751.4; 467.3; 437.3; 419.3; 331.3; 283.3 |
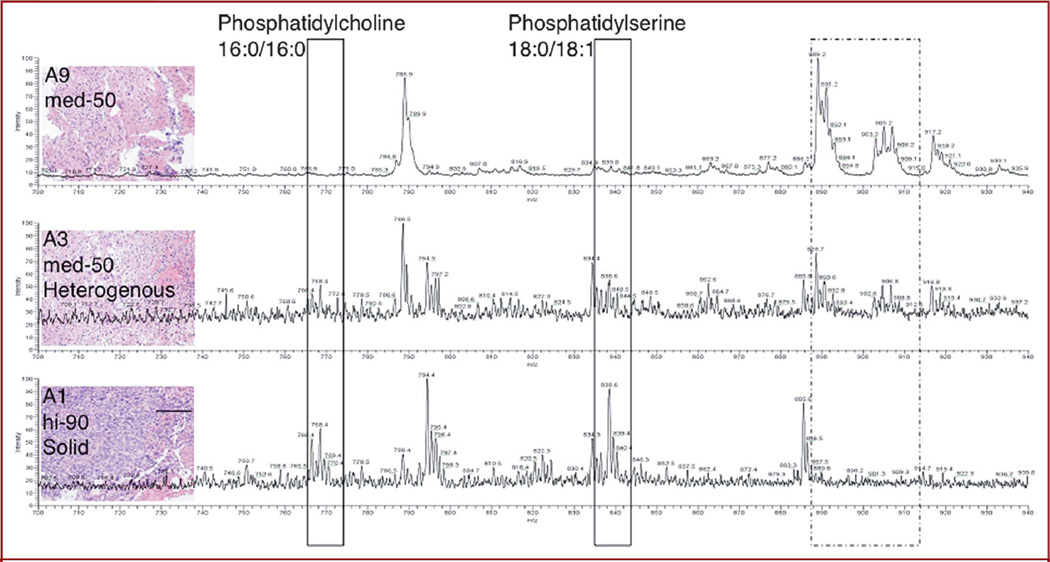
Although delineating tumor boundaries based on multivariate profiling does not require the identification of molecular ions, their identification is expected to provide significant insight into tumor molecular structure and biology and into the class of biomolecules selected under the present experimental conditions, potentially contributing to protocol optimization. In a qualitative comparison of the spectra acquired for specimens representing low, intermediate, and high tumor cell constitutions, the region between m/z 600 and 1000 in negative mode offers the most differences (Figure 5 and Figure 1 in the Supplemental Digital Content 1, http://links.lww.com/NEU/A349). This region of the mass spectrum typically represents different forms of phospholipids, which are constituents of cellular membranes, and differentiate normal from tumor tissue.
FIGURE 5.
Correlation between molecular and histopathological changes. Qualitative correlation of different phospholipid proportions with histological evaluation of tumor cell prevalence for compared specimens. Scale bar represents 100 µm.
Histopathological Validation and Visualization
To assist in data correlation and communication, a color scale was developed for 3D rendering in Slicer 3 (Surgical Planning Laboratory, Brigham and Women’s Hospital, Harvard Medical School, Boston, Massachusetts; www.slicer.org). Tumor cell concentration according to the histopathology evaluation is considered the gold standard in validation of the approach (Figure 6A) and is rendered for each specimen throughout the tumor volume, with respective mass spectrometry signal intensity for a single peak at m/z 768.3 ± 0.5 (Figure 6B) assigned to phosphatidylcholine 16:0/16:0. The increase in cellularity observed from the histological presentation of the specimens is somewhat correlated with an increase in signal from phosphatidylcholine 16:0/16:0 and phosphatidylserine 18:0/16:0 and a concomitant general decrease in the spectral region comprising some sphingolipids and phosphatidylinositols.25,27–29 High-resolution mass spectrometry instrumentation, combined with multivariate analysis of rich spectra, should allow more sensitive and specific delineation of tumor margins than provided by a qualitative assessment of single molecular markers and potentially provide diagnostic information from a reference database system.
FIGURE 6.
A 3-dimensional rendering of mass spectrometry data and histopathology scoring. The size of the spheres is to scale to represent the approximate size of each specimen and corresponding theoretical sampling error from the navigation system, without accounting for inherent imaging error and brain shift. Small spheres are 2.0 mm in radius; larger sphere for specimen 8 is 5.0-mm radius (4-mm radius specimen and 1.0-mm radius sampling error). A, Distribution of m/z 768.3 ± 0.5 tentatively assigned to phosphatidylcholine 16:0/16:0 in tumor; for specimen 8, the mean of the signals from A and B was taken. Color scale corresponds to a 0 to 100 relative intensity in the m/z 600 to 1000 range. B, color map corresponding to tumor cell concentration as evaluated by neuropathologist on hematoxylin and eosin–stained permanent sections. Color scale corresponds to 0% to 95% tumor cell concentration.
DISCUSSION
Mass spectrometry is highly sensitive, is applicable for analyzing most biomolecules, and has a broad dynamic range, making it an attractive approach to respond to the high-performance demands of personalized care implementation. Current mass spectrometers used in biological sciences can routinely detect femtomoles (1510−15 mol) of analytes, and some specialized instrumentation can now detect as low as zeptomole (10−21 mol) amounts.30 Different mass spectrometry approaches have been shown to distinguish between diseased and healthy tissue in the laboratory.15,17,31 Capitalizing on speed and sensitivity of mass spectrometry, a method was developed to expedite the validation and implementation of a novel surgical guidance approach. Current clinical means of determining optimal limits of resection are limited to macroscopic and microscopic examination of tissue in correlation to imaging findings. Even though intraoperative rapid neuropathology diagnosis has been shown to be highly correlated with final diagnosis,32,33 limited sampling of the heterogeneous tumor and direct interpretation of microscopic information are impractical in delineating tumor margins and insufficient for real-time decision making.
The surgical mass spectrometry approach can be deployed directly in the operating room and can be fully integrated with the surgical procedure. Imaging methods such as MRI, functional MRI, PET, and magnetic resonance spectroscopy (MRS) are being combined into a multimodality and multiparametric imaging platform to maximize the specificity and sensitivity of tumor margins detection and to ensure the preservation of eloquent and anatomically critical regions of the brain. However, as a result of intrinsic limitations in their spatial and spectral resolution, such methods provide limited, if any, molecular information. Neuronavigation also has its own limitations. Although the localization accuracy of tumor margins is within a few millimeters for external fixed or fiducial markers,12 in practice, this accuracy decreases after craniotomy, which induces deformation and shifts of brain structures, affecting the surgeon’s ability to locate even MRI-identified tumor boundaries.34 Intraoperative MRI with serial imaging can follow and compensate for brain shifts and deformations but is not available in every neurosurgical department.10,35 Detection of tumors intraoperatively with navigation probes is a correct local measurement. However, if preoperative images are used for navigation, the sampling sites can be significantly misregistered owing to elastic deformation problems. For this early development of the technique, even in the presence of brain shift, the estimation of the relative positions of samples is sufficient to allow initial correlation among imaging, histological, and added molecular findings. Further complementation and direct correlation of such protocols with intraoperative MRI and/or PET and standard histopathology should achieve higher spatial resolution for validation of tumor margin localization.
The mass spectrometry approach provides multivariate molecular structural data on the surgical site without any molecular agent and without any systemic injection. From the surgical perspective, multisite sampling of the tumor bed was done with surgical forceps and/or the CUSA, which dislocates tissue through ultrasonic vibration of the probe tip. Both approaches are already part of standard procedures in neurosurgery. Even though CUSA is typically used as a tissue disintegration device, our results show the recovery of diagnostic-quality tissue, reinforcing previous reports.36–38
The concept of stereotactic intraoperative mass spectrometry is technically feasible, and it provides preliminary correlation of the spectral differences with gold standard histopathological features of the tissue containing both normal brain and tumor. In specimens of lower tumor cell concentration, the spectra were richer in the m/z region of 850 to 1000, representing a higher proportion of normal cortex composition of the tissue or an environment favoring the desorption and ionization molecules within this mass range. For specimens with increasing proportions of tumor cells, the spectral signatures shifted to a greater representation of phosphatidylcholines and phosphatidylserines, consistent with a higher proportion of cellular membranes, with a concomitant signal reduction in the m/z 850 to 1000 range, or again simply a milieu favoring such pattern of desorption and ionization.
For the presented case, the use of the spectra from the phospholipids mass region resolved varying degrees of cellularity in the tissue and demonstrated agreement with histological evaluation, but analysis of a series of cases is needed for validation. These findings suggest that the metabolites seen in this approach may overlap with those measured in MRS used in cancer diagnosis in which choline and phosphatidylcholine contribute to diagnostic signatures.39–42 Common molecular observations with MRS and mass spectrometry could potentially become a means of validating the 2 spectroscopic approaches against each other in determining their sensitivity and specificity and for use in complementary approaches. Similar corroboration of the 2 analytical methods has been reported for the analysis of liquid specimens by DESI mass spectrometry and nuclear magnetic resonance spectroscopy.43 Tissue-derived mass spectrometry data offer a wealth of unexplored information available that could potentially enable more precise molecular assessment of the surgical cavity by further development of mathematical analyses, and the well-established clinical implementation of MRS should orient similar adoption of mass spectrometry.
Mass spectrometry has been widely exploited in many fields of research and has already translated to applications in response to the demand of highly sensitive techniques in forensics, security screening, and food quality monitoring, to name a few. Some research applications of mass spectrometry are also shown to differentiate disease from healthy tissue with histopathology validation.16 The presented method in development translates mass spectrometry to stereotactic brain surgery and relies on the real-time analysis of tissue in the operating room. It can be adapted to validate and implement surgical mass spectrometry to organs other than the brain, as well as other diseases such as breast cancer for which the definition of optimal surgical boundaries is limited by current histopathology and radiology techniques. Moreover, the concept can be expanded to test other analytical or spectroscopic methods shown to have the ability to distinguish between disease and healthy tissue and to validate multimodality imaging concepts in intraoperative surgical planning. In its clinical infancy, intraoperative mass spectrometry has the potential to significantly enhance surgical efficacy.
The selected ambient desorption/ionization DESI method presented here enables the analysis to be performed directly from tissue, without any sample preparation and without changing current surgical procedures, allowing real-time analysis and eliminating artifacts introduced by preparation. Spatially localized correlation of molecular information obtained from direct tissue characterization by mass spectrometry to preoperative and/or intraoperative images should contribute to a better understanding of the molecular composition of malignant brain tumors, the involvement of the infiltrated brain tissue, and the definition of surgical margins.
Supplementary Material
Acknowledgements
We thank Professors Ron Kikinis and R. Graham Cooks for insightful discussions. We also thank Professor J. Agar for continued discussion and for editing the manuscript. We gratefully acknowledge the assistance of operating room nurses and Kristen K. Gill for tissue banking. The 3D Slicer software used to create the molecular structure and histopathology renderings is available at http://www.slicer.org/pages/UserOrientation.
This work was supported by grants from the Brain Science Foundation, the American Brain Tumor Association, and the Daniel E. Ponton Fund for the Neurosciences to NYRA. The 3D Slicer was developed by the National Alliance for Medical Image Computing and funded by National Institutes of Health (NIH) grant U54-EB005149. This work was also supported in part by NIH grants (NAC P41-RR13218 and P01-CA067165) through Brigham and Women’s Hospital. Its contents are solely the responsibility of the authors and do not necessarily represent the official views of the NIH. Dr Wiseman is employed by Prosolia Inc, which manufactures DESI sources. Drs Agar, Golby, and Jolesz have submitted a patent application related to the presented study.
ABBREVIATIONS
- CUSA
Cavitron Ultrasonic Surgical Aspirator
- DESI
desorption electrospray ionization
- MRS
magnetic resonance spectroscopy
COMMENT
This article is very interesting. The mass spectrometry method described has been adopted in only 1 case of World Health Organization grade 2 oligodendroglioma with chromosome 1p/19q, and the results have been very interesting and seem to be useful. The reader may want to know that this mass spectrometry method is truly useful for malignant glioma (grade 3 and 4) surgery to understand the tumor-brain interface. Because this article is only preliminary without data on specificity and sensitivity, perhaps the authors should have titled it as preliminary. The discussion is too conclusive about the usefulness of this mass spectroscopy in understanding the interface of tumor and brain because its true usefulness, sensitivity, and specificity have not yet been established.
Tomokatsu Hori, MD
Tokyo, Japan
Footnotes
Supplemental digital content is available for this article. Direct URL citations appear in the printed text and are provided in the HTML and PDF versions of this article on the journal’s Web site (www.neurosurgery-online.com).
Disclosure
The authors have no personal, financial, or institutional interest in any of the drugs, materials, or devices described in this article.
REFERENCES
- 1.Cha S. Update on brain tumor imaging. Curr Neurol Neurosci Rep. 2005;5(3):169–177. doi: 10.1007/s11910-005-0044-x. [DOI] [PubMed] [Google Scholar]
- 2.Yip S, Iafrate AJ, Louis DN. Molecular diagnostic testing in malignant gliomas: a practical update on predictive markers. J Neuropathol Exp Neurol. 2008;67(1):1–15. doi: 10.1097/nen.0b013e31815f65fb. [DOI] [PubMed] [Google Scholar]
- 3.Furnari FB, Fenton T, Bachoo RM, et al. Malignant astrocytic glioma: genetics, biology, and paths to treatment. Genes Dev. 2007;21(21):2683–2710. doi: 10.1101/gad.1596707. [DOI] [PubMed] [Google Scholar]
- 4.Philippon JH, Clemenceau SH, Fauchon FH, Foncin JF. Supratentorial low-grade astrocytomas in adults. Neurosurgery. 1993;32(4):554–559. doi: 10.1227/00006123-199304000-00010. [DOI] [PubMed] [Google Scholar]
- 5.Janny P, Cure H, Mohr M, et al. Low grade supratentorial astrocytomas: management and prognostic factors. Cancer. 1994;73(7):1937–1945. doi: 10.1002/1097-0142(19940401)73:7<1937::aid-cncr2820730727>3.0.co;2-g. [DOI] [PubMed] [Google Scholar]
- 6.Healy GB, Upton J, Black PM, Ferraro N. The role of surgery in rhabdomyo-sarcoma of the head and neck in children. Arch Otolaryngol Head Neck Surg. 1991;117(10):1185–1188. doi: 10.1001/archotol.1991.01870220133025. [DOI] [PubMed] [Google Scholar]
- 7.Piepmeier J, Christopher S, Spencer D, et al. Variations in the natural history and survival of patients with supratentorial low-grade astrocytomas. Neurosurgery. 1996;38(5):872–878. doi: 10.1097/00006123-199605000-00002. [DOI] [PubMed] [Google Scholar]
- 8.Talos IF, Zou KH, Ohno-Machado L, et al. Supratentorial low-grade glioma resectability: statistical predictive analysis based on anatomic MR features and tumor characteristics. Radiology. 2006;239(2):506–513. doi: 10.1148/radiol.2392050661. [DOI] [PMC free article] [PubMed] [Google Scholar]
- 9.Moriarty TM, Kikinis R, Jolesz FA, Black PM, Alexander E., III Magnetic resonance imaging therapy. Intraoperative MR imaging. Neurosurg Clin N Am. 1996;7(2):323–331. [PubMed] [Google Scholar]
- 10.Jolesz FA, Talos IF, Schwartz RB, et al. Intraoperative magnetic resonance imaging and magnetic resonance imaging-guided therapy for brain tumors. Neuroimaging Clin N Am. 2002;12(4):665–683. doi: 10.1016/s1052-5149(02)00036-9. [DOI] [PubMed] [Google Scholar]
- 11.Schwartz RB, Hsu L, Wong TZ, et al. Intraoperative MR imaging guidance for intracranial neurosurgery: experience with the first 200 cases. Radiology. 1999;211(2):477–488. doi: 10.1148/radiology.211.2.r99ma26477. [DOI] [PubMed] [Google Scholar]
- 12.Upadhyay UM, Golby AJ. Role of pre- and intraoperative imaging and neuronavigation in neurosurgery. Expert Rev Med Devices. 2008;5(1):65–73. doi: 10.1586/17434440.5.1.65. [DOI] [PubMed] [Google Scholar]
- 13.Black PM, Moriarty T, Alexander E, III, et al. Development and implementation of intraoperative magnetic resonance imaging and its neurosurgical applications. Neurosurgery. 1997;41(4):831–842. doi: 10.1097/00006123-199710000-00013. [DOI] [PubMed] [Google Scholar]
- 14.Stoeckli M, Chaurand P, Hallahan DE, Caprioli RM. Imaging mass spectrometry: a new technology for the analysis of protein expression in mammalian tissues. Nat Med. 2001;7(4):493–496. doi: 10.1038/86573. [DOI] [PubMed] [Google Scholar]
- 15.Chaurand P, Schwartz SA, Billheimer D, Xu BJ, Crecelius A, Caprioli RM. Integrating histology and imaging mass spectrometry. Anal Chem. 2004;76(4):1145–1155. doi: 10.1021/ac0351264. [DOI] [PubMed] [Google Scholar]
- 16.Chaurand P, Schwartz SA, Caprioli RM. Assessing protein patterns in disease using imaging mass spectrometry. J Proteome Res. 2004;3(2):245–252. doi: 10.1021/pr0341282. [DOI] [PubMed] [Google Scholar]
- 17.Schwartz SA, Weil RJ, Thompson RC, et al. Proteomic-based prognosis of brain tumor patients using direct-tissue matrix-assisted laser desorption ionization mass spectrometry. Cancer Res. 2005;65(17):7674–7681. doi: 10.1158/0008-5472.CAN-04-3016. [DOI] [PubMed] [Google Scholar]
- 18.Takats Z, Wiseman JM, Gologan B, Cooks RG. Mass spectrometry sampling under ambient conditions with desorption electrospray ionization. Science. 2004;306(5695):471–473. doi: 10.1126/science.1104404. [DOI] [PubMed] [Google Scholar]
- 19.Wiseman JM, Puolitaival SM, Takats Z, Cooks RG, Caprioli RM. Mass spectrometric profiling of intact biological tissue by using desorption electrospray ionization. Angew Chem Int Ed Engl. 2005;44(43):7094–7097. doi: 10.1002/anie.200502362. [DOI] [PubMed] [Google Scholar]
- 20.Wiseman JM, Ifa DR, Song Q, Cooks RG. Tissue imaging at atmospheric pressure using desorption electrospray ionization (DESI) mass spectrometry. Angew Chem Int Ed Engl. 2006;45(43):7188–7192. doi: 10.1002/anie.200602449. [DOI] [PubMed] [Google Scholar]
- 21.Wiseman JM. Development of Desorption Electrospray Ionization (DESI) Mass Spectrometry and Its Application to Direct Biological Tissue Analysis and Molecular Imaging. West Lafayette, IN: Purdue University; 2006. [Google Scholar]
- 22.Louis DN, Ohgaki H, Wiestler OD, Cavenee WK. WHO Classification of Tumors of the Central Nervous System. 4th ed. Lyon, Switzerland: WHO Press; 2007. [Google Scholar]
- 23.Wiseman JM, Ifa DR, Venter A, Cooks RG. Ambient molecular imaging by desorption electrospray ionization mass spectrometry. Nat Protoc. 2008;3(3):517–524. doi: 10.1038/nprot.2008.11. [DOI] [PubMed] [Google Scholar]
- 24.Ifa DR, Manicke NE, Rusine AL, Cooks RG. Quantitative analysis of small molecules by desorption electrospray ionization mass spectrometry from poly-tetrafluoroethylene surfaces. Rapid Commun Mass Spectrom. 2008;22(4):503–510. doi: 10.1002/rcm.3377. [DOI] [PubMed] [Google Scholar]
- 25.Manicke NE, Wiseman JM, Ifa DR, Cooks RG. Desorption electrospray ionization (DESI) mass spectrometry and tandem mass spectrometry (MS/MS) of phospholipids and sphingolipids: ionization, adduct formation, and fragmentation. J Am Soc Mass Spectrom. 2008;19(4):531–543. doi: 10.1016/j.jasms.2007.12.003. [DOI] [PubMed] [Google Scholar]
- 26.Zhang X, Reid G. Multistage tandem mass spectrometry of anionic phosphatidylcholine lipid adducts reveals novel dissociation pathways Int J Mass. Spectrom. 2006;252(3):242–255. [Google Scholar]
- 27.Sud M, Fahy E, Cotter D, et al. LMSD: LIPID MAPS structure database. Nucleic Acids Res. 2007;35(database issue):D527–D532. doi: 10.1093/nar/gkl838. [DOI] [PMC free article] [PubMed] [Google Scholar]
- 28.Fahy E, Subramaniam S, Murphy RC, et al. Update of the LIPID MAPS comprehensive classification system for lipids. J Lipid Res. 2009;50(Suppl):S9–S14. doi: 10.1194/jlr.R800095-JLR200. [DOI] [PMC free article] [PubMed] [Google Scholar]
- 29.Murphy RC, Hankin JA, Barkley RM. Imaging of lipid species by MALDI mass spectrometry. J Lipid Res. 2009;50(Suppl):S-317–S-322. doi: 10.1194/jlr.R800051-JLR200. [DOI] [PMC free article] [PubMed] [Google Scholar]
- 30.Watson JT, Sparkman OD. Introduction to Mass Spectrometry: Instrumentation, Applications, and Strategies for Data Interpretation. 4th ed. Hoboken, NJ: John Wiley & Sons, Ltd; 2008. [Google Scholar]
- 31.Cooks RG, Ouyang Z, Takats Z, Wiseman JM. Detection technologies: ambient mass spectrometry. Science. 2006;311(5767):1566–1570. doi: 10.1126/science.1119426. [DOI] [PubMed] [Google Scholar]
- 32.Uematsu Y, Owai Y, Okita R, Tanaka Y, Itakura T. The usefulness and problem of intraoperative rapid diagnosis in surgical neuropathology. Brain Tumor Pathol. 2007;24(2):47–52. doi: 10.1007/s10014-007-0219-z. [DOI] [PubMed] [Google Scholar]
- 33.Tilgner J, Herr M, Ostertag C, Volk B. Validation of intraoperative diagnoses using smear preparations from stereotactic brain biopsies: intraoperative versus final diagnosis: influence of clinical factors. Neurosurgery. 2005;56(2):257–265. doi: 10.1227/01.neu.0000148899.39020.87. [DOI] [PubMed] [Google Scholar]
- 34.Nabavi A, Black PM, Gering DT, et al. Serial intraoperative magnetic resonance imaging of brain shift. Neurosurgery. 2001;48(4):787–797. doi: 10.1097/00006123-200104000-00019. [DOI] [PubMed] [Google Scholar]
- 35.Jolesz FA. Future perspectives for intraoperative MRI. Neurosurg Clin N Am. 2005;16(1):201–213. doi: 10.1016/j.nec.2004.07.011. [DOI] [PubMed] [Google Scholar]
- 36.Malhotra V, Malik R, Gondal R, Beohar PC, Parkash B. Evaluation of histological appearance of tissues removed by cavitron ultrasonic surgical aspirator (CUSA) Acta Neurochir (Wien) 1986;81(3–4):132–134. doi: 10.1007/BF01401235. [DOI] [PubMed] [Google Scholar]
- 37.Richmond IL, Hawksley CA. Evaluation of the histopathology of brain tumor tissue obtained by ultrasonic aspiration. Neurosurgery. 1983;13(4):415–419. doi: 10.1227/00006123-198310000-00012. [DOI] [PubMed] [Google Scholar]
- 38.Blackie RA, Gordon A. Histological appearances of intracranial biopsies obtained using the Cavitron ultrasonic surgical aspirator. J Clin Pathol. 1984;37(10):1101–1104. doi: 10.1136/jcp.37.10.1101. [DOI] [PMC free article] [PubMed] [Google Scholar]
- 39.Mountford CE, Doran S, Lean CL, Russell P. Proton MRS can determine the pathology of human cancers with a high level of accuracy. Chem Rev. 2004;104(8):3677–3704. doi: 10.1021/cr030410g. [DOI] [PubMed] [Google Scholar]
- 40.Somorjai RL, Dolenko B, Nikulin AK, et al. Classification of 1H MR spectra of human brain neoplasms: the influence of preprocessing and computerized consensus diagnosis on classification accuracy. J Magn Reson Imaging. 1996;6(3):437–444. doi: 10.1002/jmri.1880060305. [DOI] [PubMed] [Google Scholar]
- 41.Cheng LL, Chang IW, Louis DN, Gonzalez RG. Correlation of high-resolution magic angle spinning proton magnetic resonance spectroscopy with histopathology of intact human brain tumor specimens. Cancer Res. 1998;58(9):1825–1832. [PubMed] [Google Scholar]
- 42.Tzika AA, Cheng LL, Goumnerova L, et al. Biochemical characterization of pediatric brain tumors by using in vivo and ex vivo magnetic resonance spectroscopy. J Neurosurg. 2002;96(6):1023–1031. doi: 10.3171/jns.2002.96.6.1023. [DOI] [PubMed] [Google Scholar]
- 43.Chen H, Pan Z, Talaty N, Raftery D, Cooks RG. Combining desorption electrospray ionization mass spectrometry and nuclear magnetic resonance for differential metabolomics without sample preparation. Rapid Commun Mass Spectrom. 2006;20(10):1577–1584. doi: 10.1002/rcm.2474. [DOI] [PubMed] [Google Scholar]
Associated Data
This section collects any data citations, data availability statements, or supplementary materials included in this article.


